Seattle Airbnb Market Analysis 2026: Short Term Rental Data & Vacation Rental Statistics in Washington, United States
Is Airbnb profitable in Seattle in 2026? Explore comprehensive Airbnb analytics for Seattle, Washington, United States to uncover income potential. This 2026 STR market report for Seattle, based on AirROI data from February 2025 to January 2026, reveals key trends in the bustling market of 5,216 active listings.
Whether you're considering an Airbnb investment in Seattle, optimizing your existing vacation rental, or exploring rental arbitrage opportunities, understanding the Seattle Airbnb data is crucial. Navigating the high regulation landscape is key to maximizing your short term rental income potential. Let's dive into the specifics.
Key Seattle Airbnb Performance Metrics Overview
Monthly Airbnb Revenue Variations & Income Potential in Seattle (2026)
Understanding the monthly revenue variations for Airbnb listings in Seattle is key to maximizing your short term rental income potential. Seasonality significantly impacts earnings. Our analysis, based on data from the past 12 months, shows that the peak revenue month for STRs in Seattle is typically July, while February often presents the lowest earnings, highlighting opportunities for strategic pricing adjustments during shoulder and low seasons. Explore the typical Airbnb income in Seattle across different performance tiers:
- Best-in-class properties (Top 10%) achieve $7,298+ monthly, often utilizing dynamic pricing and superior guest experiences.
- Strong performing properties (Top 25%) earn $5,046 or more, indicating effective management and desirable locations/amenities.
- Typical properties (Median) generate around $3,203 per month, representing the average market performance.
- Entry-level properties (Bottom 25%) see earnings around $1,811, often with potential for optimization.
Average Monthly Airbnb Earnings Trend in Seattle
Seattle Airbnb Occupancy Rate Trends (2026)
Maximize your bookings by understanding the Seattle STR occupancy trends. Seasonal demand shifts significantly influence how often properties are booked. Typically, Julysees the highest demand (peak season occupancy), while January experiences the lowest (low season). Effective strategies, like adjusting minimum stays or offering promotions, can boost occupancy during slower periods. Here's how different property tiers perform in Seattle:
- Best-in-class properties (Top 10%) achieve 87%+ occupancy, indicating high desirability and potentially optimized availability.
- Strong performing properties (Top 25%) maintain 75% or higher occupancy, suggesting good market fit and guest satisfaction.
- Typical properties (Median) have an occupancy rate around 58%.
- Entry-level properties (Bottom 25%) average 35% occupancy, potentially facing higher vacancy.
Average Monthly Occupancy Rate Trend in Seattle
Average Daily Rate (ADR) Airbnb Trends in Seattle (2026)
Effective short term rental pricing strategy in Seattle involves understanding monthly ADR fluctuations. The Average Daily Rate (ADR) for Airbnb in Seattle typically peaks in June and dips lowest during February. Leveraging Airbnb dynamic pricing tools or strategies based on this seasonality can significantly boost revenue. Here's a look at the typical nightly rates achieved:
- Best-in-class properties (Top 10%) command rates of $389+ per night, often due to premium features or locations.
- Strong performing properties (Top 25%) achieve nightly rates of $271 or more.
- Typical properties (Median) charge around $178 per night.
- Entry-level properties (Bottom 25%) earn around $117 per night.
Average Daily Rate (ADR) Trend by Month in Seattle
Get Live Seattle Market Intelligence 👇

Explore Real-time Analytics
Airbnb Seasonality Analysis & Trends in Seattle (2026)
Peak Season (July, June, August)
- Revenue averages $5,630 per month
- Occupancy rates average 67.2%
- Daily rates average $246
Shoulder Season
- Revenue averages $3,543 per month
- Occupancy maintains around 52.6%
- Daily rates hold near $214
Low Season (January, February, April)
- Revenue drops to average $2,486 per month
- Occupancy decreases to average 46.1%
- Daily rates adjust to average $193
Seasonality Insights for Seattle
- The Airbnb seasonality in Seattle shows highly seasonal trends requiring careful strategy. While the sections above show seasonal averages, it's also insightful to look at the extremes:
- During the high season, the absolute peak month showcases Seattle's highest earning potential, with monthly revenues capable of climbing to $5,867, occupancy reaching a high of 68.3%, and ADRs peaking at $250.
- Conversely, the slowest single month of the year, typically falling within the low season, marks the market's lowest point. In this month, revenue might dip to $2,240, occupancy could drop to 37.9%, and ADRs may adjust down to $182.
- Understanding both the seasonal averages and these monthly peaks and troughs in revenue, occupancy, and ADR is crucial for maximizing your Airbnb profit potential in Seattle.
Seasonal Strategies for Maximizing Profit
- Peak Season: Maximize revenue through premium pricing and potentially longer minimum stays. Ensure high availability.
- Low Season: Offer competitive pricing, special promotions (e.g., extended stay discounts), and flexible cancellation policies. Target off-season travelers like remote workers or budget-conscious guests.
- Shoulder Seasons: Implement dynamic pricing that balances peak and low rates. Target weekend travelers or specific events. Offer slightly more flexible terms than peak season.
- Regularly analyze your own performance against these Seattle seasonality benchmarks and adjust your pricing and availability strategy accordingly.
Best Areas for Airbnb Investment in Seattle (2026)
Exploring the top neighborhoods for short-term rentals in Seattle? This section highlights key areas, outlining why they are attractive for hosts and guests, along with notable local attractions. Consider these locations based on your target guest profile and investment strategy.
| Neighborhood / Area | Why Host Here? (Target Guests & Appeal) | Key Attractions & Landmarks |
|---|---|---|
| Capitol Hill | Vibrant neighborhood known for its lively nightlife, diverse dining, and cultural scene. Popular with young travelers and those looking for a lively atmosphere close to downtown. | Volunteer Park, Capitol Hill Farmers Market, Pike/Pine corridor, Seattle Asian Art Museum, Cal Anderson Park |
| Pike Place Market | Iconic Seattle market famous for its fresh seafood, artisanal foods, and local crafts. A must-visit for tourists and an ideal area for short-term rentals due to high foot traffic. | Pike Place Market, Gum Wall, Seattle Aquarium, The Great Wheel, Seattle Art Museum |
| South Lake Union | Bustling area with tech companies and a vibrant waterfront. Attractive to business travelers and tourists, especially those visiting the nearby museums and attractions. | The Museum of Pop Culture, Chihuly Garden and Glass, Lake Union Park, Seattle Center, Amazon Spheres |
| Ballard | Charming neighborhood with a rich maritime history, craft breweries, and local restaurants. Great for families and those seeking a slower pace near the water. | Ballard Locks, Golden Gardens Park, Ballard Farmers Market, Fishermen's Terminal, Ballard Brewery District |
| West Seattle | Residential neighborhood known for its stunning views and proximity to Alki Beach. Ideal for families and tourists seeking a beach escape with a local feel. | Alki Beach Park, Lincoln Park, West Seattle Junction, Duwamish River, Lowman Beach Park |
| University District | Home to the University of Washington, this area has a youthful vibe with various dining, shopping, and entertainment options. Popular among students and university visitors. | University of Washington, Kerry Park, University Village, The Ave (University Way), Washington Park Arboretum |
| Belltown | Trendy area with a mix of modern apartments, restaurants, and nightlife. Located close to downtown and Seattle’s waterfront, attracting both tourists and business travelers. | Belltown Inn, Pike Place Market, Seattle Waterfront, Olympic Sculpture Park, Space Needle |
| Queen Anne | Scenic neighborhood with spectacular views of downtown Seattle and Puget Sound. Known for its historic homes and proximity to popular attractions like the Space Needle. | Kerry Park, Seattle Center, Space Needle, Chihuly Garden and Glass, Queen Anne Avenue |
Understanding Airbnb License Requirements & STR Laws in Seattle (2026)
Yes, Seattle, Washington, United States enforces high STR regulations. Obtaining a license and ensuring compliance is almost certainly required according to current 2026 STR laws. Always verify the latest short term rental regulations and Airbnb license requirements directly with local government authorities for Seattle to ensure full compliance before hosting.
(Source: AirROI data, 2026, based on 86% licensed listings)
Top Performing Airbnb Properties in Seattle (2026)
Benchmark your potential! Explore examples of top-performing Airbnb properties in Seattlebased on Trailing Twelve Month (TTM) revenue. Analyze their characteristics, revenue, occupancy rate, and ADR to understand what drives success in this market.
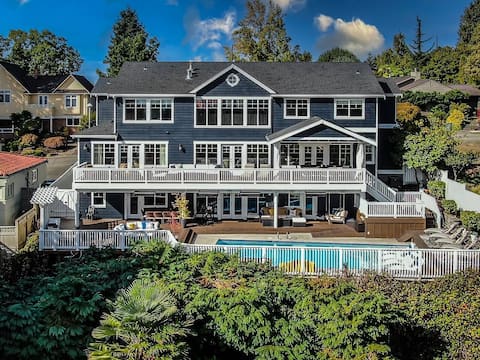
Seattle Resort with pool heated all year sleeps 16
Entire Place • 6 bedrooms

Water & Mountain Views · Sleeps 20 · 2 Kitchens
Entire Place • 7 bedrooms

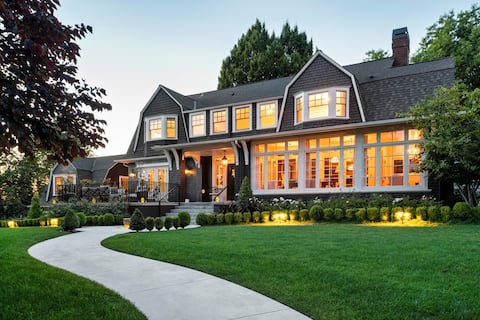
Luxury Home with Lake Views & Theater
Entire Place • 6 bedrooms
8B6BA 10 beds sleeps 20 Duplex w Theatre & Rooftop
Entire Place • 8 bedrooms
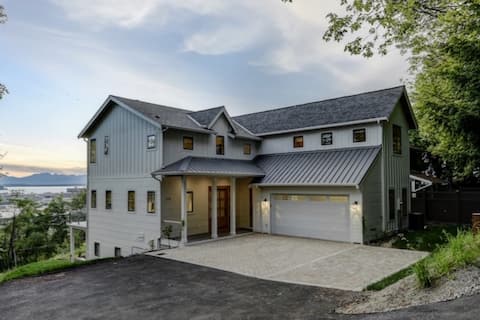
Luxury Seattle Farmhouse | Views & Bonus Suite
Entire Place • 8 bedrooms
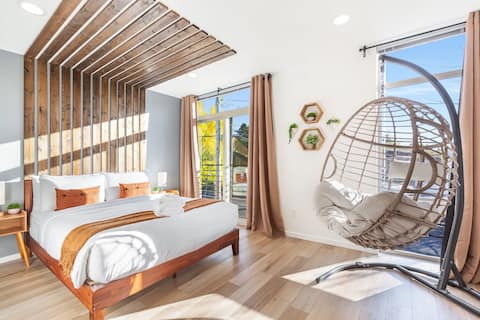
Romantic, Vintage Estate -University of Washington
Entire Place • 5 bedrooms
Note: Performance varies based on location, size, amenities, seasonality, and management quality. Data reflects the past 12 months.
Top Performing Airbnb Hosts in Seattle (2026)
Learn from the best! This table showcases top-performing Airbnb hosts in Seattle based on the number of properties managed and estimated total revenue over the past year. Analyze their scale and performance metrics.
| Host Name | Properties | Grossing Revenue | Stay Reviews | Avg Rating |
|---|---|---|---|---|
| Perch Vacations & Homes | 66 | $4,427,112 | 6877 | 4.89/5.0 |
| Eva And Sid | 37 | $3,451,727 | 2991 | 4.97/5.0 |
| Vince | 104 | $3,378,238 | 7415 | 4.65/5.0 |
| Ashley & Mike | 47 | $2,991,968 | 4888 | 4.83/5.0 |
| Allen Lu | 50 | $2,919,159 | 2204 | 4.83/5.0 |
| Sherry | 40 | $2,473,939 | 2937 | 4.91/5.0 |
| Ming | 29 | $2,211,247 | 1629 | 4.85/5.0 |
| Kathryn And Mike | 31 | $1,953,843 | 3188 | 4.86/5.0 |
| Air Concierge Vacation Homes | 22 | $1,243,709 | 793 | 4.82/5.0 |
| Ken | 19 | $1,216,566 | 2924 | 4.84/5.0 |
Analyzing the strategies of top hosts, such as their property selection, pricing, and guest communication, can offer valuable lessons for optimizing your own Airbnb operations in Seattle.
Dive Deeper: Advanced Seattle STR Market Data (2026)
Ready to unlock more insights? AirROI provides access to advanced metrics and comprehensive Airbnb data for Seattle. Explore detailed analytics beyond this report to refine your investment strategy, optimize pricing, and maximize your vacation rental profits.
Explore Advanced MetricsSeattle Short-Term Rental Market Composition (2026): Property & Room Types
Room Type Distribution
Property Type Distribution
Market Composition Insights for Seattle
- The Seattle Airbnb market composition is heavily skewed towards Entire Home/Apt listings, which make up 85% of the 5,216 active rentals. This indicates strong guest preference for privacy and space.
- Looking at the property type distribution in Seattle, House properties are the most common (50.9%), reflecting the local real estate landscape.
- Houses represent a significant 50.9% portion, catering likely to families or larger groups.
- The presence of 7% Hotel/Boutique listings indicates integration with traditional hospitality.
- Smaller segments like outdoor/unique, unique stays (combined 0.3%) offer potential for unique stay experiences.
Seattle Airbnb Room Capacity Analysis (2026): Bedroom Distribution
Distribution of Listings by Number of Bedrooms
Room Capacity Insights for Seattle
- The dominant room capacity in Seattle is 1 bedroom listings, making up 33.7% of the market. This suggests a strong demand for properties suitable for couples or solo travelers.
- Together, 1 bedroom and 2 bedrooms properties represent 59.5% of the active Airbnb listings in Seattle, indicating a high concentration in these sizes.
- A significant 20.7% of listings offer 3+ bedrooms, catering to larger groups and families seeking more space in Seattle.
Seattle Vacation Rental Guest Capacity Trends (2026)
Distribution of Listings by Guest Capacity
Guest Capacity Insights for Seattle
- The most common guest capacity trend in Seattle vacation rentals is listings accommodating 4 guests (23.5%). This suggests the primary traveler segment is likely small families or groups.
- Properties designed for 4 guests and 2 guests dominate the Seattle STR market, accounting for 46.8% of listings.
- 27.5% of properties accommodate 6+ guests, serving the market segment for larger families or group travel in Seattle.
- On average, properties in Seattle are equipped to host 3.8 guests.
Seattle Airbnb Booking Patterns (2026): Available vs. Booked Days
Available Days Distribution
Booked Days Distribution
Booking Pattern Insights for Seattle
- The most common availability pattern in Seattle falls within the 91-180 days range, representing 33% of listings. This suggests many properties have significant open periods on their calendars.
- Approximately 58.0% of listings show high availability (181+ days open annually), indicating potential for increased bookings or specific owner usage patterns.
- For booked days, the 181-270 days range is most frequent in Seattle (33.7%), reflecting common guest stay durations or potential owner blocking patterns.
- A notable 43.7% of properties secure long booking periods (181+ days booked per year), highlighting successful long-term rental strategies or significant owner usage.
Seattle Airbnb Minimum Stay Requirements Analysis
Distribution of Listings by Minimum Night Requirement
1 Night
967 listings
18.5% of total
2 Nights
1079 listings
20.7% of total
3 Nights
196 listings
3.8% of total
4-6 Nights
305 listings
5.8% of total
7-29 Nights
452 listings
8.7% of total
30+ Nights
2215 listings
42.5% of total
Key Insights
- The most prevalent minimum stay requirement in Seattle is 30+ Nights, adopted by 42.5% of listings. This highlights the market's preference for longer commitments.
- A significant segment (42.5%) caters to monthly stays (30+ nights) in Seattle, pointing to opportunities in the extended-stay market.
Recommendations
- Align with the market by considering a 30+ Nights minimum stay, as 42.5% of Seattle hosts use this setting.
- If feasible, allowing 1-night stays, especially midweek or during low season, could capture last-minute bookings, as only 18.5% currently do.
- Explore offering discounts for stays of 30+ nights to attract the 42.5% of the market seeking extended stays.
- Adjust minimum nights based on seasonality – potentially shorter during low season and longer during peak demand periods in Seattle.
Seattle Airbnb Cancellation Policy Trends Analysis (2026)
Refundable
9 listings
0.2% of total
Super Strict 60 Days
34 listings
0.7% of total
Limited
122 listings
2.3% of total
Non-refundable
13 listings
0.2% of total
Super Strict 30 Days
75 listings
1.4% of total
Flexible
676 listings
13% of total
Moderate
1569 listings
30.1% of total
Firm
1870 listings
35.9% of total
Strict
839 listings
16.1% of total
Cancellation Policy Insights for Seattle
- The prevailing Airbnb cancellation policy trend in Seattle is Firm, used by 35.9% of listings.
- A majority (52.0%) of hosts in Seattle utilize Firm or Strict policies, indicating a market where hosts prioritize booking security.
Recommendations for Hosts
- Consider adopting a Firm policy to align with the 35.9% market standard in Seattle.
- Regularly review your cancellation policy against competitors and market demand shifts in Seattle.
Seattle STR Booking Lead Time Analysis (2026)
Average Booking Lead Time by Month
Booking Lead Time Insights for Seattle
- The overall average booking lead time for vacation rentals in Seattle is 41 days.
- Guests book furthest in advance for stays during July (average 61 days), likely coinciding with peak travel demand or local events.
- The shortest booking windows occur for stays in January (average 27 days), indicating more last-minute travel plans during this time.
- Seasonally, Summer (57 days avg.) sees the longest lead times, while Winter (30 days avg.) has the shortest, reflecting typical travel planning cycles.
Recommendations for Hosts
- Use the overall average lead time (41 days) as a baseline for your pricing and availability strategy in Seattle.
- For July stays, consider implementing length-of-stay discounts or slightly higher rates for bookings made less than 61 days out to capitalize on advance planning.
- Target marketing efforts for the Summer season well in advance (at least 57 days) to capture early planners.
- Monitor your own booking lead times against these Seattle averages to identify opportunities for dynamic pricing adjustments.
Popular & Essential Airbnb Amenities in Seattle (2026)
Amenity Prevalence
Amenity Insights for Seattle
- Essential amenities in Seattle that guests expect include: Wifi, Smoke alarm, Heating, Hot water, Carbon monoxide alarm. Lacking these (any) could significantly impact bookings.
- Popular amenities like Dishes and silverware, Shampoo, Hangers are common but not universal. Offering these can provide a competitive edge.
Recommendations for Hosts
- Ensure your listing includes all essential amenities for Seattle: Wifi, Smoke alarm, Heating, Hot water, Carbon monoxide alarm.
- Prioritize adding missing essentials: Wifi, Smoke alarm, Heating, Hot water, Carbon monoxide alarm.
- Consider adding popular differentiators like Dishes and silverware or Shampoo to increase appeal.
- Highlight unique or less common amenities you offer (e.g., hot tub, dedicated workspace, EV charger) in your listing description and photos.
- Regularly check competitor amenities in Seattle to stay competitive.
Seattle Airbnb Guest Demographics & Profile Analysis (2026)
Guest Profile Summary for Seattle
- The typical guest profile for Airbnb in Seattle consists of primarily domestic travelers (90%), often arriving from nearby Seattle, typically belonging to the Post-2000s (Gen Z/Alpha) group (50%), primarily speaking English or Spanish.
- Domestic travelers account for 89.7% of guests.
- Key international markets include United States (89.7%) and Canada (3.4%).
- Top languages spoken are English (64.8%) followed by Spanish (13.9%).
- A significant demographic segment is the Post-2000s (Gen Z/Alpha) group, representing 50% of guests.
Recommendations for Hosts
- Target domestic marketing efforts towards travelers from Seattle and Portland.
- Tailor amenities and listing descriptions to appeal to the dominant Post-2000s (Gen Z/Alpha) demographic (e.g., highlight fast WiFi, smart home features, local guides).
- Highlight unique local experiences or amenities relevant to the primary guest profile.
- Consider seasonal promotions aligned with peak travel times for key origin markets.
Nearby Short-Term Rental Market Comparison
How does the Seattle Airbnb market stack up against its neighbors? Compare key performance metrics like average monthly revenue, ADR, and occupancy rates in surrounding areas to understand the broader regional STR landscape.
| Market | Active Properties | Monthly Revenue | Daily Rate | Avg. Occupancy |
|---|---|---|---|---|
| Erlands Point-Kitsap Lake | 12 | $5,285 | $366.41 | 47% |
| North Bend | 51 | $5,073 | $352.89 | 57% |
| Olalla | 13 | $4,868 | $334.79 | 49% |
| Sudden Valley | 63 | $4,821 | $324.44 | 51% |
| Warm Beach | 10 | $4,811 | $319.50 | 43% |
| Verlot | 11 | $4,608 | $314.03 | 49% |
| Canyon Creek | 13 | $4,568 | $301.22 | 51% |
| Ronald | 153 | $4,567 | $456.22 | 35% |
| Sultan | 17 | $4,436 | $300.44 | 51% |
| Woodinville | 35 | $4,409 | $340.44 | 51% |