Lilliwaup Airbnb Market Analysis 2026: Short Term Rental Data & Vacation Rental Statistics in Washington, United States
Is Airbnb profitable in Lilliwaup in 2026? Explore comprehensive Airbnb analytics for Lilliwaup, Washington, United States to uncover income potential. This 2026 STR market report for Lilliwaup, based on AirROI data from February 2025 to January 2026, reveals key trends in the niche market of 51 active listings.
Whether you're considering an Airbnb investment in Lilliwaup, optimizing your existing vacation rental, or exploring rental arbitrage opportunities, understanding the Lilliwaup Airbnb data is crucial. Leveraging the low regulation environment is key to maximizing your short term rental income potential. Let's dive into the specifics.
Key Lilliwaup Airbnb Performance Metrics Overview
Monthly Airbnb Revenue Variations & Income Potential in Lilliwaup (2026)
Understanding the monthly revenue variations for Airbnb listings in Lilliwaup is key to maximizing your short term rental income potential. Seasonality significantly impacts earnings. Our analysis, based on data from the past 12 months, shows that the peak revenue month for STRs in Lilliwaup is typically July, while February often presents the lowest earnings, highlighting opportunities for strategic pricing adjustments during shoulder and low seasons. Explore the typical Airbnb income in Lilliwaup across different performance tiers:
- Best-in-class properties (Top 10%) achieve $7,202+ monthly, often utilizing dynamic pricing and superior guest experiences.
- Strong performing properties (Top 25%) earn $4,113 or more, indicating effective management and desirable locations/amenities.
- Typical properties (Median) generate around $1,830 per month, representing the average market performance.
- Entry-level properties (Bottom 25%) see earnings around $994, often with potential for optimization.
Average Monthly Airbnb Earnings Trend in Lilliwaup
Lilliwaup Airbnb Occupancy Rate Trends (2026)
Maximize your bookings by understanding the Lilliwaup STR occupancy trends. Seasonal demand shifts significantly influence how often properties are booked. Typically, Augustsees the highest demand (peak season occupancy), while October experiences the lowest (low season). Effective strategies, like adjusting minimum stays or offering promotions, can boost occupancy during slower periods. Here's how different property tiers perform in Lilliwaup:
- Best-in-class properties (Top 10%) achieve 61%+ occupancy, indicating high desirability and potentially optimized availability.
- Strong performing properties (Top 25%) maintain 46% or higher occupancy, suggesting good market fit and guest satisfaction.
- Typical properties (Median) have an occupancy rate around 25%.
- Entry-level properties (Bottom 25%) average 14% occupancy, potentially facing higher vacancy.
Average Monthly Occupancy Rate Trend in Lilliwaup
Average Daily Rate (ADR) Airbnb Trends in Lilliwaup (2026)
Effective short term rental pricing strategy in Lilliwaup involves understanding monthly ADR fluctuations. The Average Daily Rate (ADR) for Airbnb in Lilliwaup typically peaks in July and dips lowest during March. Leveraging Airbnb dynamic pricing tools or strategies based on this seasonality can significantly boost revenue. Here's a look at the typical nightly rates achieved:
- Best-in-class properties (Top 10%) command rates of $414+ per night, often due to premium features or locations.
- Strong performing properties (Top 25%) achieve nightly rates of $283 or more.
- Typical properties (Median) charge around $217 per night.
- Entry-level properties (Bottom 25%) earn around $164 per night.
Average Daily Rate (ADR) Trend by Month in Lilliwaup
Get Live Lilliwaup Market Intelligence 👇

Explore Real-time Analytics
Airbnb Seasonality Analysis & Trends in Lilliwaup (2026)
Peak Season (July, August, June)
- Revenue averages $4,699 per month
- Occupancy rates average 43.8%
- Daily rates average $276
Shoulder Season
- Revenue averages $2,662 per month
- Occupancy maintains around 29.0%
- Daily rates hold near $241
Low Season (February, March, October)
- Revenue drops to average $1,712 per month
- Occupancy decreases to average 24.5%
- Daily rates adjust to average $226
Seasonality Insights for Lilliwaup
- The Airbnb seasonality in Lilliwaup shows highly seasonal trends requiring careful strategy. While the sections above show seasonal averages, it's also insightful to look at the extremes:
- During the high season, the absolute peak month showcases Lilliwaup's highest earning potential, with monthly revenues capable of climbing to $5,169, occupancy reaching a high of 48.2%, and ADRs peaking at $279.
- Conversely, the slowest single month of the year, typically falling within the low season, marks the market's lowest point. In this month, revenue might dip to $1,302, occupancy could drop to 20.9%, and ADRs may adjust down to $218.
- Understanding both the seasonal averages and these monthly peaks and troughs in revenue, occupancy, and ADR is crucial for maximizing your Airbnb profit potential in Lilliwaup.
Seasonal Strategies for Maximizing Profit
- Peak Season: Maximize revenue through premium pricing and potentially longer minimum stays. Ensure high availability.
- Low Season: Offer competitive pricing, special promotions (e.g., extended stay discounts), and flexible cancellation policies. Target off-season travelers like remote workers or budget-conscious guests.
- Shoulder Seasons: Implement dynamic pricing that balances peak and low rates. Target weekend travelers or specific events. Offer slightly more flexible terms than peak season.
- Regularly analyze your own performance against these Lilliwaup seasonality benchmarks and adjust your pricing and availability strategy accordingly.
Best Areas for Airbnb Investment in Lilliwaup (2026)
Exploring the top neighborhoods for short-term rentals in Lilliwaup? This section highlights key areas, outlining why they are attractive for hosts and guests, along with notable local attractions. Consider these locations based on your target guest profile and investment strategy.
| Neighborhood / Area | Why Host Here? (Target Guests & Appeal) | Key Attractions & Landmarks |
|---|---|---|
| Hoodsport | A charming community near the Hood Canal, popular for its waterfront views and outdoor activities. Great for visitors looking to enjoy kayaking, fishing, and hiking in Olympic National Park. | Hood Canal, Hoodsport Winery, Skokomish Park, Potlatch State Park, Olympic National Park |
| Union | A small coastal town known for its picturesque views of the water and mountains. Ideal for families and couples seeking relaxation and outdoor adventures. | Pickering Passage, Allyn Park, Union Point Park, Walsh Lake, Skokomish River |
| Lilliwaup | A serene and scenic area located along Hood Canal, perfect for those wanting to escape the hustle and bustle of city life. Close to nature trails and waterfront activities. | Hood Canal, Lilliwaup River, Kah Tai Lagoon Nature Park, Olympic National Park, Hood Canal Bridge |
| Quilcene | A quiet town near the Olympic National Forest, offering incredible hiking, bird watching, and a peaceful atmosphere. Attractive for outdoor enthusiasts. | Quilcene Bay, Olympic National Forest, Lake Lillian, Mount Walker, Skokomish Valley |
| Bremerton | A vibrant city with a rich naval history, providing a mix of cultural attractions and waterfront fun. It’s a good spot for tourists visiting the Puget Sound region. | Puget Sound Navy Museum, Bremerton Boardwalk, Washington State from Bremerton, Kitsap Conference Center, Bremerton Ferry |
| Port Townsend | Known for its Victorian architecture and artsy community, it offers a mix of history, art, and stunning bay views. A desirable location for visitors looking for unique experiences. | Fort Worden State Park, Port Townsend Marine Science Center, Historic Downtown, Jefferson Museum of Art & History, North Beach |
| Seabeck | A small community with stunning waterfront views and proximity to the Olympic Mountains. Ideal for those looking for a rustic retreat with outdoor access. | Seabeck Marina, Lone Rock, Theler Community Center, Kitsap County Parks, Chico Creek |
| Allyn | Located along the shores of Case Inlet, Allyn serves as a great base for exploring the surrounding natural beauty and historic sites. Perfect for vacationers seeking tranquility and beauty. | Allyn Waterfront Park, Case Inlet, Olympic National Park, Allyn's Historic District, Skokomish Valley |
Understanding Airbnb License Requirements & STR Laws in Lilliwaup (2026)
While Lilliwaup, Washington, United States currently shows low STR regulations, specific Airbnb license requirements might still exist or change. Always verify the latest short term rental regulations and Airbnb license requirements directly with local government authorities for Lilliwaup to ensure full compliance before hosting.
(Source: AirROI data, 2026, finding no licensed listings among those analyzed)
Top Performing Airbnb Properties in Lilliwaup (2026)
Benchmark your potential! Explore examples of top-performing Airbnb properties in Lilliwaupbased on Trailing Twelve Month (TTM) revenue. Analyze their characteristics, revenue, occupancy rate, and ADR to understand what drives success in this market.

Hamma Hamma Hideaway Beach Front Bungalows
Entire Place • 4 bedrooms

Huge deck, hot tub, near trails, beaches, & parks
Entire Place • 5 bedrooms
Hood Canal Beachfront Getaway
Entire Place • 4 bedrooms
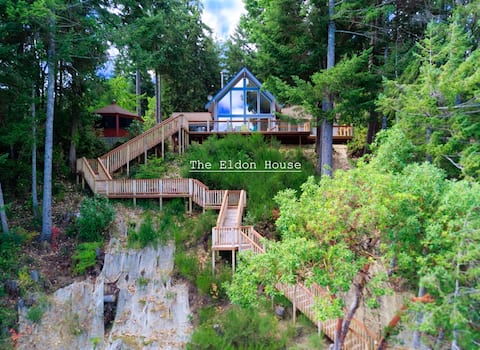
Waterfront Retreat: Eldon House on Hood Canal
Entire Place • 3 bedrooms
Hood Canal Private Beach-Olympic NP-Sleeps10-Kayak
Entire Place • 4 bedrooms

Water Front on Hood Canal - Hot Tub & EV Charger
Entire Place • 2 bedrooms
Note: Performance varies based on location, size, amenities, seasonality, and management quality. Data reflects the past 12 months.
Top Performing Airbnb Hosts in Lilliwaup (2026)
Learn from the best! This table showcases top-performing Airbnb hosts in Lilliwaup based on the number of properties managed and estimated total revenue over the past year. Analyze their scale and performance metrics.
| Host Name | Properties | Grossing Revenue | Stay Reviews | Avg Rating |
|---|---|---|---|---|
| Mikes Beach Resort | 25 | $157,034 | 414 | 4.40/5.0 |
| Kyle | 1 | $98,681 | 90 | 4.99/5.0 |
| Lucy | 1 | $93,144 | 40 | 4.95/5.0 |
| Cher | 1 | $93,042 | 62 | 4.87/5.0 |
| Sunil | 1 | $78,401 | 379 | 4.88/5.0 |
| Family Retreats And Adventures | 1 | $77,587 | 51 | 4.98/5.0 |
| Suzanne | 1 | $66,399 | 155 | 4.97/5.0 |
| Anita | 1 | $61,666 | 72 | 4.93/5.0 |
| Krystina | 1 | $46,806 | 199 | 4.93/5.0 |
| Annette | 1 | $45,163 | 31 | 4.97/5.0 |
Analyzing the strategies of top hosts, such as their property selection, pricing, and guest communication, can offer valuable lessons for optimizing your own Airbnb operations in Lilliwaup.
Dive Deeper: Advanced Lilliwaup STR Market Data (2026)
Ready to unlock more insights? AirROI provides access to advanced metrics and comprehensive Airbnb data for Lilliwaup. Explore detailed analytics beyond this report to refine your investment strategy, optimize pricing, and maximize your vacation rental profits.
Explore Advanced MetricsLilliwaup Short-Term Rental Market Composition (2026): Property & Room Types
Room Type Distribution
Property Type Distribution
Market Composition Insights for Lilliwaup
- The Lilliwaup Airbnb market composition is heavily skewed towards Entire Home/Apt listings, which make up 96.1% of the 51 active rentals. This indicates strong guest preference for privacy and space.
- Looking at the property type distribution in Lilliwaup, Outdoor/Unique properties are the most common (47.1%), reflecting the local real estate landscape.
- Houses represent a significant 39.2% portion, catering likely to families or larger groups.
Lilliwaup Airbnb Room Capacity Analysis (2026): Bedroom Distribution
Distribution of Listings by Number of Bedrooms
Room Capacity Insights for Lilliwaup
- The dominant room capacity in Lilliwaup is 1 bedroom listings, making up 56.9% of the market. This suggests a strong demand for properties suitable for couples or solo travelers.
- Together, 1 bedroom and 3 bedrooms properties represent 76.5% of the active Airbnb listings in Lilliwaup, indicating a high concentration in these sizes.
- With over half the market (56.9%) consisting of studios or 1-bedroom units, Lilliwaup is particularly well-suited for individuals or couples.
- A significant 33.3% of listings offer 3+ bedrooms, catering to larger groups and families seeking more space in Lilliwaup.
Lilliwaup Vacation Rental Guest Capacity Trends (2026)
Distribution of Listings by Guest Capacity
Guest Capacity Insights for Lilliwaup
- The most common guest capacity trend in Lilliwaup vacation rentals is listings accommodating 2 guests (43.1%). This suggests the primary traveler segment is likely couples or solo travelers.
- Properties designed for 2 guests and 8+ guests dominate the Lilliwaup STR market, accounting for 64.7% of listings.
- A significant 43.1% of listings cater specifically to 1-2 guests, highlighting strong demand from couples and solo travelers in Lilliwaup.
- 39.2% of properties accommodate 6+ guests, serving the market segment for larger families or group travel in Lilliwaup.
- On average, properties in Lilliwaup are equipped to host 4.3 guests.
Lilliwaup Airbnb Booking Patterns (2026): Available vs. Booked Days
Available Days Distribution
Booked Days Distribution
Booking Pattern Insights for Lilliwaup
- The most common availability pattern in Lilliwaup falls within the 271-366 days range, representing 68.6% of listings. This suggests many properties have significant open periods on their calendars.
- Approximately 94.1% of listings show high availability (181+ days open annually), indicating potential for increased bookings or specific owner usage patterns.
- For booked days, the 1-30 days range is most frequent in Lilliwaup (43.1%), reflecting common guest stay durations or potential owner blocking patterns.
- A notable 7.8% of properties secure long booking periods (181+ days booked per year), highlighting successful long-term rental strategies or significant owner usage.
Lilliwaup Airbnb Minimum Stay Requirements Analysis
Distribution of Listings by Minimum Night Requirement
1 Night
30 listings
58.8% of total
2 Nights
8 listings
15.7% of total
4-6 Nights
2 listings
3.9% of total
7-29 Nights
2 listings
3.9% of total
30+ Nights
9 listings
17.6% of total
Key Insights
- The most prevalent minimum stay requirement in Lilliwaup is 1 Night, adopted by 58.8% of listings. This highlights the market's preference for shorter, flexible bookings.
- A strong majority (74.5%) of the Lilliwaup Airbnb data shows acceptance of very short stays (1-2 nights), indicating a dynamic, high-turnover market.
- A significant segment (17.6%) caters to monthly stays (30+ nights) in Lilliwaup, pointing to opportunities in the extended-stay market.
Recommendations
- Align with the market by considering a 1 Night minimum stay, as 58.8% of Lilliwaup hosts use this setting.
- Explore offering discounts for stays of 30+ nights to attract the 17.6% of the market seeking extended stays.
- Adjust minimum nights based on seasonality – potentially shorter during low season and longer during peak demand periods in Lilliwaup.
Lilliwaup Airbnb Cancellation Policy Trends Analysis (2026)
Super Strict 30 Days
3 listings
5.9% of total
Flexible
4 listings
7.8% of total
Moderate
8 listings
15.7% of total
Firm
10 listings
19.6% of total
Strict
26 listings
51% of total
Cancellation Policy Insights for Lilliwaup
- The prevailing Airbnb cancellation policy trend in Lilliwaup is Strict, used by 51% of listings.
- A majority (70.6%) of hosts in Lilliwaup utilize Firm or Strict policies, indicating a market where hosts prioritize booking security.
Recommendations for Hosts
- Consider adopting a Strict policy to align with the 51% market standard in Lilliwaup.
- With 51% using Strict terms, this is a viable option in Lilliwaup, particularly for high-value properties or during peak demand periods.
- Regularly review your cancellation policy against competitors and market demand shifts in Lilliwaup.
Lilliwaup STR Booking Lead Time Analysis (2026)
Average Booking Lead Time by Month
Booking Lead Time Insights for Lilliwaup
- The overall average booking lead time for vacation rentals in Lilliwaup is 53 days.
- Guests book furthest in advance for stays during October (average 90 days), likely coinciding with peak travel demand or local events.
- The shortest booking windows occur for stays in January (average 16 days), indicating more last-minute travel plans during this time.
- Seasonally, Fall (61 days avg.) sees the longest lead times, while Winter (27 days avg.) has the shortest, reflecting typical travel planning cycles.
Recommendations for Hosts
- Use the overall average lead time (53 days) as a baseline for your pricing and availability strategy in Lilliwaup.
- For October stays, consider implementing length-of-stay discounts or slightly higher rates for bookings made less than 90 days out to capitalize on advance planning.
- Target marketing efforts for the Fall season well in advance (at least 61 days) to capture early planners.
- Monitor your own booking lead times against these Lilliwaup averages to identify opportunities for dynamic pricing adjustments.
Popular & Essential Airbnb Amenities in Lilliwaup (2026)
Amenity Prevalence
Amenity Insights for Lilliwaup
- Essential amenities in Lilliwaup that guests expect include: Free parking on premises, Dishes and silverware. Lacking these (any) could significantly impact bookings.
- Popular amenities like Hot water, Carbon monoxide alarm, Coffee maker are common but not universal. Offering these can provide a competitive edge.
Recommendations for Hosts
- Ensure your listing includes all essential amenities for Lilliwaup: Free parking on premises, Dishes and silverware.
- Prioritize adding missing essentials: Dishes and silverware.
- Consider adding popular differentiators like Hot water or Carbon monoxide alarm to increase appeal.
- Highlight unique or less common amenities you offer (e.g., hot tub, dedicated workspace, EV charger) in your listing description and photos.
- Regularly check competitor amenities in Lilliwaup to stay competitive.
Lilliwaup Airbnb Guest Demographics & Profile Analysis (2026)
Guest Profile Summary for Lilliwaup
- The typical guest profile for Airbnb in Lilliwaup consists of primarily domestic travelers (96%), often arriving from nearby Seattle, typically belonging to the Post-2000s (Gen Z/Alpha) group (50%), primarily speaking English or Spanish.
- Domestic travelers account for 96.3% of guests.
- Key international markets include United States (96.3%) and Canada (1.2%).
- Top languages spoken are English (66.5%) followed by Spanish (15.1%).
- A significant demographic segment is the Post-2000s (Gen Z/Alpha) group, representing 50% of guests.
Recommendations for Hosts
- Target domestic marketing efforts towards travelers from Seattle and Portland.
- Tailor amenities and listing descriptions to appeal to the dominant Post-2000s (Gen Z/Alpha) demographic (e.g., highlight fast WiFi, smart home features, local guides).
- Highlight unique local experiences or amenities relevant to the primary guest profile.
- Consider seasonal promotions aligned with peak travel times for key origin markets.
Nearby Short-Term Rental Market Comparison
How does the Lilliwaup Airbnb market stack up against its neighbors? Compare key performance metrics like average monthly revenue, ADR, and occupancy rates in surrounding areas to understand the broader regional STR landscape.
| Market | Active Properties | Monthly Revenue | Daily Rate | Avg. Occupancy |
|---|---|---|---|---|
| Erlands Point-Kitsap Lake | 12 | $5,285 | $366.41 | 47% |
| Olalla | 13 | $4,868 | $334.79 | 49% |
| Sudden Valley | 63 | $4,821 | $324.44 | 51% |
| Warm Beach | 10 | $4,811 | $319.50 | 43% |
| Woodinville | 35 | $4,409 | $340.44 | 51% |
| Moclips | 108 | $4,391 | $433.53 | 39% |
| Amanda Park | 11 | $4,328 | $447.54 | 40% |
| Warrenton | 60 | $4,241 | $385.97 | 43% |
| Friday Harbor | 235 | $4,233 | $420.06 | 43% |
| Eastsound | 269 | $4,153 | $367.43 | 42% |