Kirkland Airbnb Market Analysis 2026: Short Term Rental Data & Vacation Rental Statistics in Washington, United States
Is Airbnb profitable in Kirkland in 2026? Explore comprehensive Airbnb analytics for Kirkland, Washington, United States to uncover income potential. This 2026 STR market report for Kirkland, based on AirROI data from February 2025 to January 2026, reveals key trends in the market of 290 active listings.
Whether you're considering an Airbnb investment in Kirkland, optimizing your existing vacation rental, or exploring rental arbitrage opportunities, understanding the Kirkland Airbnb data is crucial. Understanding the local regulations is key to maximizing your short term rental income potential. Let's dive into the specifics.
Key Kirkland Airbnb Performance Metrics Overview
Monthly Airbnb Revenue Variations & Income Potential in Kirkland (2026)
Understanding the monthly revenue variations for Airbnb listings in Kirkland is key to maximizing your short term rental income potential. Seasonality significantly impacts earnings. Our analysis, based on data from the past 12 months, shows that the peak revenue month for STRs in Kirkland is typically July, while January often presents the lowest earnings, highlighting opportunities for strategic pricing adjustments during shoulder and low seasons. Explore the typical Airbnb income in Kirkland across different performance tiers:
- Best-in-class properties (Top 10%) achieve $7,427+ monthly, often utilizing dynamic pricing and superior guest experiences.
- Strong performing properties (Top 25%) earn $5,056 or more, indicating effective management and desirable locations/amenities.
- Typical properties (Median) generate around $2,980 per month, representing the average market performance.
- Entry-level properties (Bottom 25%) see earnings around $1,567, often with potential for optimization.
Average Monthly Airbnb Earnings Trend in Kirkland
Kirkland Airbnb Occupancy Rate Trends (2026)
Maximize your bookings by understanding the Kirkland STR occupancy trends. Seasonal demand shifts significantly influence how often properties are booked. Typically, Julysees the highest demand (peak season occupancy), while January experiences the lowest (low season). Effective strategies, like adjusting minimum stays or offering promotions, can boost occupancy during slower periods. Here's how different property tiers perform in Kirkland:
- Best-in-class properties (Top 10%) achieve 87%+ occupancy, indicating high desirability and potentially optimized availability.
- Strong performing properties (Top 25%) maintain 74% or higher occupancy, suggesting good market fit and guest satisfaction.
- Typical properties (Median) have an occupancy rate around 54%.
- Entry-level properties (Bottom 25%) average 29% occupancy, potentially facing higher vacancy.
Average Monthly Occupancy Rate Trend in Kirkland
Average Daily Rate (ADR) Airbnb Trends in Kirkland (2026)
Effective short term rental pricing strategy in Kirkland involves understanding monthly ADR fluctuations. The Average Daily Rate (ADR) for Airbnb in Kirkland typically peaks in July and dips lowest during February. Leveraging Airbnb dynamic pricing tools or strategies based on this seasonality can significantly boost revenue. Here's a look at the typical nightly rates achieved:
- Best-in-class properties (Top 10%) command rates of $445+ per night, often due to premium features or locations.
- Strong performing properties (Top 25%) achieve nightly rates of $288 or more.
- Typical properties (Median) charge around $190 per night.
- Entry-level properties (Bottom 25%) earn around $120 per night.
Average Daily Rate (ADR) Trend by Month in Kirkland
Get Live Kirkland Market Intelligence 👇

Explore Real-time Analytics
Airbnb Seasonality Analysis & Trends in Kirkland (2026)
Peak Season (July, August, June)
- Revenue averages $5,433 per month
- Occupancy rates average 64.1%
- Daily rates average $255
Shoulder Season
- Revenue averages $3,500 per month
- Occupancy maintains around 49.1%
- Daily rates hold near $239
Low Season (January, February, April)
- Revenue drops to average $2,610 per month
- Occupancy decreases to average 45.4%
- Daily rates adjust to average $220
Seasonality Insights for Kirkland
- The Airbnb seasonality in Kirkland shows highly seasonal trends requiring careful strategy. While the sections above show seasonal averages, it's also insightful to look at the extremes:
- During the high season, the absolute peak month showcases Kirkland's highest earning potential, with monthly revenues capable of climbing to $5,942, occupancy reaching a high of 67.7%, and ADRs peaking at $256.
- Conversely, the slowest single month of the year, typically falling within the low season, marks the market's lowest point. In this month, revenue might dip to $2,300, occupancy could drop to 36.1%, and ADRs may adjust down to $205.
- Understanding both the seasonal averages and these monthly peaks and troughs in revenue, occupancy, and ADR is crucial for maximizing your Airbnb profit potential in Kirkland.
Seasonal Strategies for Maximizing Profit
- Peak Season: Maximize revenue through premium pricing and potentially longer minimum stays. Ensure high availability.
- Low Season: Offer competitive pricing, special promotions (e.g., extended stay discounts), and flexible cancellation policies. Target off-season travelers like remote workers or budget-conscious guests.
- Shoulder Seasons: Implement dynamic pricing that balances peak and low rates. Target weekend travelers or specific events. Offer slightly more flexible terms than peak season.
- Regularly analyze your own performance against these Kirkland seasonality benchmarks and adjust your pricing and availability strategy accordingly.
Best Areas for Airbnb Investment in Kirkland (2026)
Exploring the top neighborhoods for short-term rentals in Kirkland? This section highlights key areas, outlining why they are attractive for hosts and guests, along with notable local attractions. Consider these locations based on your target guest profile and investment strategy.
| Neighborhood / Area | Why Host Here? (Target Guests & Appeal) | Key Attractions & Landmarks |
|---|---|---|
| Downtown Kirkland | The heart of Kirkland featuring waterfront parks, shops, and restaurants. A prime location for tourists looking to explore the vibrant downtown scene on the shores of Lake Washington. | Kirkland Waterfront Park, Marina Park, Kirkland Arts Center, Kirkland Performance Center, Lake Street |
| Juanita Beach | A family-friendly area known for its beautiful beach and playgrounds. Ideal for guests wanting outdoor recreation and scenic views. | Juanita Beach Park, Juanita Bay Park, Kirkland Marina, Kirkland Park and Ride, Kirkland Beach Park |
| Houghton | A growing neighborhood known for its residential appeal, with proximity to both Lake Washington and downtown Kirkland. Attracts families and business travelers with its quiet charm. | Houghton Beach Park, Dainwood Park, Lake Washington, Houghton Park, Local shops and cafes |
| Totem Lake | A developing area with a mix of residential and commercial amenities. Close to shopping centers, making it attractive for longer stays and business travelers. | Totem Lake Mall, Juanita Bay Park, North Kirkland Community Center, Public transport access, Nearby restaurants |
| Lakeview | A picturesque area along Lake Washington, ideal for nature lovers and those seeking water activities. Offers beautiful views and waterfront access. | Lakeview Park, Waterfront Activities, Scenic walking trails, Kirkland Waterjet, Nearby parks |
| South Kirkland | A quieter neighborhood with easy access to I-405 and local businesses. Suitable for guests looking for a peaceful stay with good transport links. | South Kirkland Park and Ride, Local dining options, Nearby hiking trails, Totem Lake Transit Center, Public parks |
| Bridle Trails | Known for its expansive parks and trails, this neighborhood attracts nature enthusiasts and families. Offers a blend of suburban living and outdoor activities. | Bridle Trails State Park, Hiking and biking trails, Horseback riding, Local parks, Community events |
| Finn Hill | A residential area with its own parks and community feel. Attractive for families and guests looking for a more local experience while still near urban conveniences. | Finn Hill Park, Thompson Park, Nearby schools and community centers, Local shops, Access to hiking trails |
Understanding Airbnb License Requirements & STR Laws in Kirkland (2026)
With 14% of listings showing registration in 2026, understanding potential Airbnb license requirements is crucial in Kirkland. Always verify the latest short term rental regulations and Airbnb license requirements directly with local government authorities for Kirkland to ensure full compliance before hosting.
(Source: AirROI data, 2026, based on 14% licensed listings)
Top Performing Airbnb Properties in Kirkland (2026)
Benchmark your potential! Explore examples of top-performing Airbnb properties in Kirklandbased on Trailing Twelve Month (TTM) revenue. Analyze their characteristics, revenue, occupancy rate, and ADR to understand what drives success in this market.
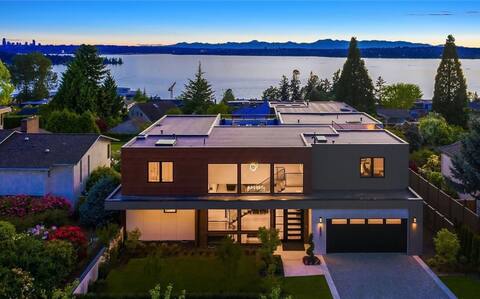
Gorgeous 4 bedroom/5 bath home w/ gym, AC, views!
Entire Place • 4 bedrooms

Downtown Kirkland Lakeview House and Guest Cottage
Entire Place • 3 bedrooms
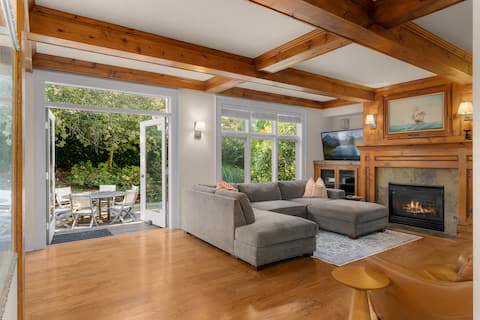
Lake Washington Getaway in Kirkland
Entire Place • 3 bedrooms
Luxury Kirkland Villa, 5 Beds | Rooftop | Theater
Entire Place • 3 bedrooms

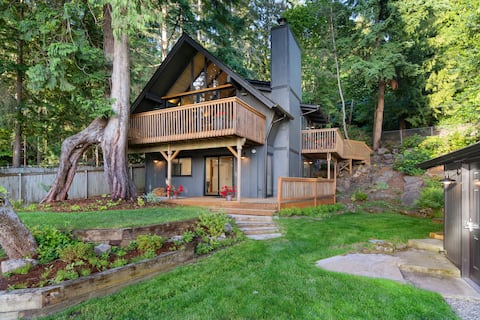
Mid-Century Modern Retreat
Entire Place • 4 bedrooms

Kirkland's Expansive Custom Built Home Near Juanit
Entire Place • 5 bedrooms
Note: Performance varies based on location, size, amenities, seasonality, and management quality. Data reflects the past 12 months.
Top Performing Airbnb Hosts in Kirkland (2026)
Learn from the best! This table showcases top-performing Airbnb hosts in Kirkland based on the number of properties managed and estimated total revenue over the past year. Analyze their scale and performance metrics.
| Host Name | Properties | Grossing Revenue | Stay Reviews | Avg Rating |
|---|---|---|---|---|
| Allen Lu | 7 | $443,738 | 199 | 4.85/5.0 |
| Ruby | 2 | $314,948 | 136 | 4.96/5.0 |
| Duke | 6 | $311,863 | 475 | 4.88/5.0 |
| Alex | 9 | $255,371 | 111 | 4.88/5.0 |
| 2plus Llc | 3 | $229,583 | 188 | 4.87/5.0 |
| Dyane | 6 | $222,080 | 194 | 4.88/5.0 |
| Muni | 2 | $216,001 | 92 | 4.96/5.0 |
| Kevin | 3 | $211,517 | 610 | 4.93/5.0 |
| Teng | 4 | $189,132 | 133 | 4.74/5.0 |
| Valta Realty | 2 | $170,116 | 44 | 4.54/5.0 |
Analyzing the strategies of top hosts, such as their property selection, pricing, and guest communication, can offer valuable lessons for optimizing your own Airbnb operations in Kirkland.
Dive Deeper: Advanced Kirkland STR Market Data (2026)
Ready to unlock more insights? AirROI provides access to advanced metrics and comprehensive Airbnb data for Kirkland. Explore detailed analytics beyond this report to refine your investment strategy, optimize pricing, and maximize your vacation rental profits.
Explore Advanced MetricsKirkland Short-Term Rental Market Composition (2026): Property & Room Types
Room Type Distribution
Property Type Distribution
Market Composition Insights for Kirkland
- The Kirkland Airbnb market composition is heavily skewed towards Entire Home/Apt listings, which make up 77.6% of the 290 active rentals. This indicates strong guest preference for privacy and space.
- Looking at the property type distribution in Kirkland, House properties are the most common (63.8%), reflecting the local real estate landscape.
- Houses represent a significant 63.8% portion, catering likely to families or larger groups.
- The presence of 10.3% Hotel/Boutique listings indicates integration with traditional hospitality.
- Smaller segments like outdoor/unique, unique stays (combined 1.0%) offer potential for unique stay experiences.
Kirkland Airbnb Room Capacity Analysis (2026): Bedroom Distribution
Distribution of Listings by Number of Bedrooms
Room Capacity Insights for Kirkland
- The dominant room capacity in Kirkland is 1 bedroom listings, making up 24.1% of the market. This suggests a strong demand for properties suitable for couples or solo travelers.
- Together, 1 bedroom and 2 bedrooms properties represent 45.8% of the active Airbnb listings in Kirkland, indicating a high concentration in these sizes.
- A significant 32.1% of listings offer 3+ bedrooms, catering to larger groups and families seeking more space in Kirkland.
Kirkland Vacation Rental Guest Capacity Trends (2026)
Distribution of Listings by Guest Capacity
Guest Capacity Insights for Kirkland
- The most common guest capacity trend in Kirkland vacation rentals is listings accommodating 4 guests (20.7%). This suggests the primary traveler segment is likely small families or groups.
- Properties designed for 4 guests and 2 guests dominate the Kirkland STR market, accounting for 38.3% of listings.
- 31.7% of properties accommodate 6+ guests, serving the market segment for larger families or group travel in Kirkland.
- On average, properties in Kirkland are equipped to host 3.8 guests.
Kirkland Airbnb Booking Patterns (2026): Available vs. Booked Days
Available Days Distribution
Booked Days Distribution
Booking Pattern Insights for Kirkland
- The most common availability pattern in Kirkland falls within the 271-366 days range, representing 43.8% of listings. This suggests many properties have significant open periods on their calendars.
- Approximately 69.7% of listings show high availability (181+ days open annually), indicating potential for increased bookings or specific owner usage patterns.
- For booked days, the 91-180 days range is most frequent in Kirkland (28.3%), reflecting common guest stay durations or potential owner blocking patterns.
- A notable 31.4% of properties secure long booking periods (181+ days booked per year), highlighting successful long-term rental strategies or significant owner usage.
Kirkland Airbnb Minimum Stay Requirements Analysis
Distribution of Listings by Minimum Night Requirement
1 Night
40 listings
13.8% of total
2 Nights
53 listings
18.3% of total
3 Nights
30 listings
10.3% of total
4-6 Nights
26 listings
9% of total
7-29 Nights
42 listings
14.5% of total
30+ Nights
99 listings
34.1% of total
Key Insights
- The most prevalent minimum stay requirement in Kirkland is 30+ Nights, adopted by 34.1% of listings. This highlights the market's preference for longer commitments.
- A significant segment (34.1%) caters to monthly stays (30+ nights) in Kirkland, pointing to opportunities in the extended-stay market.
Recommendations
- Align with the market by considering a 30+ Nights minimum stay, as 34.1% of Kirkland hosts use this setting.
- If feasible, allowing 1-night stays, especially midweek or during low season, could capture last-minute bookings, as only 13.8% currently do.
- Explore offering discounts for stays of 30+ nights to attract the 34.1% of the market seeking extended stays.
- Adjust minimum nights based on seasonality – potentially shorter during low season and longer during peak demand periods in Kirkland.
Kirkland Airbnb Cancellation Policy Trends Analysis (2026)
Super Strict 60 Days
2 listings
0.7% of total
Limited
10 listings
3.5% of total
Flexible
39 listings
13.5% of total
Moderate
76 listings
26.4% of total
Firm
116 listings
40.3% of total
Strict
45 listings
15.6% of total
Cancellation Policy Insights for Kirkland
- The prevailing Airbnb cancellation policy trend in Kirkland is Firm, used by 40.3% of listings.
- A majority (55.9%) of hosts in Kirkland utilize Firm or Strict policies, indicating a market where hosts prioritize booking security.
Recommendations for Hosts
- Consider adopting a Firm policy to align with the 40.3% market standard in Kirkland.
- Regularly review your cancellation policy against competitors and market demand shifts in Kirkland.
Kirkland STR Booking Lead Time Analysis (2026)
Average Booking Lead Time by Month
Booking Lead Time Insights for Kirkland
- The overall average booking lead time for vacation rentals in Kirkland is 39 days.
- Guests book furthest in advance for stays during July (average 63 days), likely coinciding with peak travel demand or local events.
- The shortest booking windows occur for stays in February (average 20 days), indicating more last-minute travel plans during this time.
- Seasonally, Summer (56 days avg.) sees the longest lead times, while Winter (28 days avg.) has the shortest, reflecting typical travel planning cycles.
Recommendations for Hosts
- Use the overall average lead time (39 days) as a baseline for your pricing and availability strategy in Kirkland.
- For July stays, consider implementing length-of-stay discounts or slightly higher rates for bookings made less than 63 days out to capitalize on advance planning.
- Target marketing efforts for the Summer season well in advance (at least 56 days) to capture early planners.
- Monitor your own booking lead times against these Kirkland averages to identify opportunities for dynamic pricing adjustments.
Popular & Essential Airbnb Amenities in Kirkland (2026)
Amenity Prevalence
Amenity Insights for Kirkland
- Essential amenities in Kirkland that guests expect include: Wifi, Heating, Smoke alarm. Lacking these (any) could significantly impact bookings.
- Popular amenities like TV, Hair dryer, Washer are common but not universal. Offering these can provide a competitive edge.
Recommendations for Hosts
- Ensure your listing includes all essential amenities for Kirkland: Wifi, Heating, Smoke alarm.
- Prioritize adding missing essentials: Heating, Smoke alarm.
- Consider adding popular differentiators like TV or Hair dryer to increase appeal.
- Highlight unique or less common amenities you offer (e.g., hot tub, dedicated workspace, EV charger) in your listing description and photos.
- Regularly check competitor amenities in Kirkland to stay competitive.
Kirkland Airbnb Guest Demographics & Profile Analysis (2026)
Guest Profile Summary for Kirkland
- The typical guest profile for Airbnb in Kirkland consists of primarily domestic travelers (89%), often arriving from nearby Seattle, typically belonging to the Post-2000s (Gen Z/Alpha) group (50%), primarily speaking English or Spanish.
- Domestic travelers account for 89.3% of guests.
- Key international markets include United States (89.3%) and Canada (3.2%).
- Top languages spoken are English (61.7%) followed by Spanish (10.3%).
- A significant demographic segment is the Post-2000s (Gen Z/Alpha) group, representing 50% of guests.
Recommendations for Hosts
- Target domestic marketing efforts towards travelers from Seattle and Kirkland.
- Tailor amenities and listing descriptions to appeal to the dominant Post-2000s (Gen Z/Alpha) demographic (e.g., highlight fast WiFi, smart home features, local guides).
- Highlight unique local experiences or amenities relevant to the primary guest profile.
- Consider seasonal promotions aligned with peak travel times for key origin markets.
Nearby Short-Term Rental Market Comparison
How does the Kirkland Airbnb market stack up against its neighbors? Compare key performance metrics like average monthly revenue, ADR, and occupancy rates in surrounding areas to understand the broader regional STR landscape.
| Market | Active Properties | Monthly Revenue | Daily Rate | Avg. Occupancy |
|---|---|---|---|---|
| Erlands Point-Kitsap Lake | 12 | $5,285 | $366.41 | 47% |
| North Bend | 51 | $5,073 | $352.89 | 57% |
| Olalla | 13 | $4,868 | $334.79 | 49% |
| Sudden Valley | 63 | $4,821 | $324.44 | 51% |
| Warm Beach | 10 | $4,811 | $319.50 | 43% |
| Verlot | 11 | $4,608 | $314.03 | 49% |
| Canyon Creek | 13 | $4,568 | $301.22 | 51% |
| Ronald | 153 | $4,567 | $456.22 | 35% |
| Sultan | 17 | $4,436 | $300.44 | 51% |
| Woodinville | 35 | $4,409 | $340.44 | 51% |