Glacier Airbnb Market Analysis 2026: Short Term Rental Data & Vacation Rental Statistics in Washington, United States
Is Airbnb profitable in Glacier in 2026? Explore comprehensive Airbnb analytics for Glacier, Washington, United States to uncover income potential. This 2026 STR market report for Glacier, based on AirROI data from February 2025 to January 2026, reveals key trends in the niche market of 109 active listings.
Whether you're considering an Airbnb investment in Glacier, optimizing your existing vacation rental, or exploring rental arbitrage opportunities, understanding the Glacier Airbnb data is crucial. Leveraging the low regulation environment is key to maximizing your short term rental income potential. Let's dive into the specifics.
Key Glacier Airbnb Performance Metrics Overview
Monthly Airbnb Revenue Variations & Income Potential in Glacier (2026)
Understanding the monthly revenue variations for Airbnb listings in Glacier is key to maximizing your short term rental income potential. Seasonality significantly impacts earnings. Our analysis, based on data from the past 12 months, shows that the peak revenue month for STRs in Glacier is typically August, while November often presents the lowest earnings, highlighting opportunities for strategic pricing adjustments during shoulder and low seasons. Explore the typical Airbnb income in Glacier across different performance tiers:
- Best-in-class properties (Top 10%) achieve $6,922+ monthly, often utilizing dynamic pricing and superior guest experiences.
- Strong performing properties (Top 25%) earn $4,344 or more, indicating effective management and desirable locations/amenities.
- Typical properties (Median) generate around $2,497 per month, representing the average market performance.
- Entry-level properties (Bottom 25%) see earnings around $1,295, often with potential for optimization.
Average Monthly Airbnb Earnings Trend in Glacier
Glacier Airbnb Occupancy Rate Trends (2026)
Maximize your bookings by understanding the Glacier STR occupancy trends. Seasonal demand shifts significantly influence how often properties are booked. Typically, Februarysees the highest demand (peak season occupancy), while June experiences the lowest (low season). Effective strategies, like adjusting minimum stays or offering promotions, can boost occupancy during slower periods. Here's how different property tiers perform in Glacier:
- Best-in-class properties (Top 10%) achieve 60%+ occupancy, indicating high desirability and potentially optimized availability.
- Strong performing properties (Top 25%) maintain 41% or higher occupancy, suggesting good market fit and guest satisfaction.
- Typical properties (Median) have an occupancy rate around 25%.
- Entry-level properties (Bottom 25%) average 14% occupancy, potentially facing higher vacancy.
Average Monthly Occupancy Rate Trend in Glacier
Average Daily Rate (ADR) Airbnb Trends in Glacier (2026)
Effective short term rental pricing strategy in Glacier involves understanding monthly ADR fluctuations. The Average Daily Rate (ADR) for Airbnb in Glacier typically peaks in December and dips lowest during April. Leveraging Airbnb dynamic pricing tools or strategies based on this seasonality can significantly boost revenue. Here's a look at the typical nightly rates achieved:
- Best-in-class properties (Top 10%) command rates of $514+ per night, often due to premium features or locations.
- Strong performing properties (Top 25%) achieve nightly rates of $405 or more.
- Typical properties (Median) charge around $328 per night.
- Entry-level properties (Bottom 25%) earn around $256 per night.
Average Daily Rate (ADR) Trend by Month in Glacier
Get Live Glacier Market Intelligence 👇

Explore Real-time Analytics
Airbnb Seasonality Analysis & Trends in Glacier (2026)
Peak Season (August, February, July)
- Revenue averages $4,265 per month
- Occupancy rates average 39.0%
- Daily rates average $351
Shoulder Season
- Revenue averages $3,336 per month
- Occupancy maintains around 28.2%
- Daily rates hold near $370
Low Season (April, June, November)
- Revenue drops to average $2,571 per month
- Occupancy decreases to average 23.2%
- Daily rates adjust to average $346
Seasonality Insights for Glacier
- The Airbnb seasonality in Glacier shows moderate seasonality with distinct peak and low periods. While the sections above show seasonal averages, it's also insightful to look at the extremes:
- During the high season, the absolute peak month showcases Glacier's highest earning potential, with monthly revenues capable of climbing to $4,481, occupancy reaching a high of 40.4%, and ADRs peaking at $435.
- Conversely, the slowest single month of the year, typically falling within the low season, marks the market's lowest point. In this month, revenue might dip to $2,549, occupancy could drop to 21.9%, and ADRs may adjust down to $323.
- Understanding both the seasonal averages and these monthly peaks and troughs in revenue, occupancy, and ADR is crucial for maximizing your Airbnb profit potential in Glacier.
Seasonal Strategies for Maximizing Profit
- Peak Season: Maximize revenue through premium pricing and potentially longer minimum stays. Ensure high availability.
- Low Season: Offer competitive pricing, special promotions (e.g., extended stay discounts), and flexible cancellation policies. Target off-season travelers like remote workers or budget-conscious guests.
- Shoulder Seasons: Implement dynamic pricing that balances peak and low rates. Target weekend travelers or specific events. Offer slightly more flexible terms than peak season.
- Regularly analyze your own performance against these Glacier seasonality benchmarks and adjust your pricing and availability strategy accordingly.
Best Areas for Airbnb Investment in Glacier (2026)
Exploring the top neighborhoods for short-term rentals in Glacier? This section highlights key areas, outlining why they are attractive for hosts and guests, along with notable local attractions. Consider these locations based on your target guest profile and investment strategy.
| Neighborhood / Area | Why Host Here? (Target Guests & Appeal) | Key Attractions & Landmarks |
|---|---|---|
| East Glacier Park | Closest access point to Glacier National Park, making it ideal for nature lovers and tourists. Visitors flock to this area for hiking, wildlife viewing, and the stunning scenery of the park. | Glacier National Park (East Entrance), Two Medicine Lake, Running Eagle Falls, St. Mary Lake, Wild Goose Island Lookout |
| West Glacier | Directly adjacent to the western entrance of Glacier National Park, this area offers outdoor adventures and beautiful landscapes, perfect for tourists planning to explore the park. | Glacier National Park (West Entrance), Lake McDonald, Apikuni Falls, Avalanche Lake, Trail of the Cedars |
| Whitefish | Charming town known for skiing and outdoor activities, great year-round destination attracting both winter sports enthusiasts and summer visitors enjoying the lakes and hiking trails. | Whitefish Mountain Resort, Whitefish Lake, City Beach, Downtown Whitefish, Whitefish Trail |
| Columbia Falls | The gateway to Glacier National Park and close to numerous recreational opportunities, including fishing and hiking. It appeals to both families and adventure seekers. | Glacier Raft Company, Meadow Lake Resort, Big Sky Waterpark, Glacier National Park, Flathead River |
| Flathead Lake | Beautiful natural lake that offers summer activities such as boating and fishing. Appeals to families and groups looking for a peaceful retreat near the Glacier region. | Flathead Lake State Park, Blue Bay, Wild Horse Island, Polson, Bigfork |
| Kalispell | The largest city in the Flathead Valley, providing urban amenities while being close to nature. Attracts visitors who want comfort and access to outdoor activities. | Hockaday Museum of Art, Flathead Valley Community College, Kalispell Center Mall, Nearby hiking and lakes |
| Polson | Located on the southern end of Flathead Lake, it offers beautiful lakeside views and attractions. A popular destination for those relaxing by the water. | Flathead Lake, Confederated Salish and Kootenai Tribes Museum, Polson Bay Golf Club, Sacajawea Park |
| Swan Lake | Quieter area surrounded by natural beauty, ideal for those looking for a serene getaway. Great for fishing, hiking, and enjoying the outdoors. | Swan Lake, Swan River, Bob Marshall Wilderness Area, Hiking Trails, Fishing Spots |
Understanding Airbnb License Requirements & STR Laws in Glacier (2026)
While Glacier, Washington, United States currently shows low STR regulations, specific Airbnb license requirements might still exist or change. Always verify the latest short term rental regulations and Airbnb license requirements directly with local government authorities for Glacier to ensure full compliance before hosting.
(Source: AirROI data, 2026, finding no licensed listings among those analyzed)
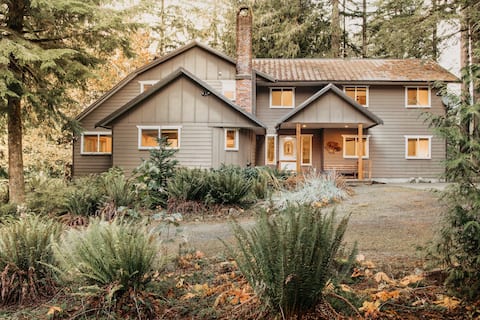
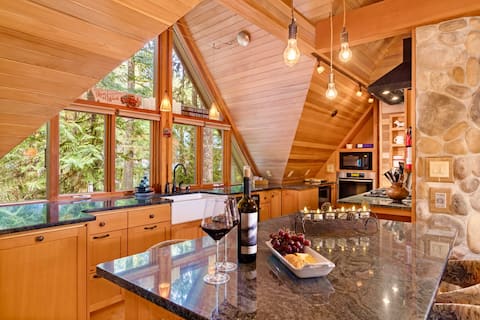
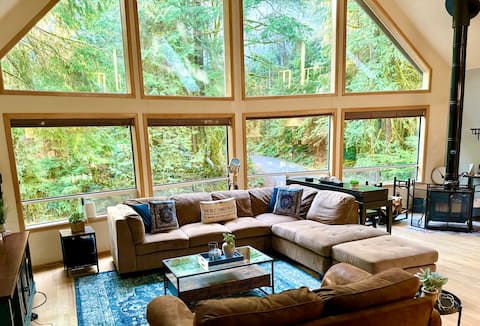
Top Performing Airbnb Properties in Glacier (2026)
Benchmark your potential! Explore examples of top-performing Airbnb properties in Glacierbased on Trailing Twelve Month (TTM) revenue. Analyze their characteristics, revenue, occupancy rate, and ADR to understand what drives success in this market.
The Glacier Lodge - Perfect for Large Groups!
Entire Place • 12 bedrooms

RARE FIND -Sleeps 12, Foothill Views, Fenced Yard
Entire Place • 5 bedrooms
Architecturally Stunning/ Unique/ Private Sauna
Entire Place • 3 bedrooms

Stunning Forest View Chalet, 3 KING Beds, 3 Baths
Entire Place • 3 bedrooms
RARE~2 Master Suites~3 1/2 Bath, Chefs Kitchen
Entire Place • 4 bedrooms

Mt. Baker Lodge hot tub & sauna, creek sleeps 16+
Entire Place • 6 bedrooms
Note: Performance varies based on location, size, amenities, seasonality, and management quality. Data reflects the past 12 months.
Top Performing Airbnb Hosts in Glacier (2026)
Learn from the best! This table showcases top-performing Airbnb hosts in Glacier based on the number of properties managed and estimated total revenue over the past year. Analyze their scale and performance metrics.
| Host Name | Properties | Grossing Revenue | Stay Reviews | Avg Rating |
|---|---|---|---|---|
| Mt. Baker Lodging | 47 | $1,013,027 | 2630 | 4.58/5.0 |
| Rheannon | 10 | $656,952 | 555 | 4.97/5.0 |
| Luxury Getaways | 12 | $398,896 | 771 | 4.81/5.0 |
| RedAwning | 19 | $166,171 | 28 | 5.00/5.0 |
| Cecelia | 3 | $156,982 | 1281 | 4.85/5.0 |
| Eric | 1 | $66,553 | 130 | 4.94/5.0 |
| Campbell | 1 | $46,791 | 305 | 4.90/5.0 |
| Phil | 1 | $46,038 | 254 | 4.95/5.0 |
| Ken | 1 | $43,371 | 743 | 4.94/5.0 |
| Kathryn | 1 | $38,706 | 71 | 4.76/5.0 |
Analyzing the strategies of top hosts, such as their property selection, pricing, and guest communication, can offer valuable lessons for optimizing your own Airbnb operations in Glacier.
Dive Deeper: Advanced Glacier STR Market Data (2026)
Ready to unlock more insights? AirROI provides access to advanced metrics and comprehensive Airbnb data for Glacier. Explore detailed analytics beyond this report to refine your investment strategy, optimize pricing, and maximize your vacation rental profits.
Explore Advanced MetricsGlacier Short-Term Rental Market Composition (2026): Property & Room Types
Room Type Distribution
Property Type Distribution
Market Composition Insights for Glacier
- The Glacier Airbnb market composition is heavily skewed towards Entire Home/Apt listings, which make up 100% of the 109 active rentals. This indicates strong guest preference for privacy and space.
- Looking at the property type distribution in Glacier, Outdoor/Unique properties are the most common (52.3%), reflecting the local real estate landscape.
- Houses represent a significant 22.9% portion, catering likely to families or larger groups.
- Smaller segments like unique stays (combined 0.9%) offer potential for unique stay experiences.
Glacier Airbnb Room Capacity Analysis (2026): Bedroom Distribution
Distribution of Listings by Number of Bedrooms
Room Capacity Insights for Glacier
- The dominant room capacity in Glacier is 3 bedrooms listings, making up 40.4% of the market. This suggests a strong demand for properties suitable for families or small groups.
- Together, 3 bedrooms and 2 bedrooms properties represent 67.0% of the active Airbnb listings in Glacier, indicating a high concentration in these sizes.
- A significant 53.2% of listings offer 3+ bedrooms, catering to larger groups and families seeking more space in Glacier.
Glacier Vacation Rental Guest Capacity Trends (2026)
Distribution of Listings by Guest Capacity
Guest Capacity Insights for Glacier
- The most common guest capacity trend in Glacier vacation rentals is listings accommodating 8+ guests (39.4%). This suggests the primary traveler segment is likely larger groups.
- Properties designed for 8+ guests and 6 guests dominate the Glacier STR market, accounting for 68.8% of listings.
- 73.4% of properties accommodate 6+ guests, serving the market segment for larger families or group travel in Glacier.
- On average, properties in Glacier are equipped to host 6.2 guests.
Glacier Airbnb Booking Patterns (2026): Available vs. Booked Days
Available Days Distribution
Booked Days Distribution
Booking Pattern Insights for Glacier
- The most common availability pattern in Glacier falls within the 271-366 days range, representing 71.6% of listings. This suggests many properties have significant open periods on their calendars.
- Approximately 92.7% of listings show high availability (181+ days open annually), indicating potential for increased bookings or specific owner usage patterns.
- For booked days, the 31-90 days range is most frequent in Glacier (35.8%), reflecting common guest stay durations or potential owner blocking patterns.
- A notable 8.3% of properties secure long booking periods (181+ days booked per year), highlighting successful long-term rental strategies or significant owner usage.
Glacier Airbnb Minimum Stay Requirements Analysis
Distribution of Listings by Minimum Night Requirement
1 Night
3 listings
2.8% of total
2 Nights
77 listings
70.6% of total
3 Nights
4 listings
3.7% of total
4-6 Nights
1 listings
0.9% of total
30+ Nights
24 listings
22% of total
Key Insights
- The most prevalent minimum stay requirement in Glacier is 2 Nights, adopted by 70.6% of listings. This highlights the market's preference for shorter, flexible bookings.
- A strong majority (73.4%) of the Glacier Airbnb data shows acceptance of very short stays (1-2 nights), indicating a dynamic, high-turnover market.
- A significant segment (22%) caters to monthly stays (30+ nights) in Glacier, pointing to opportunities in the extended-stay market.
Recommendations
- Align with the market by considering a 2 Nights minimum stay, as 70.6% of Glacier hosts use this setting.
- If feasible, allowing 1-night stays, especially midweek or during low season, could capture last-minute bookings, as only 2.8% currently do.
- A 2-night minimum appears standard (70.6%). Consider this for weekends or peak periods.
- Explore offering discounts for stays of 30+ nights to attract the 22% of the market seeking extended stays.
- Adjust minimum nights based on seasonality – potentially shorter during low season and longer during peak demand periods in Glacier.
Glacier Airbnb Cancellation Policy Trends Analysis (2026)
Super Strict 60 Days
19 listings
17.4% of total
Super Strict 30 Days
46 listings
42.2% of total
Flexible
1 listings
0.9% of total
Moderate
8 listings
7.3% of total
Firm
30 listings
27.5% of total
Strict
5 listings
4.6% of total
Cancellation Policy Insights for Glacier
- The prevailing Airbnb cancellation policy trend in Glacier is Super Strict 30 Days, used by 42.2% of listings.
- There's a relatively balanced mix between guest-friendly (8.2%) and stricter (32.1%) policies, offering choices for different guest needs.
- Strict cancellation policies are quite rare (4.6%), potentially making listings with this policy less competitive unless justified by high demand or property type.
Recommendations for Hosts
- Consider adopting a Super Strict 30 Days policy to align with the 42.2% market standard in Glacier.
- Using a Strict policy might deter some guests, as only 4.6% of listings use it. Evaluate if potential revenue protection outweighs possible lower booking rates.
- Regularly review your cancellation policy against competitors and market demand shifts in Glacier.
Glacier STR Booking Lead Time Analysis (2026)
Average Booking Lead Time by Month
Booking Lead Time Insights for Glacier
- The overall average booking lead time for vacation rentals in Glacier is 63 days.
- Guests book furthest in advance for stays during February (average 88 days), likely coinciding with peak travel demand or local events.
- The shortest booking windows occur for stays in November (average 35 days), indicating more last-minute travel plans during this time.
- Seasonally, Fall (64 days avg.) sees the longest lead times, while Spring (53 days avg.) has the shortest, reflecting typical travel planning cycles.
Recommendations for Hosts
- Use the overall average lead time (63 days) as a baseline for your pricing and availability strategy in Glacier.
- For February stays, consider implementing length-of-stay discounts or slightly higher rates for bookings made less than 88 days out to capitalize on advance planning.
- Target marketing efforts for the Fall season well in advance (at least 64 days) to capture early planners.
- Monitor your own booking lead times against these Glacier averages to identify opportunities for dynamic pricing adjustments.
Popular & Essential Airbnb Amenities in Glacier (2026)
Amenity Prevalence
Amenity Insights for Glacier
- Essential amenities in Glacier that guests expect include: Smoke alarm, Dishes and silverware, Refrigerator, Coffee maker, Carbon monoxide alarm, Heating, Free parking on premises, Microwave, Kitchen, Dryer. Lacking these (any) could significantly impact bookings.
Recommendations for Hosts
- Ensure your listing includes all essential amenities for Glacier: Smoke alarm, Dishes and silverware, Refrigerator, Coffee maker, Carbon monoxide alarm, Heating, Free parking on premises, Microwave, Kitchen, Dryer.
- Prioritize adding missing essentials: Coffee maker, Carbon monoxide alarm, Heating, Free parking on premises, Microwave, Kitchen, Dryer.
- Highlight unique or less common amenities you offer (e.g., hot tub, dedicated workspace, EV charger) in your listing description and photos.
- Regularly check competitor amenities in Glacier to stay competitive.
Glacier Airbnb Guest Demographics & Profile Analysis (2026)
Guest Profile Summary for Glacier
- The typical guest profile for Airbnb in Glacier consists of primarily domestic travelers (89%), often arriving from nearby Seattle, typically belonging to the Post-2000s (Gen Z/Alpha) group (50%), primarily speaking English or Spanish.
- Domestic travelers account for 88.5% of guests.
- Key international markets include United States (88.5%) and Canada (7.7%).
- Top languages spoken are English (66.9%) followed by Spanish (9%).
- A significant demographic segment is the Post-2000s (Gen Z/Alpha) group, representing 50% of guests.
Recommendations for Hosts
- Target domestic marketing efforts towards travelers from Seattle and Vancouver.
- Tailor amenities and listing descriptions to appeal to the dominant Post-2000s (Gen Z/Alpha) demographic (e.g., highlight fast WiFi, smart home features, local guides).
- Highlight unique local experiences or amenities relevant to the primary guest profile.
- Consider seasonal promotions aligned with peak travel times for key origin markets.
Nearby Short-Term Rental Market Comparison
How does the Glacier Airbnb market stack up against its neighbors? Compare key performance metrics like average monthly revenue, ADR, and occupancy rates in surrounding areas to understand the broader regional STR landscape.
| Market | Active Properties | Monthly Revenue | Daily Rate | Avg. Occupancy |
|---|---|---|---|---|
| Orondo | 30 | $5,684 | $469.77 | 45% |
| Erlands Point-Kitsap Lake | 12 | $5,285 | $366.41 | 47% |
| Cle Elum | 419 | $5,281 | $596.34 | 33% |
| Plain | 53 | $5,148 | $449.05 | 42% |
| North Bend | 51 | $5,073 | $352.89 | 57% |
| Peshastin | 33 | $4,951 | $432.44 | 39% |
| Olalla | 13 | $4,868 | $334.79 | 49% |
| Sudden Valley | 63 | $4,821 | $324.44 | 51% |
| Warm Beach | 10 | $4,811 | $319.50 | 43% |
| Verlot | 11 | $4,608 | $314.03 | 49% |