Des Moines Airbnb Market Analysis 2026: Short Term Rental Data & Vacation Rental Statistics in Washington, United States
Is Airbnb profitable in Des Moines in 2026? Explore comprehensive Airbnb analytics for Des Moines, Washington, United States to uncover income potential. This 2026 STR market report for Des Moines, based on AirROI data from February 2025 to January 2026, reveals key trends in the niche market of 75 active listings.
Whether you're considering an Airbnb investment in Des Moines, optimizing your existing vacation rental, or exploring rental arbitrage opportunities, understanding the Des Moines Airbnb data is crucial. Leveraging the low regulation environment is key to maximizing your short term rental income potential. Let's dive into the specifics.
Key Des Moines Airbnb Performance Metrics Overview
Monthly Airbnb Revenue Variations & Income Potential in Des Moines (2026)
Understanding the monthly revenue variations for Airbnb listings in Des Moines is key to maximizing your short term rental income potential. Seasonality significantly impacts earnings. Our analysis, based on data from the past 12 months, shows that the peak revenue month for STRs in Des Moines is typically July, while January often presents the lowest earnings, highlighting opportunities for strategic pricing adjustments during shoulder and low seasons. Explore the typical Airbnb income in Des Moines across different performance tiers:
- Best-in-class properties (Top 10%) achieve $6,676+ monthly, often utilizing dynamic pricing and superior guest experiences.
- Strong performing properties (Top 25%) earn $3,703 or more, indicating effective management and desirable locations/amenities.
- Typical properties (Median) generate around $2,349 per month, representing the average market performance.
- Entry-level properties (Bottom 25%) see earnings around $1,101, often with potential for optimization.
Average Monthly Airbnb Earnings Trend in Des Moines
Des Moines Airbnb Occupancy Rate Trends (2026)
Maximize your bookings by understanding the Des Moines STR occupancy trends. Seasonal demand shifts significantly influence how often properties are booked. Typically, Julysees the highest demand (peak season occupancy), while January experiences the lowest (low season). Effective strategies, like adjusting minimum stays or offering promotions, can boost occupancy during slower periods. Here's how different property tiers perform in Des Moines:
- Best-in-class properties (Top 10%) achieve 82%+ occupancy, indicating high desirability and potentially optimized availability.
- Strong performing properties (Top 25%) maintain 67% or higher occupancy, suggesting good market fit and guest satisfaction.
- Typical properties (Median) have an occupancy rate around 48%.
- Entry-level properties (Bottom 25%) average 26% occupancy, potentially facing higher vacancy.
Average Monthly Occupancy Rate Trend in Des Moines
Average Daily Rate (ADR) Airbnb Trends in Des Moines (2026)
Effective short term rental pricing strategy in Des Moines involves understanding monthly ADR fluctuations. The Average Daily Rate (ADR) for Airbnb in Des Moines typically peaks in December and dips lowest during February. Leveraging Airbnb dynamic pricing tools or strategies based on this seasonality can significantly boost revenue. Here's a look at the typical nightly rates achieved:
- Best-in-class properties (Top 10%) command rates of $413+ per night, often due to premium features or locations.
- Strong performing properties (Top 25%) achieve nightly rates of $247 or more.
- Typical properties (Median) charge around $152 per night.
- Entry-level properties (Bottom 25%) earn around $90 per night.
Average Daily Rate (ADR) Trend by Month in Des Moines
Get Live Des Moines Market Intelligence 👇

Explore Real-time Analytics
Airbnb Seasonality Analysis & Trends in Des Moines (2026)
Peak Season (July, August, June)
- Revenue averages $4,080 per month
- Occupancy rates average 56.4%
- Daily rates average $204
Shoulder Season
- Revenue averages $2,963 per month
- Occupancy maintains around 47.1%
- Daily rates hold near $209
Low Season (January, February, April)
- Revenue drops to average $1,889 per month
- Occupancy decreases to average 36.9%
- Daily rates adjust to average $191
Seasonality Insights for Des Moines
- The Airbnb seasonality in Des Moines shows highly seasonal trends requiring careful strategy. While the sections above show seasonal averages, it's also insightful to look at the extremes:
- During the high season, the absolute peak month showcases Des Moines's highest earning potential, with monthly revenues capable of climbing to $4,576, occupancy reaching a high of 59.9%, and ADRs peaking at $228.
- Conversely, the slowest single month of the year, typically falling within the low season, marks the market's lowest point. In this month, revenue might dip to $1,597, occupancy could drop to 23.9%, and ADRs may adjust down to $174.
- Understanding both the seasonal averages and these monthly peaks and troughs in revenue, occupancy, and ADR is crucial for maximizing your Airbnb profit potential in Des Moines.
Seasonal Strategies for Maximizing Profit
- Peak Season: Maximize revenue through premium pricing and potentially longer minimum stays. Ensure high availability.
- Low Season: Offer competitive pricing, special promotions (e.g., extended stay discounts), and flexible cancellation policies. Target off-season travelers like remote workers or budget-conscious guests.
- Shoulder Seasons: Implement dynamic pricing that balances peak and low rates. Target weekend travelers or specific events. Offer slightly more flexible terms than peak season.
- Regularly analyze your own performance against these Des Moines seasonality benchmarks and adjust your pricing and availability strategy accordingly.
Best Areas for Airbnb Investment in Des Moines (2026)
Exploring the top neighborhoods for short-term rentals in Des Moines? This section highlights key areas, outlining why they are attractive for hosts and guests, along with notable local attractions. Consider these locations based on your target guest profile and investment strategy.
| Neighborhood / Area | Why Host Here? (Target Guests & Appeal) | Key Attractions & Landmarks |
|---|---|---|
| Downtown Des Moines | The heart of the city with a vibrant cultural scene, perfect for business travelers and tourists. Close to major events, restaurants, and nightlife. | Iowa State Capitol, Des Moines Art Center, Science Center of Iowa, Principal Park, Western Gateway Park |
| West Des Moines | A rapidly growing suburb with great shopping and dining options. Attractive to families and visitors looking for a quieter space with easy access to city amenities. | Valley West Mall, Jordan Creek Town Center, West Des Moines Parks, Kerry’s Restaurant, Shopping and dining along University Avenue |
| East Village | A trendy neighborhood known for its shops, restaurants, and arts. Popular among younger crowds and those looking for a vibrant local experience. | The Des Moines Social Club, East Village shops, State Historical Museum of Iowa, Local breweries and cafes, City parks |
| Merle Hay | A key area for diverse dining and retail offerings. Close to family-friendly attractions and a popular choice for visitors. | Merle Hay Mall, Adventureland Park, Local restaurants, Cinemark movie theater, Playgrounds and family parks |
| Northwest Des Moines | Home to parks and recreational areas, this location attracts tourists interested in outdoor activities and family-friendly attractions. | Saylorville Lake, Jester Park, Various hiking trails, Local farms and markets, Boating and fishing spots |
| South Des Moines | Less crowded and more residential, this area is appealing for those seeking a quiet getaway without straying far from city life. | Gray’s Lake Park, Des Moines Waterworks Park, Lake Activities, Local parks, Community centers |
| South Renton | Just a short drive from Des Moines, this area is attractive for its residential feel and proximity to Seattle attractions, appealing to travelers seeking a peaceful stay. | Shopping centers, Parks and nature preserves, Dining options along Sunset Blvd, Cultural attractions, Easy access to public transportation |
| Ankeny | Suburban area to the north with strong community vibes, appealing to those looking for affordable stays with access to Des Moines attractions. | Ankeny Parks, Local restaurants, Saylorville Lake, Adventureland, Shopping suppliers and services |
Understanding Airbnb License Requirements & STR Laws in Des Moines (2026)
While Des Moines, Washington, United States currently shows low STR regulations, specific Airbnb license requirements might still exist or change. Always verify the latest short term rental regulations and Airbnb license requirements directly with local government authorities for Des Moines to ensure full compliance before hosting.
(Source: AirROI data, 2026, based on 1% licensed listings)
Top Performing Airbnb Properties in Des Moines (2026)
Benchmark your potential! Explore examples of top-performing Airbnb properties in Des Moinesbased on Trailing Twelve Month (TTM) revenue. Analyze their characteristics, revenue, occupancy rate, and ADR to understand what drives success in this market.

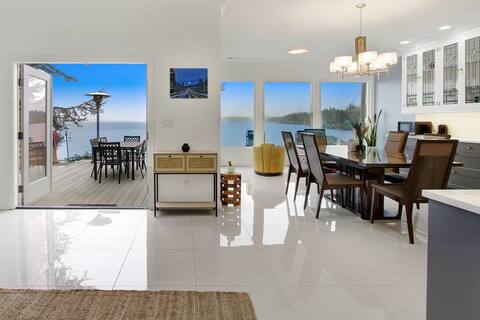
Redondo Beachfront Boardwalk Home
Entire Place • 7 bedrooms
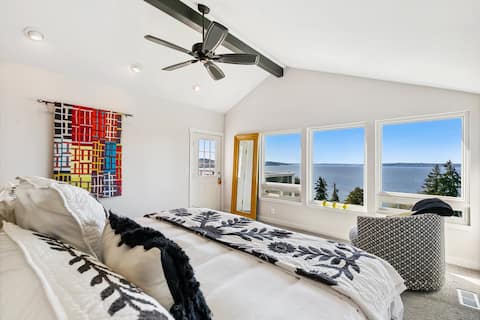
Beautiful Redondo Home w/Puget Sound+Mountain View
Entire Place • 4 bedrooms

Sound View House, breathtaking water view, hot tub
Entire Place • 3 bedrooms

South of Seattle home with great Puget Sound views
Entire Place • 4 bedrooms
Sunset Paradise in Woodmont Beach!
Entire Place • 4 bedrooms

Modern Home w/ Water Views, Hot Tub & Pet-Friendly
Entire Place • 2 bedrooms
Note: Performance varies based on location, size, amenities, seasonality, and management quality. Data reflects the past 12 months.
Top Performing Airbnb Hosts in Des Moines (2026)
Learn from the best! This table showcases top-performing Airbnb hosts in Des Moines based on the number of properties managed and estimated total revenue over the past year. Analyze their scale and performance metrics.
| Host Name | Properties | Grossing Revenue | Stay Reviews | Avg Rating |
|---|---|---|---|---|
| Dave | 1 | $134,151 | 403 | 4.94/5.0 |
| Aaron | 4 | $117,648 | 333 | 4.88/5.0 |
| Global Getaways | 1 | $97,791 | 86 | 4.98/5.0 |
| Stephanie And Anthony | 1 | $84,332 | 125 | 4.95/5.0 |
| The Turtle House | 2 | $82,294 | 17 | 4.83/5.0 |
| Paulina | 1 | $72,333 | 36 | 4.97/5.0 |
| Sarah | 1 | $66,285 | 46 | 4.98/5.0 |
| Veronica And Angel | 1 | $65,635 | 72 | 4.97/5.0 |
| Sophari | 2 | $57,890 | 90 | 4.88/5.0 |
| Thuy | 3 | $56,428 | 120 | 4.95/5.0 |
Analyzing the strategies of top hosts, such as their property selection, pricing, and guest communication, can offer valuable lessons for optimizing your own Airbnb operations in Des Moines.
Dive Deeper: Advanced Des Moines STR Market Data (2026)
Ready to unlock more insights? AirROI provides access to advanced metrics and comprehensive Airbnb data for Des Moines. Explore detailed analytics beyond this report to refine your investment strategy, optimize pricing, and maximize your vacation rental profits.
Explore Advanced MetricsDes Moines Short-Term Rental Market Composition (2026): Property & Room Types
Room Type Distribution
Property Type Distribution
Market Composition Insights for Des Moines
- The Des Moines Airbnb market composition is heavily skewed towards Entire Home/Apt listings, which make up 70.7% of the 75 active rentals. This indicates strong guest preference for privacy and space.
- Looking at the property type distribution in Des Moines, House properties are the most common (78.7%), reflecting the local real estate landscape.
- Houses represent a significant 78.7% portion, catering likely to families or larger groups.
- Smaller segments like hotel/boutique (combined 2.7%) offer potential for unique stay experiences.
Des Moines Airbnb Room Capacity Analysis (2026): Bedroom Distribution
Distribution of Listings by Number of Bedrooms
Room Capacity Insights for Des Moines
- The dominant room capacity in Des Moines is 1 bedroom listings, making up 22.7% of the market. This suggests a strong demand for properties suitable for couples or solo travelers.
- Together, 1 bedroom and 3 bedrooms properties represent 41.4% of the active Airbnb listings in Des Moines, indicating a high concentration in these sizes.
- A significant 34.7% of listings offer 3+ bedrooms, catering to larger groups and families seeking more space in Des Moines.
Des Moines Vacation Rental Guest Capacity Trends (2026)
Distribution of Listings by Guest Capacity
Guest Capacity Insights for Des Moines
- The most common guest capacity trend in Des Moines vacation rentals is listings accommodating 8+ guests (20%). This suggests the primary traveler segment is likely larger groups.
- Properties designed for 8+ guests and 2 guests dominate the Des Moines STR market, accounting for 38.7% of listings.
- 36.0% of properties accommodate 6+ guests, serving the market segment for larger families or group travel in Des Moines.
- On average, properties in Des Moines are equipped to host 3.6 guests.
Des Moines Airbnb Booking Patterns (2026): Available vs. Booked Days
Available Days Distribution
Booked Days Distribution
Booking Pattern Insights for Des Moines
- The most common availability pattern in Des Moines falls within the 271-366 days range, representing 48% of listings. This suggests many properties have significant open periods on their calendars.
- Approximately 69.3% of listings show high availability (181+ days open annually), indicating potential for increased bookings or specific owner usage patterns.
- For booked days, the 31-90 days range is most frequent in Des Moines (33.3%), reflecting common guest stay durations or potential owner blocking patterns.
- A notable 34.6% of properties secure long booking periods (181+ days booked per year), highlighting successful long-term rental strategies or significant owner usage.
Des Moines Airbnb Minimum Stay Requirements Analysis
Distribution of Listings by Minimum Night Requirement
1 Night
24 listings
32% of total
2 Nights
24 listings
32% of total
3 Nights
3 listings
4% of total
4-6 Nights
2 listings
2.7% of total
7-29 Nights
8 listings
10.7% of total
30+ Nights
14 listings
18.7% of total
Key Insights
- The most prevalent minimum stay requirement in Des Moines is 1 Night, adopted by 32% of listings. This highlights the market's preference for shorter, flexible bookings.
- A strong majority (64.0%) of the Des Moines Airbnb data shows acceptance of very short stays (1-2 nights), indicating a dynamic, high-turnover market.
- A significant segment (18.7%) caters to monthly stays (30+ nights) in Des Moines, pointing to opportunities in the extended-stay market.
Recommendations
- Align with the market by considering a 1 Night minimum stay, as 32% of Des Moines hosts use this setting.
- Explore offering discounts for stays of 30+ nights to attract the 18.7% of the market seeking extended stays.
- Adjust minimum nights based on seasonality – potentially shorter during low season and longer during peak demand periods in Des Moines.
Des Moines Airbnb Cancellation Policy Trends Analysis (2026)
Limited
1 listings
1.4% of total
Super Strict 30 Days
1 listings
1.4% of total
Flexible
13 listings
17.6% of total
Moderate
19 listings
25.7% of total
Firm
28 listings
37.8% of total
Strict
12 listings
16.2% of total
Cancellation Policy Insights for Des Moines
- The prevailing Airbnb cancellation policy trend in Des Moines is Firm, used by 37.8% of listings.
- A majority (54.0%) of hosts in Des Moines utilize Firm or Strict policies, indicating a market where hosts prioritize booking security.
Recommendations for Hosts
- Consider adopting a Firm policy to align with the 37.8% market standard in Des Moines.
- Regularly review your cancellation policy against competitors and market demand shifts in Des Moines.
Des Moines STR Booking Lead Time Analysis (2026)
Average Booking Lead Time by Month
Booking Lead Time Insights for Des Moines
- The overall average booking lead time for vacation rentals in Des Moines is 39 days.
- Guests book furthest in advance for stays during June (average 59 days), likely coinciding with peak travel demand or local events.
- The shortest booking windows occur for stays in February (average 24 days), indicating more last-minute travel plans during this time.
- Seasonally, Summer (53 days avg.) sees the longest lead times, while Winter (29 days avg.) has the shortest, reflecting typical travel planning cycles.
Recommendations for Hosts
- Use the overall average lead time (39 days) as a baseline for your pricing and availability strategy in Des Moines.
- For June stays, consider implementing length-of-stay discounts or slightly higher rates for bookings made less than 59 days out to capitalize on advance planning.
- Target marketing efforts for the Summer season well in advance (at least 53 days) to capture early planners.
- Monitor your own booking lead times against these Des Moines averages to identify opportunities for dynamic pricing adjustments.
Popular & Essential Airbnb Amenities in Des Moines (2026)
Amenity Prevalence
Amenity Insights for Des Moines
- Essential amenities in Des Moines that guests expect include: Wifi, Smoke alarm, Free parking on premises, Carbon monoxide alarm, Hot water. Lacking these (any) could significantly impact bookings.
- Popular amenities like Heating, TV, Microwave are common but not universal. Offering these can provide a competitive edge.
Recommendations for Hosts
- Ensure your listing includes all essential amenities for Des Moines: Wifi, Smoke alarm, Free parking on premises, Carbon monoxide alarm, Hot water.
- Prioritize adding missing essentials: Smoke alarm, Free parking on premises, Carbon monoxide alarm, Hot water.
- Consider adding popular differentiators like Heating or TV to increase appeal.
- Highlight unique or less common amenities you offer (e.g., hot tub, dedicated workspace, EV charger) in your listing description and photos.
- Regularly check competitor amenities in Des Moines to stay competitive.
Des Moines Airbnb Guest Demographics & Profile Analysis (2026)
Guest Profile Summary for Des Moines
- The typical guest profile for Airbnb in Des Moines consists of primarily domestic travelers (95%), often arriving from nearby Seattle, typically belonging to the Post-2000s (Gen Z/Alpha) group (50%), primarily speaking English or Spanish.
- Domestic travelers account for 94.9% of guests.
- Key international markets include United States (94.9%) and Canada (2.2%).
- Top languages spoken are English (68.9%) followed by Spanish (17.8%).
- A significant demographic segment is the Post-2000s (Gen Z/Alpha) group, representing 50% of guests.
Recommendations for Hosts
- Target domestic marketing efforts towards travelers from Seattle and New York.
- Tailor amenities and listing descriptions to appeal to the dominant Post-2000s (Gen Z/Alpha) demographic (e.g., highlight fast WiFi, smart home features, local guides).
- Highlight unique local experiences or amenities relevant to the primary guest profile.
- Consider seasonal promotions aligned with peak travel times for key origin markets.
Nearby Short-Term Rental Market Comparison
How does the Des Moines Airbnb market stack up against its neighbors? Compare key performance metrics like average monthly revenue, ADR, and occupancy rates in surrounding areas to understand the broader regional STR landscape.
| Market | Active Properties | Monthly Revenue | Daily Rate | Avg. Occupancy |
|---|---|---|---|---|
| Erlands Point-Kitsap Lake | 12 | $5,285 | $366.41 | 47% |
| North Bend | 51 | $5,073 | $352.89 | 57% |
| Olalla | 13 | $4,868 | $334.79 | 49% |
| Sudden Valley | 63 | $4,821 | $324.44 | 51% |
| Warm Beach | 10 | $4,811 | $319.50 | 43% |
| Verlot | 11 | $4,608 | $314.03 | 49% |
| Canyon Creek | 13 | $4,568 | $301.22 | 51% |
| Ronald | 153 | $4,567 | $456.22 | 35% |
| Sultan | 17 | $4,436 | $300.44 | 51% |
| Woodinville | 35 | $4,409 | $340.44 | 51% |