Deming Airbnb Market Analysis 2026: Short Term Rental Data & Vacation Rental Statistics in Washington, United States
Is Airbnb profitable in Deming in 2026? Explore comprehensive Airbnb analytics for Deming, Washington, United States to uncover income potential. This 2026 STR market report for Deming, based on AirROI data from February 2025 to January 2026, reveals key trends in the market of 224 active listings.
Whether you're considering an Airbnb investment in Deming, optimizing your existing vacation rental, or exploring rental arbitrage opportunities, understanding the Deming Airbnb data is crucial. Leveraging the low regulation environment is key to maximizing your short term rental income potential. Let's dive into the specifics.
Key Deming Airbnb Performance Metrics Overview
Monthly Airbnb Revenue Variations & Income Potential in Deming (2026)
Understanding the monthly revenue variations for Airbnb listings in Deming is key to maximizing your short term rental income potential. Seasonality significantly impacts earnings. Our analysis, based on data from the past 12 months, shows that the peak revenue month for STRs in Deming is typically August, while April often presents the lowest earnings, highlighting opportunities for strategic pricing adjustments during shoulder and low seasons. Explore the typical Airbnb income in Deming across different performance tiers:
- Best-in-class properties (Top 10%) achieve $6,582+ monthly, often utilizing dynamic pricing and superior guest experiences.
- Strong performing properties (Top 25%) earn $4,528 or more, indicating effective management and desirable locations/amenities.
- Typical properties (Median) generate around $2,681 per month, representing the average market performance.
- Entry-level properties (Bottom 25%) see earnings around $1,467, often with potential for optimization.
Average Monthly Airbnb Earnings Trend in Deming
Deming Airbnb Occupancy Rate Trends (2026)
Maximize your bookings by understanding the Deming STR occupancy trends. Seasonal demand shifts significantly influence how often properties are booked. Typically, Augustsees the highest demand (peak season occupancy), while May experiences the lowest (low season). Effective strategies, like adjusting minimum stays or offering promotions, can boost occupancy during slower periods. Here's how different property tiers perform in Deming:
- Best-in-class properties (Top 10%) achieve 72%+ occupancy, indicating high desirability and potentially optimized availability.
- Strong performing properties (Top 25%) maintain 55% or higher occupancy, suggesting good market fit and guest satisfaction.
- Typical properties (Median) have an occupancy rate around 35%.
- Entry-level properties (Bottom 25%) average 19% occupancy, potentially facing higher vacancy.
Average Monthly Occupancy Rate Trend in Deming
Average Daily Rate (ADR) Airbnb Trends in Deming (2026)
Effective short term rental pricing strategy in Deming involves understanding monthly ADR fluctuations. The Average Daily Rate (ADR) for Airbnb in Deming typically peaks in December and dips lowest during April. Leveraging Airbnb dynamic pricing tools or strategies based on this seasonality can significantly boost revenue. Here's a look at the typical nightly rates achieved:
- Best-in-class properties (Top 10%) command rates of $463+ per night, often due to premium features or locations.
- Strong performing properties (Top 25%) achieve nightly rates of $357 or more.
- Typical properties (Median) charge around $258 per night.
- Entry-level properties (Bottom 25%) earn around $192 per night.
Average Daily Rate (ADR) Trend by Month in Deming
Get Live Deming Market Intelligence 👇

Explore Real-time Analytics
Airbnb Seasonality Analysis & Trends in Deming (2026)
Peak Season (August, July, February)
- Revenue averages $4,534 per month
- Occupancy rates average 51.6%
- Daily rates average $287
Shoulder Season
- Revenue averages $3,261 per month
- Occupancy maintains around 36.3%
- Daily rates hold near $293
Low Season (April, May, November)
- Revenue drops to average $2,395 per month
- Occupancy decreases to average 29.8%
- Daily rates adjust to average $269
Seasonality Insights for Deming
- The Airbnb seasonality in Deming shows highly seasonal trends requiring careful strategy. While the sections above show seasonal averages, it's also insightful to look at the extremes:
- During the high season, the absolute peak month showcases Deming's highest earning potential, with monthly revenues capable of climbing to $4,792, occupancy reaching a high of 54.4%, and ADRs peaking at $329.
- Conversely, the slowest single month of the year, typically falling within the low season, marks the market's lowest point. In this month, revenue might dip to $2,292, occupancy could drop to 29.6%, and ADRs may adjust down to $255.
- Understanding both the seasonal averages and these monthly peaks and troughs in revenue, occupancy, and ADR is crucial for maximizing your Airbnb profit potential in Deming.
Seasonal Strategies for Maximizing Profit
- Peak Season: Maximize revenue through premium pricing and potentially longer minimum stays. Ensure high availability.
- Low Season: Offer competitive pricing, special promotions (e.g., extended stay discounts), and flexible cancellation policies. Target off-season travelers like remote workers or budget-conscious guests.
- Shoulder Seasons: Implement dynamic pricing that balances peak and low rates. Target weekend travelers or specific events. Offer slightly more flexible terms than peak season.
- Regularly analyze your own performance against these Deming seasonality benchmarks and adjust your pricing and availability strategy accordingly.
Best Areas for Airbnb Investment in Deming (2026)
Exploring the top neighborhoods for short-term rentals in Deming? This section highlights key areas, outlining why they are attractive for hosts and guests, along with notable local attractions. Consider these locations based on your target guest profile and investment strategy.
| Neighborhood / Area | Why Host Here? (Target Guests & Appeal) | Key Attractions & Landmarks |
|---|---|---|
| Downtown Deming | Central hub of the city with easy access to local shops, restaurants, and community events. Ideal for guests looking to experience the local culture and amenities. | Deming Library, Deming Historical Museum, Local dining options, Community parks, Festivals and events |
| La Paloma | A quiet residential area with scenic views and proximity to outdoor activities. Perfect for families and nature lovers seeking a peaceful getaway. | Riverside Park, Outdoor recreational areas, Hiking trails, Picnic spots, Nature observation |
| Columbia Valley | Known for its wineries and agricultural richness, this area attracts visitors interested in wine tasting and farm experiences. Great for those seeking a unique rural retreat. | Local vineyards, Wine tasting tours, Farmers markets, Scenic drives, Agricultural tours |
| Deming Taggart | A charming neighborhood with historic homes and easy access to the scenic countryside. Appeals to guests looking for a taste of local history and small-town charm. | Historic architecture, Local art galleries, Community events, Cultural festivals, Nearby hiking trails |
| West Deming | Offers a mix of residential comfort and access to outdoor adventures. Ideal for travelers seeking a balance of town amenities and nature. | Public parks, Art installations, Trailheads for hiking, Restaurants, Community centers |
| Deming Lake | Great for those who love water activities and fishing. A delightful spot for families and friends looking for fun in nature. | Deming Lake, Fishing spots, Picnic areas, Nature trails, Canoeing opportunities |
| Clearview Estates | A tranquil neighborhood perfect for retreat seekers. Attracts those looking to relax away from the busy downtown area. | Peaceful environment, Local flora and fauna, Parks, Outdoor sports areas, Community gatherings |
| Sunset Acres | A developing area that offers potential for future growth and investment. Attractive for travelers willing to explore up-and-coming neighborhoods. | New developments, Emerging dining spots, Community parks, Family-friendly environments, Local markets |
Understanding Airbnb License Requirements & STR Laws in Deming (2026)
While Deming, Washington, United States currently shows low STR regulations, specific Airbnb license requirements might still exist or change. Always verify the latest short term rental regulations and Airbnb license requirements directly with local government authorities for Deming to ensure full compliance before hosting.
(Source: AirROI data, 2026, finding no licensed listings among those analyzed)
Top Performing Airbnb Properties in Deming (2026)
Benchmark your potential! Explore examples of top-performing Airbnb properties in Demingbased on Trailing Twelve Month (TTM) revenue. Analyze their characteristics, revenue, occupancy rate, and ADR to understand what drives success in this market.
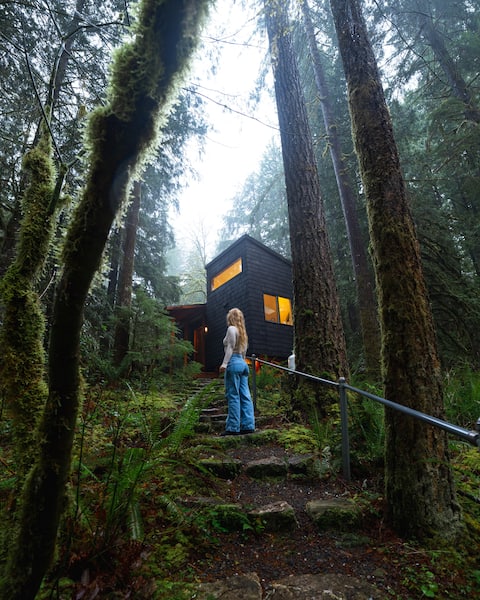
Private Mt. Baker Cabin | Cedar Tub + Forest Views
Entire Place • 1 bedroom
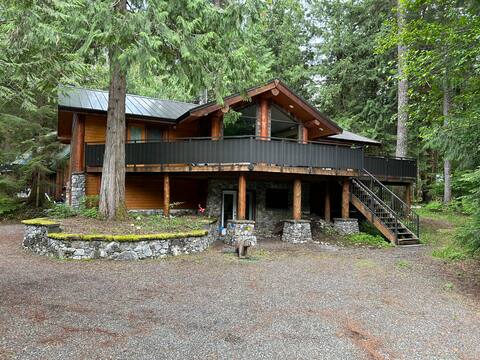
Mountain Magic -two kitchens-hot tub - EV charger
Entire Place • 5 bedrooms

Glacier Creek Chalet –Stay Late, Lounge Longer
Entire Place • 4 bedrooms

Luxe | Mt. Baker | Hot Tub | EV Charger
Entire Place • 3 bedrooms
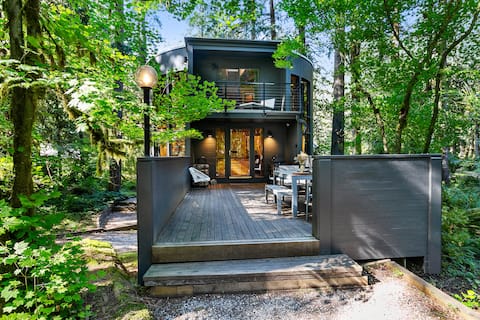
Architect Designed Round Cabin - Snowline Castle
Entire Place • 4 bedrooms

Baker Bliss Chalet-Game Room, Hot Tub, EV Charger
Entire Place • 3 bedrooms
Note: Performance varies based on location, size, amenities, seasonality, and management quality. Data reflects the past 12 months.
Top Performing Airbnb Hosts in Deming (2026)
Learn from the best! This table showcases top-performing Airbnb hosts in Deming based on the number of properties managed and estimated total revenue over the past year. Analyze their scale and performance metrics.
| Host Name | Properties | Grossing Revenue | Stay Reviews | Avg Rating |
|---|---|---|---|---|
| Luxury Getaways | 36 | $989,681 | 938 | 4.82/5.0 |
| Mt. Baker Lodging | 34 | $540,170 | 392 | 4.51/5.0 |
| Mish | 4 | $232,914 | 730 | 4.95/5.0 |
| Katherine | 2 | $184,229 | 160 | 4.97/5.0 |
| Amber | 1 | $176,136 | 237 | 4.99/5.0 |
| Tanys | 1 | $132,555 | 35 | 5.00/5.0 |
| Jolie | 2 | $126,233 | 184 | 4.97/5.0 |
| Hayley | 1 | $125,978 | 38 | 5.00/5.0 |
| Eric | 1 | $114,429 | 104 | 4.98/5.0 |
| Reyford | 3 | $92,434 | 72 | 5.00/5.0 |
Analyzing the strategies of top hosts, such as their property selection, pricing, and guest communication, can offer valuable lessons for optimizing your own Airbnb operations in Deming.
Dive Deeper: Advanced Deming STR Market Data (2026)
Ready to unlock more insights? AirROI provides access to advanced metrics and comprehensive Airbnb data for Deming. Explore detailed analytics beyond this report to refine your investment strategy, optimize pricing, and maximize your vacation rental profits.
Explore Advanced MetricsDeming Short-Term Rental Market Composition (2026): Property & Room Types
Room Type Distribution
Property Type Distribution
Market Composition Insights for Deming
- The Deming Airbnb market composition is heavily skewed towards Entire Home/Apt listings, which make up 99.6% of the 224 active rentals. This indicates strong guest preference for privacy and space.
- Looking at the property type distribution in Deming, Outdoor/Unique properties are the most common (44.2%), reflecting the local real estate landscape.
- Houses represent a significant 30.4% portion, catering likely to families or larger groups.
- Smaller segments like hotel/boutique, others (combined 4.9%) offer potential for unique stay experiences.
Deming Airbnb Room Capacity Analysis (2026): Bedroom Distribution
Distribution of Listings by Number of Bedrooms
Room Capacity Insights for Deming
- The dominant room capacity in Deming is 3 bedrooms listings, making up 32.1% of the market. This suggests a strong demand for properties suitable for families or small groups.
- Together, 3 bedrooms and 2 bedrooms properties represent 64.2% of the active Airbnb listings in Deming, indicating a high concentration in these sizes.
- A significant 39.7% of listings offer 3+ bedrooms, catering to larger groups and families seeking more space in Deming.
Deming Vacation Rental Guest Capacity Trends (2026)
Distribution of Listings by Guest Capacity
Guest Capacity Insights for Deming
- The most common guest capacity trend in Deming vacation rentals is listings accommodating 4 guests (29.9%). This suggests the primary traveler segment is likely small families or groups.
- Properties designed for 4 guests and 6 guests dominate the Deming STR market, accounting for 58.0% of listings.
- 52.2% of properties accommodate 6+ guests, serving the market segment for larger families or group travel in Deming.
- On average, properties in Deming are equipped to host 5.3 guests.
Deming Airbnb Booking Patterns (2026): Available vs. Booked Days
Available Days Distribution
Booked Days Distribution
Booking Pattern Insights for Deming
- The most common availability pattern in Deming falls within the 271-366 days range, representing 54.9% of listings. This suggests many properties have significant open periods on their calendars.
- Approximately 81.7% of listings show high availability (181+ days open annually), indicating potential for increased bookings or specific owner usage patterns.
- For booked days, the 31-90 days range is most frequent in Deming (36.2%), reflecting common guest stay durations or potential owner blocking patterns.
- A notable 20.1% of properties secure long booking periods (181+ days booked per year), highlighting successful long-term rental strategies or significant owner usage.
Deming Airbnb Minimum Stay Requirements Analysis
Distribution of Listings by Minimum Night Requirement
1 Night
20 listings
8.9% of total
2 Nights
125 listings
55.8% of total
3 Nights
5 listings
2.2% of total
4-6 Nights
1 listings
0.4% of total
30+ Nights
73 listings
32.6% of total
Key Insights
- The most prevalent minimum stay requirement in Deming is 2 Nights, adopted by 55.8% of listings. This highlights the market's preference for shorter, flexible bookings.
- A strong majority (64.7%) of the Deming Airbnb data shows acceptance of very short stays (1-2 nights), indicating a dynamic, high-turnover market.
- A significant segment (32.6%) caters to monthly stays (30+ nights) in Deming, pointing to opportunities in the extended-stay market.
Recommendations
- Align with the market by considering a 2 Nights minimum stay, as 55.8% of Deming hosts use this setting.
- If feasible, allowing 1-night stays, especially midweek or during low season, could capture last-minute bookings, as only 8.9% currently do.
- A 2-night minimum appears standard (55.8%). Consider this for weekends or peak periods.
- Explore offering discounts for stays of 30+ nights to attract the 32.6% of the market seeking extended stays.
- Adjust minimum nights based on seasonality – potentially shorter during low season and longer during peak demand periods in Deming.
Deming Airbnb Cancellation Policy Trends Analysis (2026)
Super Strict 30 Days
34 listings
15.2% of total
Super Strict 60 Days
11 listings
4.9% of total
Limited
6 listings
2.7% of total
Flexible
15 listings
6.7% of total
Moderate
34 listings
15.2% of total
Firm
102 listings
45.5% of total
Strict
22 listings
9.8% of total
Cancellation Policy Insights for Deming
- The prevailing Airbnb cancellation policy trend in Deming is Firm, used by 45.5% of listings.
- A majority (55.3%) of hosts in Deming utilize Firm or Strict policies, indicating a market where hosts prioritize booking security.
- Strict cancellation policies are quite rare (9.8%), potentially making listings with this policy less competitive unless justified by high demand or property type.
Recommendations for Hosts
- Consider adopting a Firm policy to align with the 45.5% market standard in Deming.
- Using a Strict policy might deter some guests, as only 9.8% of listings use it. Evaluate if potential revenue protection outweighs possible lower booking rates.
- Regularly review your cancellation policy against competitors and market demand shifts in Deming.
Deming STR Booking Lead Time Analysis (2026)
Average Booking Lead Time by Month
Booking Lead Time Insights for Deming
- The overall average booking lead time for vacation rentals in Deming is 46 days.
- Guests book furthest in advance for stays during July (average 66 days), likely coinciding with peak travel demand or local events.
- The shortest booking windows occur for stays in November (average 33 days), indicating more last-minute travel plans during this time.
- Seasonally, Summer (55 days avg.) sees the longest lead times, while Spring (36 days avg.) has the shortest, reflecting typical travel planning cycles.
Recommendations for Hosts
- Use the overall average lead time (46 days) as a baseline for your pricing and availability strategy in Deming.
- For July stays, consider implementing length-of-stay discounts or slightly higher rates for bookings made less than 66 days out to capitalize on advance planning.
- Target marketing efforts for the Summer season well in advance (at least 55 days) to capture early planners.
- Monitor your own booking lead times against these Deming averages to identify opportunities for dynamic pricing adjustments.
Popular & Essential Airbnb Amenities in Deming (2026)
Amenity Prevalence
Amenity Insights for Deming
- Essential amenities in Deming that guests expect include: Smoke alarm, Free parking on premises, Heating, Dishes and silverware, Coffee maker, Wifi, Kitchen, Refrigerator, Cooking basics. Lacking these (any) could significantly impact bookings.
- Popular amenities like Carbon monoxide alarm are common but not universal. Offering these can provide a competitive edge.
Recommendations for Hosts
- Ensure your listing includes all essential amenities for Deming: Smoke alarm, Free parking on premises, Heating, Dishes and silverware, Coffee maker, Wifi, Kitchen, Refrigerator, Cooking basics.
- Prioritize adding missing essentials: Smoke alarm, Free parking on premises, Heating, Dishes and silverware, Coffee maker, Wifi, Kitchen, Refrigerator, Cooking basics.
- Consider adding popular differentiators like Carbon monoxide alarm to increase appeal.
- Highlight unique or less common amenities you offer (e.g., hot tub, dedicated workspace, EV charger) in your listing description and photos.
- Regularly check competitor amenities in Deming to stay competitive.
Deming Airbnb Guest Demographics & Profile Analysis (2026)
Guest Profile Summary for Deming
- The typical guest profile for Airbnb in Deming consists of primarily domestic travelers (90%), often arriving from nearby Seattle, typically belonging to the Post-2000s (Gen Z/Alpha) group (50%), primarily speaking English or Spanish.
- Domestic travelers account for 90.3% of guests.
- Key international markets include United States (90.3%) and Canada (6.8%).
- Top languages spoken are English (66.9%) followed by Spanish (11%).
- A significant demographic segment is the Post-2000s (Gen Z/Alpha) group, representing 50% of guests.
Recommendations for Hosts
- Target domestic marketing efforts towards travelers from Seattle and Vancouver.
- Tailor amenities and listing descriptions to appeal to the dominant Post-2000s (Gen Z/Alpha) demographic (e.g., highlight fast WiFi, smart home features, local guides).
- Highlight unique local experiences or amenities relevant to the primary guest profile.
- Consider seasonal promotions aligned with peak travel times for key origin markets.
Nearby Short-Term Rental Market Comparison
How does the Deming Airbnb market stack up against its neighbors? Compare key performance metrics like average monthly revenue, ADR, and occupancy rates in surrounding areas to understand the broader regional STR landscape.
| Market | Active Properties | Monthly Revenue | Daily Rate | Avg. Occupancy |
|---|---|---|---|---|
| Orondo | 30 | $5,684 | $469.77 | 45% |
| Erlands Point-Kitsap Lake | 12 | $5,285 | $366.41 | 47% |
| Cle Elum | 419 | $5,281 | $596.34 | 33% |
| Plain | 53 | $5,148 | $449.05 | 42% |
| North Bend | 51 | $5,073 | $352.89 | 57% |
| Peshastin | 33 | $4,951 | $432.44 | 39% |
| Olalla | 13 | $4,868 | $334.79 | 49% |
| Sudden Valley | 63 | $4,821 | $324.44 | 51% |
| Warm Beach | 10 | $4,811 | $319.50 | 43% |
| Verlot | 11 | $4,608 | $314.03 | 49% |