Chehalis Airbnb Market Analysis 2026: Short Term Rental Data & Vacation Rental Statistics in Washington, United States
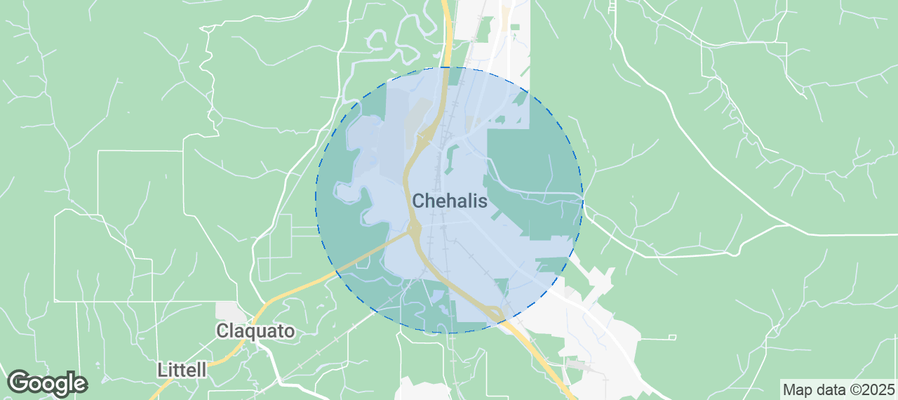
Is Airbnb profitable in Chehalis in 2026? Explore comprehensive Airbnb analytics for Chehalis, Washington, United States to uncover income potential. This 2026 STR market report for Chehalis, based on AirROI data from February 2025 to January 2026, reveals key trends in the niche market of 30 active listings.
Whether you're considering an Airbnb investment in Chehalis, optimizing your existing vacation rental, or exploring rental arbitrage opportunities, understanding the Chehalis Airbnb data is crucial. Leveraging the low regulation environment is key to maximizing your short term rental income potential. Let's dive into the specifics.
Key Chehalis Airbnb Performance Metrics Overview
Monthly Airbnb Revenue Variations & Income Potential in Chehalis (2026)
Understanding the monthly revenue variations for Airbnb listings in Chehalis is key to maximizing your short term rental income potential. Seasonality significantly impacts earnings. Our analysis, based on data from the past 12 months, shows that the peak revenue month for STRs in Chehalis is typically March, while January often presents the lowest earnings, highlighting opportunities for strategic pricing adjustments during shoulder and low seasons. Explore the typical Airbnb income in Chehalis across different performance tiers:
- Best-in-class properties (Top 10%) achieve $5,521+ monthly, often utilizing dynamic pricing and superior guest experiences.
- Strong performing properties (Top 25%) earn $3,514 or more, indicating effective management and desirable locations/amenities.
- Typical properties (Median) generate around $1,978 per month, representing the average market performance.
- Entry-level properties (Bottom 25%) see earnings around $628, often with potential for optimization.
Average Monthly Airbnb Earnings Trend in Chehalis
Chehalis Airbnb Occupancy Rate Trends (2026)
Maximize your bookings by understanding the Chehalis STR occupancy trends. Seasonal demand shifts significantly influence how often properties are booked. Typically, Julysees the highest demand (peak season occupancy), while January experiences the lowest (low season). Effective strategies, like adjusting minimum stays or offering promotions, can boost occupancy during slower periods. Here's how different property tiers perform in Chehalis:
- Best-in-class properties (Top 10%) achieve 76%+ occupancy, indicating high desirability and potentially optimized availability.
- Strong performing properties (Top 25%) maintain 58% or higher occupancy, suggesting good market fit and guest satisfaction.
- Typical properties (Median) have an occupancy rate around 34%.
- Entry-level properties (Bottom 25%) average 21% occupancy, potentially facing higher vacancy.
Average Monthly Occupancy Rate Trend in Chehalis
Average Daily Rate (ADR) Airbnb Trends in Chehalis (2026)
Effective short term rental pricing strategy in Chehalis involves understanding monthly ADR fluctuations. The Average Daily Rate (ADR) for Airbnb in Chehalis typically peaks in October and dips lowest during April. Leveraging Airbnb dynamic pricing tools or strategies based on this seasonality can significantly boost revenue. Here's a look at the typical nightly rates achieved:
- Best-in-class properties (Top 10%) command rates of $361+ per night, often due to premium features or locations.
- Strong performing properties (Top 25%) achieve nightly rates of $213 or more.
- Typical properties (Median) charge around $148 per night.
- Entry-level properties (Bottom 25%) earn around $91 per night.
Average Daily Rate (ADR) Trend by Month in Chehalis
Get Live Chehalis Market Intelligence 👇
Explore Real-time Analytics
Airbnb Seasonality Analysis & Trends in Chehalis (2026)
Peak Season (March, July, August)
- Revenue averages $3,087 per month
- Occupancy rates average 46.8%
- Daily rates average $171
Shoulder Season
- Revenue averages $2,458 per month
- Occupancy maintains around 41.8%
- Daily rates hold near $168
Low Season (January, October, November)
- Revenue drops to average $1,852 per month
- Occupancy decreases to average 29.7%
- Daily rates adjust to average $182
Seasonality Insights for Chehalis
- The Airbnb seasonality in Chehalis shows highly seasonal trends requiring careful strategy. While the sections above show seasonal averages, it's also insightful to look at the extremes:
- During the high season, the absolute peak month showcases Chehalis's highest earning potential, with monthly revenues capable of climbing to $3,194, occupancy reaching a high of 47.6%, and ADRs peaking at $184.
- Conversely, the slowest single month of the year, typically falling within the low season, marks the market's lowest point. In this month, revenue might dip to $1,054, occupancy could drop to 17.3%, and ADRs may adjust down to $151.
- Understanding both the seasonal averages and these monthly peaks and troughs in revenue, occupancy, and ADR is crucial for maximizing your Airbnb profit potential in Chehalis.
Seasonal Strategies for Maximizing Profit
- Peak Season: Maximize revenue through premium pricing and potentially longer minimum stays. Ensure high availability.
- Low Season: Offer competitive pricing, special promotions (e.g., extended stay discounts), and flexible cancellation policies. Target off-season travelers like remote workers or budget-conscious guests.
- Shoulder Seasons: Implement dynamic pricing that balances peak and low rates. Target weekend travelers or specific events. Offer slightly more flexible terms than peak season.
- Regularly analyze your own performance against these Chehalis seasonality benchmarks and adjust your pricing and availability strategy accordingly.
Best Areas for Airbnb Investment in Chehalis (2026)
Exploring the top neighborhoods for short-term rentals in Chehalis? This section highlights key areas, outlining why they are attractive for hosts and guests, along with notable local attractions. Consider these locations based on your target guest profile and investment strategy.
| Neighborhood / Area | Why Host Here? (Target Guests & Appeal) | Key Attractions & Landmarks |
|---|---|---|
| South Chehalis | A quiet residential area with community parks and a family-friendly atmosphere. It's great for longer stays for families visiting relatives or looking for a peaceful environment. | Chehalis-Centralia Railroad, Parks and Recreational Areas, Fairgrounds |
| Downtown Chehalis | The historic downtown area featuring charming shops, restaurants, and local culture. It's ideal for guests wanting to experience local festivals and events. | Veterans Memorial Museum, Historic Courthouse, Chehalis River |
| Chehalis River Valley | A scenic area that attracts nature lovers and outdoor enthusiasts. Close to various recreational activities such as hiking and fishing. | Lewis and Clark Trail, Fishing and boating spots, Wildlife viewing |
| Centralia | Located right next to Chehalis, this area is known for its antique shopping and historic downtown, making it appealing to visitors interested in local history. | Centralia Historic District, Centralia Outlets, Antique Malls |
| Adna | A rural neighborhood close to Chehalis offering a peaceful retreat for those looking to escape the hustle and bustle. Great for couples and nature lovers. | Cowlitz River, Local farms, Outdoor trails |
| Winlock | A small town near Chehalis, perfect for travelers seeking a small-town experience and easy access to Mount St. Helens. | Winlock Historical Museum, Local art and crafts shops, Kimbers Trail |
| Lewis County | A larger area encompassing various small towns, appealing to visitors looking for a broader experience of Washington’s scenic beauty and outdoor activities. | Mount St. Helens, Lewis County Historical Museum, Secluded hiking trails |
| Rochester | A nearby town with a small-town feel, offering visitors a quiet stay close to nature. Ideal for travelers wanting to be near rural events and local farms. | Rochester Historical Museum, Local farmers market, Outdoor recreation areas |
Understanding Airbnb License Requirements & STR Laws in Chehalis (2026)
While Chehalis, Washington, United States currently shows low STR regulations, specific Airbnb license requirements might still exist or change. Always verify the latest short term rental regulations and Airbnb license requirements directly with local government authorities for Chehalis to ensure full compliance before hosting.
(Source: AirROI data, 2026, finding no licensed listings among those analyzed)
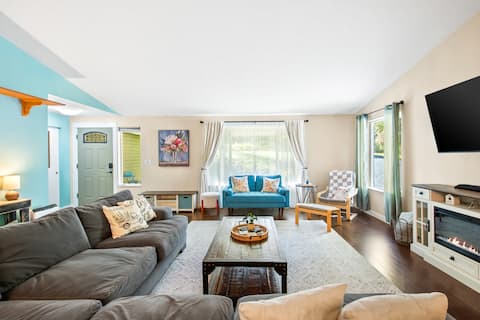
Top Performing Airbnb Properties in Chehalis (2026)
Benchmark your potential! Explore examples of top-performing Airbnb properties in Chehalisbased on Trailing Twelve Month (TTM) revenue. Analyze their characteristics, revenue, occupancy rate, and ADR to understand what drives success in this market.

Alpha Lodge, stay & play, relax retreat, max 14
Entire Place • 4 bedrooms

Country Charm
Entire Place • 3 bedrooms
Countryside Getaway: King beds|Fire pit|Fast wi-fi
Entire Place • 4 bedrooms
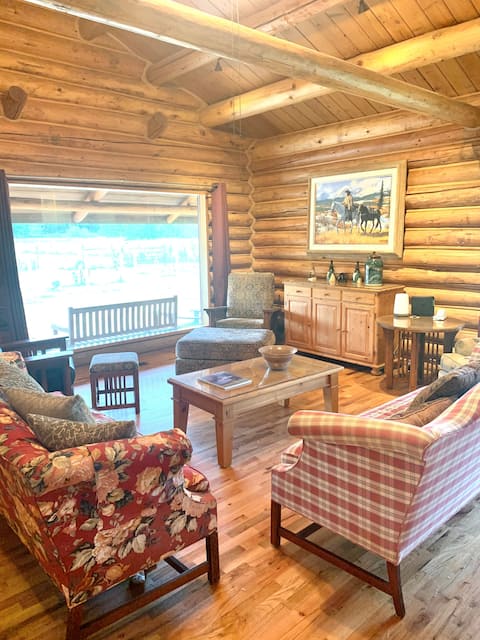
Log Home in Doty near Chehalis, WA on 9 acres
Entire Place • 4 bedrooms
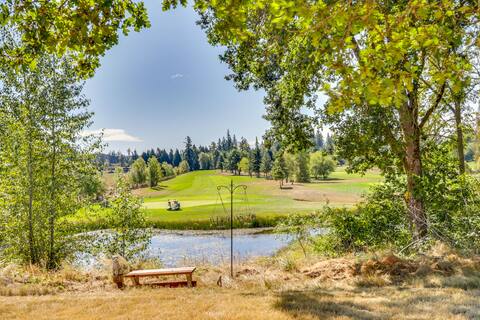
Chehalis Getaway w/ Golf Course View + Fire Pit!
Entire Place • 3 bedrooms

Peaceful Retreat in Country (Fenced & Gated)
Entire Place • 3 bedrooms
Note: Performance varies based on location, size, amenities, seasonality, and management quality. Data reflects the past 12 months.
Top Performing Airbnb Hosts in Chehalis (2026)
Learn from the best! This table showcases top-performing Airbnb hosts in Chehalis based on the number of properties managed and estimated total revenue over the past year. Analyze their scale and performance metrics.
| Host Name | Properties | Grossing Revenue | Stay Reviews | Avg Rating |
|---|---|---|---|---|
| Cachet | 1 | $88,685 | 41 | 4.93/5.0 |
| Evolve | 3 | $88,021 | 66 | 4.83/5.0 |
| John | 1 | $78,941 | 26 | 5.00/5.0 |
| Adi | 1 | $57,223 | 46 | 5.00/5.0 |
| Ralph | 1 | $54,351 | 68 | 4.87/5.0 |
| Wayne | 3 | $46,823 | 251 | 4.70/5.0 |
| John | 1 | $36,468 | 118 | 4.92/5.0 |
| Ashley | 1 | $32,504 | 45 | 4.96/5.0 |
| Tim | 1 | $31,417 | 71 | 5.00/5.0 |
| Catherine | 1 | $31,115 | 15 | 5.00/5.0 |
Analyzing the strategies of top hosts, such as their property selection, pricing, and guest communication, can offer valuable lessons for optimizing your own Airbnb operations in Chehalis.
Dive Deeper: Advanced Chehalis STR Market Data (2026)
Ready to unlock more insights? AirROI provides access to advanced metrics and comprehensive Airbnb data for Chehalis. Explore detailed analytics beyond this report to refine your investment strategy, optimize pricing, and maximize your vacation rental profits.
Explore Advanced MetricsChehalis Short-Term Rental Market Composition (2026): Property & Room Types
Room Type Distribution
Property Type Distribution
Market Composition Insights for Chehalis
- The Chehalis Airbnb market composition is heavily skewed towards Entire Home/Apt listings, which make up 80% of the 30 active rentals. This indicates strong guest preference for privacy and space.
- Looking at the property type distribution in Chehalis, House properties are the most common (66.7%), reflecting the local real estate landscape.
- Houses represent a significant 66.7% portion, catering likely to families or larger groups.
Chehalis Airbnb Room Capacity Analysis (2026): Bedroom Distribution
Distribution of Listings by Number of Bedrooms
Room Capacity Insights for Chehalis
- The dominant room capacity in Chehalis is 1 bedroom listings, making up 23.3% of the market. This suggests a strong demand for properties suitable for couples or solo travelers.
- Together, 1 bedroom and 3 bedrooms properties represent 43.3% of the active Airbnb listings in Chehalis, indicating a high concentration in these sizes.
- A significant 33.3% of listings offer 3+ bedrooms, catering to larger groups and families seeking more space in Chehalis.
Chehalis Vacation Rental Guest Capacity Trends (2026)
Distribution of Listings by Guest Capacity
Guest Capacity Insights for Chehalis
- The most common guest capacity trend in Chehalis vacation rentals is listings accommodating 8+ guests (23.3%). This suggests the primary traveler segment is likely larger groups.
- Properties designed for 8+ guests and 6 guests dominate the Chehalis STR market, accounting for 40.0% of listings.
- 46.7% of properties accommodate 6+ guests, serving the market segment for larger families or group travel in Chehalis.
- On average, properties in Chehalis are equipped to host 4.3 guests.
Chehalis Airbnb Booking Patterns (2026): Available vs. Booked Days
Available Days Distribution
Booked Days Distribution
Booking Pattern Insights for Chehalis
- The most common availability pattern in Chehalis falls within the 181-270 days range, representing 43.3% of listings. This suggests many properties have significant open periods on their calendars.
- Approximately 76.6% of listings show high availability (181+ days open annually), indicating potential for increased bookings or specific owner usage patterns.
- For booked days, the 91-180 days range is most frequent in Chehalis (40%), reflecting common guest stay durations or potential owner blocking patterns.
- A notable 26.7% of properties secure long booking periods (181+ days booked per year), highlighting successful long-term rental strategies or significant owner usage.
Chehalis Airbnb Minimum Stay Requirements Analysis
Distribution of Listings by Minimum Night Requirement
1 Night
15 listings
50% of total
2 Nights
9 listings
30% of total
3 Nights
1 listings
3.3% of total
30+ Nights
5 listings
16.7% of total
Key Insights
- The most prevalent minimum stay requirement in Chehalis is 1 Night, adopted by 50% of listings. This highlights the market's preference for shorter, flexible bookings.
- A strong majority (80.0%) of the Chehalis Airbnb data shows acceptance of very short stays (1-2 nights), indicating a dynamic, high-turnover market.
- A significant segment (16.7%) caters to monthly stays (30+ nights) in Chehalis, pointing to opportunities in the extended-stay market.
Recommendations
- Align with the market by considering a 1 Night minimum stay, as 50% of Chehalis hosts use this setting.
- Explore offering discounts for stays of 30+ nights to attract the 16.7% of the market seeking extended stays.
- Adjust minimum nights based on seasonality – potentially shorter during low season and longer during peak demand periods in Chehalis.
Chehalis Airbnb Cancellation Policy Trends Analysis (2026)
Flexible
14 listings
46.7% of total
Moderate
9 listings
30% of total
Firm
4 listings
13.3% of total
Strict
3 listings
10% of total
Cancellation Policy Insights for Chehalis
- The prevailing Airbnb cancellation policy trend in Chehalis is Flexible, used by 46.7% of listings.
- The market strongly favors guest-friendly terms, with 76.7% of listings offering Flexible or Moderate policies. This suggests guests in Chehalis may expect booking flexibility.
Recommendations for Hosts
- Consider adopting a Flexible policy to align with the 46.7% market standard in Chehalis.
- Using a Strict policy might deter some guests, as only 10% of listings use it. Evaluate if potential revenue protection outweighs possible lower booking rates.
- Regularly review your cancellation policy against competitors and market demand shifts in Chehalis.
Chehalis STR Booking Lead Time Analysis (2026)
Average Booking Lead Time by Month
Booking Lead Time Insights for Chehalis
- The overall average booking lead time for vacation rentals in Chehalis is 50 days.
- Guests book furthest in advance for stays during July (average 88 days), likely coinciding with peak travel demand or local events.
- The shortest booking windows occur for stays in March (average 22 days), indicating more last-minute travel plans during this time.
- Seasonally, Summer (63 days avg.) sees the longest lead times, while Spring (40 days avg.) has the shortest, reflecting typical travel planning cycles.
Recommendations for Hosts
- Use the overall average lead time (50 days) as a baseline for your pricing and availability strategy in Chehalis.
- For July stays, consider implementing length-of-stay discounts or slightly higher rates for bookings made less than 88 days out to capitalize on advance planning.
- Target marketing efforts for the Summer season well in advance (at least 63 days) to capture early planners.
- Monitor your own booking lead times against these Chehalis averages to identify opportunities for dynamic pricing adjustments.
Popular & Essential Airbnb Amenities in Chehalis (2026)
Amenity Prevalence
Amenity Insights for Chehalis
- Popular amenities like Free parking on premises, Bed linens, Heating are common but not universal. Offering these can provide a competitive edge.
- Warning: Wifi is not universally provided but is considered essential globally. Ensure reliable Wifi is offered.
Recommendations for Hosts
- Consider adding popular differentiators like Free parking on premises or Bed linens to increase appeal.
- Highlight unique or less common amenities you offer (e.g., hot tub, dedicated workspace, EV charger) in your listing description and photos.
- Regularly check competitor amenities in Chehalis to stay competitive.
Chehalis Airbnb Guest Demographics & Profile Analysis (2026)
Guest Profile Summary for Chehalis
- The typical guest profile for Airbnb in Chehalis consists of primarily domestic travelers (95%), often arriving from nearby Seattle, typically belonging to the Post-2000s (Gen Z/Alpha) group (50%), primarily speaking English or Spanish.
- Domestic travelers account for 94.6% of guests.
- Key international markets include United States (94.6%) and United Kingdom (1.8%).
- Top languages spoken are English (73.8%) followed by Spanish (6.8%).
- A significant demographic segment is the Post-2000s (Gen Z/Alpha) group, representing 50% of guests.
Recommendations for Hosts
- Target domestic marketing efforts towards travelers from Seattle and Portland.
- Tailor amenities and listing descriptions to appeal to the dominant Post-2000s (Gen Z/Alpha) demographic (e.g., highlight fast WiFi, smart home features, local guides).
- Highlight unique local experiences or amenities relevant to the primary guest profile.
- Consider seasonal promotions aligned with peak travel times for key origin markets.
Nearby Short-Term Rental Market Comparison
How does the Chehalis Airbnb market stack up against its neighbors? Compare key performance metrics like average monthly revenue, ADR, and occupancy rates in surrounding areas to understand the broader regional STR landscape.
| Market | Active Properties | Monthly Revenue | Daily Rate | Avg. Occupancy |
|---|---|---|---|---|
| Arch Cape | 78 | $7,909 | $512.29 | 53% |
| Erlands Point-Kitsap Lake | 12 | $5,285 | $366.41 | 47% |
| Manzanita | 288 | $5,262 | $395.19 | 43% |
| Cannon Beach | 226 | $5,178 | $436.27 | 46% |
| Olalla | 13 | $4,868 | $334.79 | 49% |
| Dundee | 71 | $4,771 | $426.97 | 35% |
| Woodinville | 35 | $4,409 | $340.44 | 51% |
| Moclips | 108 | $4,391 | $433.53 | 39% |
| Amanda Park | 11 | $4,328 | $447.54 | 40% |
| Warrenton | 60 | $4,241 | $385.97 | 43% |