Carlsborg Airbnb Market Analysis 2026: Short Term Rental Data & Vacation Rental Statistics in Washington, United States
Is Airbnb profitable in Carlsborg in 2026? Explore comprehensive Airbnb analytics for Carlsborg, Washington, United States to uncover income potential. This 2026 STR market report for Carlsborg, based on AirROI data from February 2025 to January 2026, reveals key trends in the niche market of 22 active listings.
Whether you're considering an Airbnb investment in Carlsborg, optimizing your existing vacation rental, or exploring rental arbitrage opportunities, understanding the Carlsborg Airbnb data is crucial. Leveraging the low regulation environment is key to maximizing your short term rental income potential. Let's dive into the specifics.
Key Carlsborg Airbnb Performance Metrics Overview
Monthly Airbnb Revenue Variations & Income Potential in Carlsborg (2026)
Understanding the monthly revenue variations for Airbnb listings in Carlsborg is key to maximizing your short term rental income potential. Seasonality significantly impacts earnings. Our analysis, based on data from the past 12 months, shows that the peak revenue month for STRs in Carlsborg is typically July, while January often presents the lowest earnings, highlighting opportunities for strategic pricing adjustments during shoulder and low seasons. Explore the typical Airbnb income in Carlsborg across different performance tiers:
- Best-in-class properties (Top 10%) achieve $3,413+ monthly, often utilizing dynamic pricing and superior guest experiences.
- Strong performing properties (Top 25%) earn $2,497 or more, indicating effective management and desirable locations/amenities.
- Typical properties (Median) generate around $1,883 per month, representing the average market performance.
- Entry-level properties (Bottom 25%) see earnings around $1,121, often with potential for optimization.
Average Monthly Airbnb Earnings Trend in Carlsborg
Carlsborg Airbnb Occupancy Rate Trends (2026)
Maximize your bookings by understanding the Carlsborg STR occupancy trends. Seasonal demand shifts significantly influence how often properties are booked. Typically, Julysees the highest demand (peak season occupancy), while January experiences the lowest (low season). Effective strategies, like adjusting minimum stays or offering promotions, can boost occupancy during slower periods. Here's how different property tiers perform in Carlsborg:
- Best-in-class properties (Top 10%) achieve 76%+ occupancy, indicating high desirability and potentially optimized availability.
- Strong performing properties (Top 25%) maintain 64% or higher occupancy, suggesting good market fit and guest satisfaction.
- Typical properties (Median) have an occupancy rate around 48%.
- Entry-level properties (Bottom 25%) average 30% occupancy, potentially facing higher vacancy.
Average Monthly Occupancy Rate Trend in Carlsborg
Average Daily Rate (ADR) Airbnb Trends in Carlsborg (2026)
Effective short term rental pricing strategy in Carlsborg involves understanding monthly ADR fluctuations. The Average Daily Rate (ADR) for Airbnb in Carlsborg typically peaks in June and dips lowest during February. Leveraging Airbnb dynamic pricing tools or strategies based on this seasonality can significantly boost revenue. Here's a look at the typical nightly rates achieved:
- Best-in-class properties (Top 10%) command rates of $205+ per night, often due to premium features or locations.
- Strong performing properties (Top 25%) achieve nightly rates of $156 or more.
- Typical properties (Median) charge around $124 per night.
- Entry-level properties (Bottom 25%) earn around $105 per night.
Average Daily Rate (ADR) Trend by Month in Carlsborg
Get Live Carlsborg Market Intelligence 👇

Explore Real-time Analytics
Airbnb Seasonality Analysis & Trends in Carlsborg (2026)
Peak Season (July, August, September)
- Revenue averages $3,474 per month
- Occupancy rates average 70.9%
- Daily rates average $160
Shoulder Season
- Revenue averages $1,829 per month
- Occupancy maintains around 45.6%
- Daily rates hold near $140
Low Season (January, February, December)
- Revenue drops to average $860 per month
- Occupancy decreases to average 25.7%
- Daily rates adjust to average $128
Seasonality Insights for Carlsborg
- The Airbnb seasonality in Carlsborg shows highly seasonal trends requiring careful strategy. While the sections above show seasonal averages, it's also insightful to look at the extremes:
- During the high season, the absolute peak month showcases Carlsborg's highest earning potential, with monthly revenues capable of climbing to $4,138, occupancy reaching a high of 79.0%, and ADRs peaking at $165.
- Conversely, the slowest single month of the year, typically falling within the low season, marks the market's lowest point. In this month, revenue might dip to $546, occupancy could drop to 15.4%, and ADRs may adjust down to $122.
- Understanding both the seasonal averages and these monthly peaks and troughs in revenue, occupancy, and ADR is crucial for maximizing your Airbnb profit potential in Carlsborg.
Seasonal Strategies for Maximizing Profit
- Peak Season: Maximize revenue through premium pricing and potentially longer minimum stays. Ensure high availability.
- Low Season: Offer competitive pricing, special promotions (e.g., extended stay discounts), and flexible cancellation policies. Target off-season travelers like remote workers or budget-conscious guests.
- Shoulder Seasons: Implement dynamic pricing that balances peak and low rates. Target weekend travelers or specific events. Offer slightly more flexible terms than peak season.
- Regularly analyze your own performance against these Carlsborg seasonality benchmarks and adjust your pricing and availability strategy accordingly.
Best Areas for Airbnb Investment in Carlsborg (2026)
Exploring the top neighborhoods for short-term rentals in Carlsborg? This section highlights key areas, outlining why they are attractive for hosts and guests, along with notable local attractions. Consider these locations based on your target guest profile and investment strategy.
| Neighborhood / Area | Why Host Here? (Target Guests & Appeal) | Key Attractions & Landmarks |
|---|---|---|
| Sequim Bay | A beautiful bay area perfect for outdoor activities and stunning waterfront views. Ideal for vacationers looking to explore nature and enjoy water sports. | Sequim Bay State Park, Blyn Farm and Garden, Dungeness Spit, Island View Beach, Sequim Aquatic Recreation Center |
| Olympic National Park | A vast natural area with diverse ecosystems including mountains, forests, and coastline, attracting nature lovers and adventure seekers. | Hoh Rain Forest, Hurricane Ridge, Lake Crescent, Sol Duc Hot Springs, Ruby Beach |
| Downtown Sequim | A charming downtown area with local shops, dining options, and cultural attractions, making it a convenient stay for visitors. | Sequim Museum and Arts, Blue Whole Gallery, Restaurants and Cafés, Local Parks, Farmers Market |
| Carrie Blake Community Park | A spacious community park with playgrounds, sports fields, and walking trails, popular for family vacations and outdoor activities. | Walking Trails, Fishing Ponds, Playgrounds, Event Facilities, Picnic Areas |
| Port Angeles | The largest city on the north side of the Olympic Peninsula, offering city amenities with access to nature and adventures. | Olympic National Park Visitor Center, Ediz Hook, Port Angeles City Pier, Museums, Restaurants |
| Dungeness Valley | Known for its scenic beauty and agricultural lands, ideal for those who want a peaceful rural stay with easy access to attractions. | Dungeness National Wildlife Refuge, Lavender Farms, Scenic Drives, Farmers Markets |
| Clallam Bay | A remote community near the ocean, perfect for those looking to escape the hustle and bustle and enjoy quiet beach time. | Clallam Bay Spit, Local Seafood Restaurants, Forest Trails, Kayaking Opportunities |
| Forks | Famous for its connection to the Twilight series, Forks attracts fans and outdoor enthusiasts alike, with access to lush forests and beaches. | Forks Timber Museum, La Push Beaches, Hoh Rain Forest, Forks High School |
Understanding Airbnb License Requirements & STR Laws in Carlsborg (2026)
While Carlsborg, Washington, United States currently shows low STR regulations, specific Airbnb license requirements might still exist or change. Always verify the latest short term rental regulations and Airbnb license requirements directly with local government authorities for Carlsborg to ensure full compliance before hosting.
(Source: AirROI data, 2026, finding no licensed listings among those analyzed)
Top Performing Airbnb Properties in Carlsborg (2026)
Benchmark your potential! Explore examples of top-performing Airbnb properties in Carlsborgbased on Trailing Twelve Month (TTM) revenue. Analyze their characteristics, revenue, occupancy rate, and ADR to understand what drives success in this market.
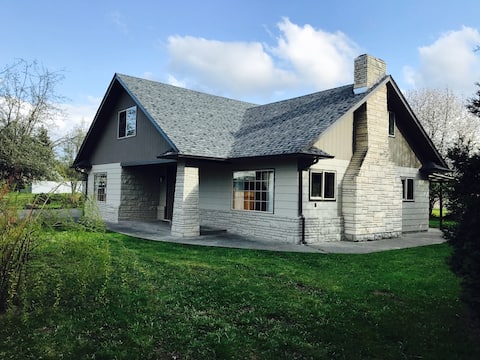
Olympic Peninsula Travel Headquarters on Hwy 101!
Entire Place • 4 bedrooms
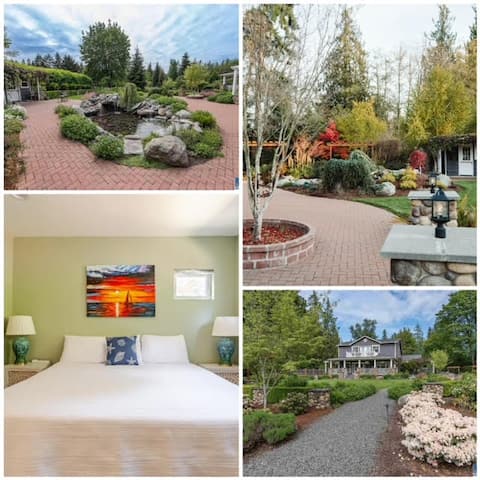
Creekside Haven- DuPont Suite *no cleaning fee*
Private Room • 1 bedroom
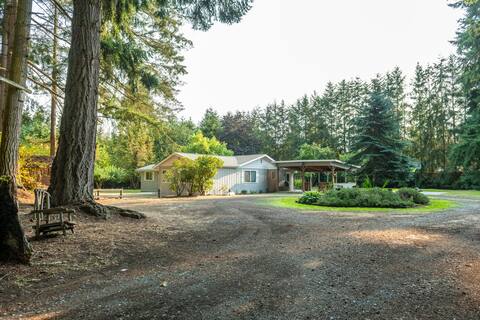
Sleepy Sasquatch Acres
Entire Place • 4 bedrooms

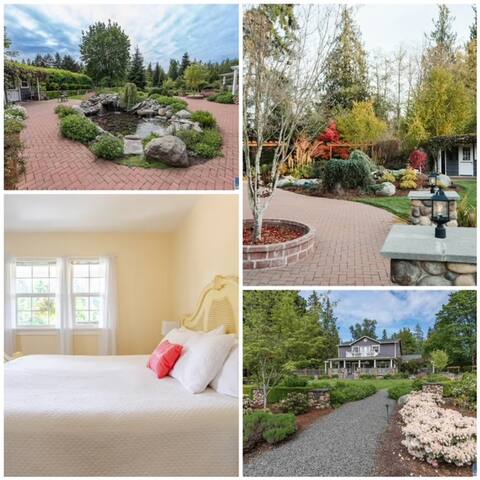
Dungeness Valley Inn- Lavender Rm
Private Room • 1 bedroom

Carlsborg Cottage
Entire Place • 1 bedroom
Creekside Haven-Paddock Suite *no cleaning fee*
Private Room • 1 bedroom
Note: Performance varies based on location, size, amenities, seasonality, and management quality. Data reflects the past 12 months.
Top Performing Airbnb Hosts in Carlsborg (2026)
Learn from the best! This table showcases top-performing Airbnb hosts in Carlsborg based on the number of properties managed and estimated total revenue over the past year. Analyze their scale and performance metrics.
| Host Name | Properties | Grossing Revenue | Stay Reviews | Avg Rating |
|---|---|---|---|---|
| Kris & Rick | 4 | $98,715 | 1024 | 5.00/5.0 |
| Darla | 4 | $93,807 | 351 | 4.99/5.0 |
| Ryan | 1 | $40,054 | 61 | 4.97/5.0 |
| Shandie | 1 | $26,978 | 34 | 4.82/5.0 |
| Theresa | 3 | $26,651 | 263 | 4.95/5.0 |
| Susan | 1 | $26,453 | 150 | 4.99/5.0 |
| Kelly | 1 | $23,223 | 146 | 5.00/5.0 |
| Tammy | 1 | $22,759 | 176 | 4.94/5.0 |
| Trisha | 1 | $18,204 | 306 | 4.95/5.0 |
| Jeanie | 1 | $14,520 | 162 | 4.98/5.0 |
Analyzing the strategies of top hosts, such as their property selection, pricing, and guest communication, can offer valuable lessons for optimizing your own Airbnb operations in Carlsborg.
Dive Deeper: Advanced Carlsborg STR Market Data (2026)
Ready to unlock more insights? AirROI provides access to advanced metrics and comprehensive Airbnb data for Carlsborg. Explore detailed analytics beyond this report to refine your investment strategy, optimize pricing, and maximize your vacation rental profits.
Explore Advanced MetricsCarlsborg Short-Term Rental Market Composition (2026): Property & Room Types
Room Type Distribution
Property Type Distribution
Market Composition Insights for Carlsborg
- The Carlsborg Airbnb market composition is heavily skewed towards Private Room listings, which make up 50% of the 22 active rentals. This indicates strong guest preference for privacy and space.
- Looking at the property type distribution in Carlsborg, Hotel/Boutique properties are the most common (45.5%), reflecting the local real estate landscape.
- Houses represent a significant 27.3% portion, catering likely to families or larger groups.
- The presence of 45.5% Hotel/Boutique listings indicates integration with traditional hospitality.
- Smaller segments like apartment/condo (combined 4.5%) offer potential for unique stay experiences.
Carlsborg Airbnb Room Capacity Analysis (2026): Bedroom Distribution
Distribution of Listings by Number of Bedrooms
Room Capacity Insights for Carlsborg
- The dominant room capacity in Carlsborg is 1 bedroom listings, making up 63.6% of the market. This suggests a strong demand for properties suitable for couples or solo travelers.
- Together, 1 bedroom and 4 bedrooms properties represent 72.7% of the active Airbnb listings in Carlsborg, indicating a high concentration in these sizes.
- With over half the market (63.6%) consisting of studios or 1-bedroom units, Carlsborg is particularly well-suited for individuals or couples.
- Listings with 3+ bedrooms (9.1%) represent a smaller niche, potentially indicating an underserved market for larger group accommodations in Carlsborg.
Carlsborg Vacation Rental Guest Capacity Trends (2026)
Distribution of Listings by Guest Capacity
Guest Capacity Insights for Carlsborg
- The most common guest capacity trend in Carlsborg vacation rentals is listings accommodating 3 guests (31.8%). This suggests the primary traveler segment is likely small families or groups.
- Properties designed for 3 guests and 2 guests dominate the Carlsborg STR market, accounting for 54.5% of listings.
- On average, properties in Carlsborg are equipped to host 3.0 guests.
Carlsborg Airbnb Booking Patterns (2026): Available vs. Booked Days
Available Days Distribution
Booked Days Distribution
Booking Pattern Insights for Carlsborg
- The most common availability pattern in Carlsborg falls within the 181-270 days range, representing 59.1% of listings. This suggests many properties have significant open periods on their calendars.
- Approximately 81.8% of listings show high availability (181+ days open annually), indicating potential for increased bookings or specific owner usage patterns.
- For booked days, the 91-180 days range is most frequent in Carlsborg (54.5%), reflecting common guest stay durations or potential owner blocking patterns.
- A notable 22.7% of properties secure long booking periods (181+ days booked per year), highlighting successful long-term rental strategies or significant owner usage.
Carlsborg Airbnb Minimum Stay Requirements Analysis
Distribution of Listings by Minimum Night Requirement
1 Night
7 listings
31.8% of total
2 Nights
2 listings
9.1% of total
3 Nights
1 listings
4.5% of total
7-29 Nights
1 listings
4.5% of total
30+ Nights
11 listings
50% of total
Key Insights
- The most prevalent minimum stay requirement in Carlsborg is 30+ Nights, adopted by 50% of listings. This highlights the market's preference for longer commitments.
- A significant segment (50%) caters to monthly stays (30+ nights) in Carlsborg, pointing to opportunities in the extended-stay market.
Recommendations
- Align with the market by considering a 30+ Nights minimum stay, as 50% of Carlsborg hosts use this setting.
- Explore offering discounts for stays of 30+ nights to attract the 50% of the market seeking extended stays.
- Adjust minimum nights based on seasonality – potentially shorter during low season and longer during peak demand periods in Carlsborg.
Carlsborg Airbnb Cancellation Policy Trends Analysis (2026)
Flexible
4 listings
18.2% of total
Moderate
5 listings
22.7% of total
Firm
5 listings
22.7% of total
Strict
8 listings
36.4% of total
Cancellation Policy Insights for Carlsborg
- The prevailing Airbnb cancellation policy trend in Carlsborg is Strict, used by 36.4% of listings.
- A majority (59.1%) of hosts in Carlsborg utilize Firm or Strict policies, indicating a market where hosts prioritize booking security.
Recommendations for Hosts
- Consider adopting a Strict policy to align with the 36.4% market standard in Carlsborg.
- With 36.4% using Strict terms, this is a viable option in Carlsborg, particularly for high-value properties or during peak demand periods.
- Regularly review your cancellation policy against competitors and market demand shifts in Carlsborg.
Carlsborg STR Booking Lead Time Analysis (2026)
Average Booking Lead Time by Month
Booking Lead Time Insights for Carlsborg
- The overall average booking lead time for vacation rentals in Carlsborg is 40 days.
- Guests book furthest in advance for stays during November (average 68 days), likely coinciding with peak travel demand or local events.
- The shortest booking windows occur for stays in February (average 7 days), indicating more last-minute travel plans during this time.
- Seasonally, Fall (50 days avg.) sees the longest lead times, while Winter (11 days avg.) has the shortest, reflecting typical travel planning cycles.
Recommendations for Hosts
- Use the overall average lead time (40 days) as a baseline for your pricing and availability strategy in Carlsborg.
- For November stays, consider implementing length-of-stay discounts or slightly higher rates for bookings made less than 68 days out to capitalize on advance planning.
- During February, focus on last-minute booking availability and promotions, as guests book with very short notice (7 days avg.).
- Target marketing efforts for the Fall season well in advance (at least 50 days) to capture early planners.
- Monitor your own booking lead times against these Carlsborg averages to identify opportunities for dynamic pricing adjustments.
Popular & Essential Airbnb Amenities in Carlsborg (2026)
Amenity Prevalence
Amenity Insights for Carlsborg
- Essential amenities in Carlsborg that guests expect include: Essentials, Wifi, Smoke alarm, Free parking on premises, Heating, Carbon monoxide alarm, Fire extinguisher, Hangers, Shampoo. Lacking these (any) could significantly impact bookings.
- Popular amenities like Hot water are common but not universal. Offering these can provide a competitive edge.
Recommendations for Hosts
- Ensure your listing includes all essential amenities for Carlsborg: Essentials, Wifi, Smoke alarm, Free parking on premises, Heating, Carbon monoxide alarm, Fire extinguisher, Hangers, Shampoo.
- Prioritize adding missing essentials: Fire extinguisher, Hangers, Shampoo.
- Consider adding popular differentiators like Hot water to increase appeal.
- Highlight unique or less common amenities you offer (e.g., hot tub, dedicated workspace, EV charger) in your listing description and photos.
- Regularly check competitor amenities in Carlsborg to stay competitive.
Carlsborg Airbnb Guest Demographics & Profile Analysis (2026)
Guest Profile Summary for Carlsborg
- The typical guest profile for Airbnb in Carlsborg consists of primarily domestic travelers (90%), often arriving from nearby Seattle, typically belonging to the Post-2000s (Gen Z/Alpha) group (50%), primarily speaking English or Spanish.
- Domestic travelers account for 89.6% of guests.
- Key international markets include United States (89.6%) and Canada (2.9%).
- Top languages spoken are English (65%) followed by Spanish (10.7%).
- A significant demographic segment is the Post-2000s (Gen Z/Alpha) group, representing 50% of guests.
Recommendations for Hosts
- Target domestic marketing efforts towards travelers from Seattle and New York.
- Tailor amenities and listing descriptions to appeal to the dominant Post-2000s (Gen Z/Alpha) demographic (e.g., highlight fast WiFi, smart home features, local guides).
- Highlight unique local experiences or amenities relevant to the primary guest profile.
- Consider seasonal promotions aligned with peak travel times for key origin markets.
Nearby Short-Term Rental Market Comparison
How does the Carlsborg Airbnb market stack up against its neighbors? Compare key performance metrics like average monthly revenue, ADR, and occupancy rates in surrounding areas to understand the broader regional STR landscape.
| Market | Active Properties | Monthly Revenue | Daily Rate | Avg. Occupancy |
|---|---|---|---|---|
| Erlands Point-Kitsap Lake | 12 | $5,285 | $366.41 | 47% |
| Olalla | 13 | $4,868 | $334.79 | 49% |
| Sudden Valley | 63 | $4,821 | $324.44 | 51% |
| Warm Beach | 10 | $4,811 | $319.50 | 43% |
| Woodinville | 35 | $4,409 | $340.44 | 51% |
| Moclips | 108 | $4,391 | $433.53 | 39% |
| Amanda Park | 11 | $4,328 | $447.54 | 40% |
| Friday Harbor | 235 | $4,233 | $420.06 | 43% |
| Eastsound | 269 | $4,153 | $367.43 | 42% |
| Allyn | 21 | $4,114 | $419.46 | 35% |