Brinnon Airbnb Market Analysis 2026: Short Term Rental Data & Vacation Rental Statistics in Washington, United States
Is Airbnb profitable in Brinnon in 2026? Explore comprehensive Airbnb analytics for Brinnon, Washington, United States to uncover income potential. This 2026 STR market report for Brinnon, based on AirROI data from February 2025 to January 2026, reveals key trends in the niche market of 47 active listings.
Whether you're considering an Airbnb investment in Brinnon, optimizing your existing vacation rental, or exploring rental arbitrage opportunities, understanding the Brinnon Airbnb data is crucial. Leveraging the low regulation environment is key to maximizing your short term rental income potential. Let's dive into the specifics.
Key Brinnon Airbnb Performance Metrics Overview
Monthly Airbnb Revenue Variations & Income Potential in Brinnon (2026)
Understanding the monthly revenue variations for Airbnb listings in Brinnon is key to maximizing your short term rental income potential. Seasonality significantly impacts earnings. Our analysis, based on data from the past 12 months, shows that the peak revenue month for STRs in Brinnon is typically July, while February often presents the lowest earnings, highlighting opportunities for strategic pricing adjustments during shoulder and low seasons. Explore the typical Airbnb income in Brinnon across different performance tiers:
- Best-in-class properties (Top 10%) achieve $7,813+ monthly, often utilizing dynamic pricing and superior guest experiences.
- Strong performing properties (Top 25%) earn $5,254 or more, indicating effective management and desirable locations/amenities.
- Typical properties (Median) generate around $3,282 per month, representing the average market performance.
- Entry-level properties (Bottom 25%) see earnings around $1,714, often with potential for optimization.
Average Monthly Airbnb Earnings Trend in Brinnon
Brinnon Airbnb Occupancy Rate Trends (2026)
Maximize your bookings by understanding the Brinnon STR occupancy trends. Seasonal demand shifts significantly influence how often properties are booked. Typically, Julysees the highest demand (peak season occupancy), while January experiences the lowest (low season). Effective strategies, like adjusting minimum stays or offering promotions, can boost occupancy during slower periods. Here's how different property tiers perform in Brinnon:
- Best-in-class properties (Top 10%) achieve 79%+ occupancy, indicating high desirability and potentially optimized availability.
- Strong performing properties (Top 25%) maintain 59% or higher occupancy, suggesting good market fit and guest satisfaction.
- Typical properties (Median) have an occupancy rate around 43%.
- Entry-level properties (Bottom 25%) average 28% occupancy, potentially facing higher vacancy.
Average Monthly Occupancy Rate Trend in Brinnon
Average Daily Rate (ADR) Airbnb Trends in Brinnon (2026)
Effective short term rental pricing strategy in Brinnon involves understanding monthly ADR fluctuations. The Average Daily Rate (ADR) for Airbnb in Brinnon typically peaks in July and dips lowest during February. Leveraging Airbnb dynamic pricing tools or strategies based on this seasonality can significantly boost revenue. Here's a look at the typical nightly rates achieved:
- Best-in-class properties (Top 10%) command rates of $431+ per night, often due to premium features or locations.
- Strong performing properties (Top 25%) achieve nightly rates of $330 or more.
- Typical properties (Median) charge around $251 per night.
- Entry-level properties (Bottom 25%) earn around $159 per night.
Average Daily Rate (ADR) Trend by Month in Brinnon
Get Live Brinnon Market Intelligence 👇

Explore Real-time Analytics
Airbnb Seasonality Analysis & Trends in Brinnon (2026)
Peak Season (July, August, June)
- Revenue averages $6,330 per month
- Occupancy rates average 63.9%
- Daily rates average $315
Shoulder Season
- Revenue averages $3,433 per month
- Occupancy maintains around 41.2%
- Daily rates hold near $275
Low Season (January, February, April)
- Revenue drops to average $2,291 per month
- Occupancy decreases to average 32.9%
- Daily rates adjust to average $253
Seasonality Insights for Brinnon
- The Airbnb seasonality in Brinnon shows highly seasonal trends requiring careful strategy. While the sections above show seasonal averages, it's also insightful to look at the extremes:
- During the high season, the absolute peak month showcases Brinnon's highest earning potential, with monthly revenues capable of climbing to $7,504, occupancy reaching a high of 72.7%, and ADRs peaking at $323.
- Conversely, the slowest single month of the year, typically falling within the low season, marks the market's lowest point. In this month, revenue might dip to $1,828, occupancy could drop to 32.0%, and ADRs may adjust down to $239.
- Understanding both the seasonal averages and these monthly peaks and troughs in revenue, occupancy, and ADR is crucial for maximizing your Airbnb profit potential in Brinnon.
Seasonal Strategies for Maximizing Profit
- Peak Season: Maximize revenue through premium pricing and potentially longer minimum stays. Ensure high availability.
- Low Season: Offer competitive pricing, special promotions (e.g., extended stay discounts), and flexible cancellation policies. Target off-season travelers like remote workers or budget-conscious guests.
- Shoulder Seasons: Implement dynamic pricing that balances peak and low rates. Target weekend travelers or specific events. Offer slightly more flexible terms than peak season.
- Regularly analyze your own performance against these Brinnon seasonality benchmarks and adjust your pricing and availability strategy accordingly.
Best Areas for Airbnb Investment in Brinnon (2026)
Exploring the top neighborhoods for short-term rentals in Brinnon? This section highlights key areas, outlining why they are attractive for hosts and guests, along with notable local attractions. Consider these locations based on your target guest profile and investment strategy.
| Neighborhood / Area | Why Host Here? (Target Guests & Appeal) | Key Attractions & Landmarks |
|---|---|---|
| Brinnon Beach | A beautiful beachfront area perfect for families and outdoor enthusiasts. Offers stunning views of the Hood Canal and easy access to water activities. | Hood Canal, Brinnon Park, Saltwater State Park, Skokomish Indian Tribe Cultural Center, scenic hiking trails |
| Quilcene | Known for its serene natural surroundings and proximity to Olympic National Park. Perfect for travelers looking to explore nature and enjoy peaceful stays. | Olympic National Park, Quilcene National Fish Hatchery, Hood Canal, local oyster farms, scenic river views |
| Hood Canal | A picturesque inlet offering beautiful waterfront properties and access to various water sports. A hotspot for those seeking relaxation and adventure. | Hood Canal Bridge, scuba diving spots, kayaking, fishing, beach access |
| Olympic National Park Entrance | The gateway to one of the U.S.'s most diverse national parks, attracting outdoor lovers and adventurers year-round. | Hurricane Ridge, Hoh Rain Forest, Lake Crescent, Sol Duc Hot Springs, numerous hiking trails |
| Sandy Shores | A quiet community with a charming coastline, Sandy Shores is great for vacationers who desire tranquility and a taste of local life. | local beaches, scenic views, camping areas, nature walks, small shops and cafes |
| Union | This small town offers stunning views of the Olympic Mountains and is a great base for outdoor activities, attracting couples and families. | Harstine Island, Tall Tree Cider, shopping and dining in Union, Marina Park, Biking trails |
| Lilliwaup | A quaint village with easy access to both beaches and forests, ideal for Airbnb guests looking for a mix of coastal and wooded landscapes. | Lilliwaup Creek, nearby beaches, hiking routes, Saltwater State Park, views of the Olympic Mountains |
| Port Ludlow | A beautiful resort town perfect for golfing and water activities. Offers a unique blend of nature and luxury accommodations for guests. | Port Ludlow Golf Club, Ludlow Bay, marina activities, hiking trails, local art galleries |
Understanding Airbnb License Requirements & STR Laws in Brinnon (2026)
While Brinnon, Washington, United States currently shows low STR regulations, specific Airbnb license requirements might still exist or change. Always verify the latest short term rental regulations and Airbnb license requirements directly with local government authorities for Brinnon to ensure full compliance before hosting.
(Source: AirROI data, 2026, finding no licensed listings among those analyzed)
Top Performing Airbnb Properties in Brinnon (2026)
Benchmark your potential! Explore examples of top-performing Airbnb properties in Brinnonbased on Trailing Twelve Month (TTM) revenue. Analyze their characteristics, revenue, occupancy rate, and ADR to understand what drives success in this market.
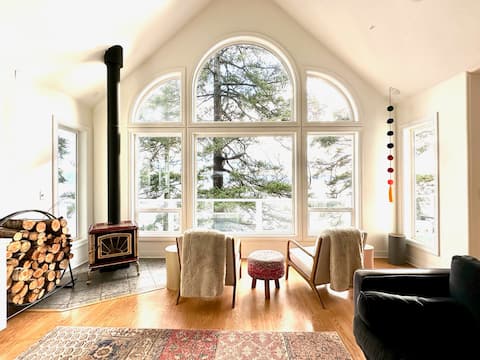
Hood Canal Waterfront Home
Entire Place • 4 bedrooms
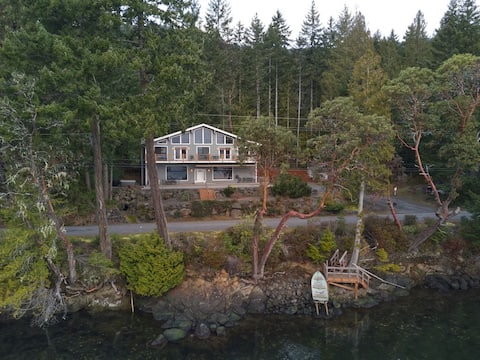
Waterfront Hood Canal-Private Beach-Boat-Kayaks
Entire Place • 5 bedrooms
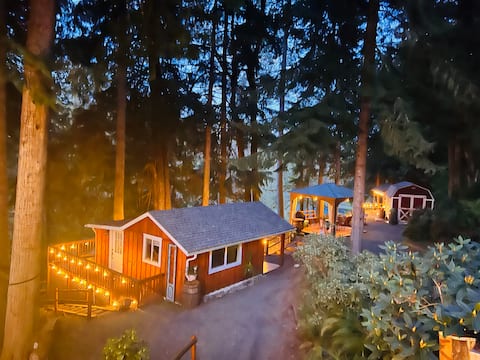
River Retreat w/3 Tiny Cabins
Entire Place • 2 bedrooms

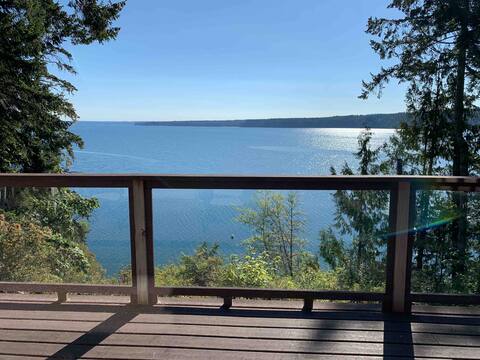
Hood Canal Home w/ Stunning Views & Private Beach
Entire Place • 4 bedrooms
4 BDR waterfront home with a view, scuba site
Entire Place • 4 bedrooms
View/Hot tub/Sauna/Oysters on the Water
Entire Place • 2 bedrooms
Note: Performance varies based on location, size, amenities, seasonality, and management quality. Data reflects the past 12 months.
Top Performing Airbnb Hosts in Brinnon (2026)
Learn from the best! This table showcases top-performing Airbnb hosts in Brinnon based on the number of properties managed and estimated total revenue over the past year. Analyze their scale and performance metrics.
| Host Name | Properties | Grossing Revenue | Stay Reviews | Avg Rating |
|---|---|---|---|---|
| Istay | 3 | $134,326 | 90 | 4.52/5.0 |
| Evolve | 2 | $126,887 | 233 | 4.82/5.0 |
| Jean | 1 | $112,859 | 41 | 4.90/5.0 |
| Janet | 1 | $92,737 | 75 | 4.85/5.0 |
| Jeff | 1 | $89,511 | 138 | 5.00/5.0 |
| Vacation Homes On Hood Canal | 3 | $80,269 | 39 | 4.81/5.0 |
| Katherine | 2 | $79,442 | 243 | 4.92/5.0 |
| Ellen | 2 | $79,182 | 235 | 4.79/5.0 |
| Leslie | 1 | $79,077 | 64 | 4.98/5.0 |
| Beverly | 1 | $74,179 | 509 | 4.86/5.0 |
Analyzing the strategies of top hosts, such as their property selection, pricing, and guest communication, can offer valuable lessons for optimizing your own Airbnb operations in Brinnon.
Dive Deeper: Advanced Brinnon STR Market Data (2026)
Ready to unlock more insights? AirROI provides access to advanced metrics and comprehensive Airbnb data for Brinnon. Explore detailed analytics beyond this report to refine your investment strategy, optimize pricing, and maximize your vacation rental profits.
Explore Advanced MetricsBrinnon Short-Term Rental Market Composition (2026): Property & Room Types
Room Type Distribution
Property Type Distribution
Market Composition Insights for Brinnon
- The Brinnon Airbnb market composition is heavily skewed towards Entire Home/Apt listings, which make up 97.9% of the 47 active rentals. This indicates strong guest preference for privacy and space.
- Looking at the property type distribution in Brinnon, House properties are the most common (68.1%), reflecting the local real estate landscape.
- Houses represent a significant 68.1% portion, catering likely to families or larger groups.
- Smaller segments like others, apartment/condo, unique stays, hotel/boutique (combined 10.6%) offer potential for unique stay experiences.
Brinnon Airbnb Room Capacity Analysis (2026): Bedroom Distribution
Distribution of Listings by Number of Bedrooms
Room Capacity Insights for Brinnon
- The dominant room capacity in Brinnon is 3 bedrooms listings, making up 27.7% of the market. This suggests a strong demand for properties suitable for families or small groups.
- Together, 3 bedrooms and 2 bedrooms properties represent 51.1% of the active Airbnb listings in Brinnon, indicating a high concentration in these sizes.
- A significant 53.3% of listings offer 3+ bedrooms, catering to larger groups and families seeking more space in Brinnon.
Brinnon Vacation Rental Guest Capacity Trends (2026)
Distribution of Listings by Guest Capacity
Guest Capacity Insights for Brinnon
- The most common guest capacity trend in Brinnon vacation rentals is listings accommodating 6 guests (38.3%). This suggests the primary traveler segment is likely larger groups.
- Properties designed for 6 guests and 8+ guests dominate the Brinnon STR market, accounting for 61.7% of listings.
- 66.0% of properties accommodate 6+ guests, serving the market segment for larger families or group travel in Brinnon.
- On average, properties in Brinnon are equipped to host 5.5 guests.
Brinnon Airbnb Booking Patterns (2026): Available vs. Booked Days
Available Days Distribution
Booked Days Distribution
Booking Pattern Insights for Brinnon
- The most common availability pattern in Brinnon falls within the 181-270 days range, representing 40.4% of listings. This suggests many properties have significant open periods on their calendars.
- Approximately 74.4% of listings show high availability (181+ days open annually), indicating potential for increased bookings or specific owner usage patterns.
- For booked days, the 91-180 days range is most frequent in Brinnon (38.3%), reflecting common guest stay durations or potential owner blocking patterns.
- A notable 27.7% of properties secure long booking periods (181+ days booked per year), highlighting successful long-term rental strategies or significant owner usage.
Brinnon Airbnb Minimum Stay Requirements Analysis
Distribution of Listings by Minimum Night Requirement
1 Night
13 listings
27.7% of total
2 Nights
15 listings
31.9% of total
3 Nights
5 listings
10.6% of total
30+ Nights
14 listings
29.8% of total
Key Insights
- The most prevalent minimum stay requirement in Brinnon is 2 Nights, adopted by 31.9% of listings. This highlights the market's preference for shorter, flexible bookings.
- A significant segment (29.8%) caters to monthly stays (30+ nights) in Brinnon, pointing to opportunities in the extended-stay market.
Recommendations
- Align with the market by considering a 2 Nights minimum stay, as 31.9% of Brinnon hosts use this setting.
- If feasible, allowing 1-night stays, especially midweek or during low season, could capture last-minute bookings, as only 27.7% currently do.
- Explore offering discounts for stays of 30+ nights to attract the 29.8% of the market seeking extended stays.
- Adjust minimum nights based on seasonality ��– potentially shorter during low season and longer during peak demand periods in Brinnon.
Brinnon Airbnb Cancellation Policy Trends Analysis (2026)
Limited
1 listings
2.1% of total
Super Strict 30 Days
3 listings
6.4% of total
Flexible
6 listings
12.8% of total
Moderate
15 listings
31.9% of total
Firm
16 listings
34% of total
Strict
6 listings
12.8% of total
Cancellation Policy Insights for Brinnon
- The prevailing Airbnb cancellation policy trend in Brinnon is Firm, used by 34% of listings.
- There's a relatively balanced mix between guest-friendly (44.7%) and stricter (46.8%) policies, offering choices for different guest needs.
Recommendations for Hosts
- Consider adopting a Firm policy to align with the 34% market standard in Brinnon.
- Using a Strict policy might deter some guests, as only 12.8% of listings use it. Evaluate if potential revenue protection outweighs possible lower booking rates.
- Regularly review your cancellation policy against competitors and market demand shifts in Brinnon.
Brinnon STR Booking Lead Time Analysis (2026)
Average Booking Lead Time by Month
Booking Lead Time Insights for Brinnon
- The overall average booking lead time for vacation rentals in Brinnon is 45 days.
- Guests book furthest in advance for stays during July (average 71 days), likely coinciding with peak travel demand or local events.
- The shortest booking windows occur for stays in October (average 29 days), indicating more last-minute travel plans during this time.
- Seasonally, Summer (63 days avg.) sees the longest lead times, while Winter (34 days avg.) has the shortest, reflecting typical travel planning cycles.
Recommendations for Hosts
- Use the overall average lead time (45 days) as a baseline for your pricing and availability strategy in Brinnon.
- For July stays, consider implementing length-of-stay discounts or slightly higher rates for bookings made less than 71 days out to capitalize on advance planning.
- Target marketing efforts for the Summer season well in advance (at least 63 days) to capture early planners.
- Monitor your own booking lead times against these Brinnon averages to identify opportunities for dynamic pricing adjustments.
Popular & Essential Airbnb Amenities in Brinnon (2026)
Amenity Prevalence
Amenity Insights for Brinnon
- Essential amenities in Brinnon that guests expect include: Wifi, Free parking on premises, Smoke alarm. Lacking these (any) could significantly impact bookings.
- Popular amenities like TV, Kitchen, Fire extinguisher are common but not universal. Offering these can provide a competitive edge.
Recommendations for Hosts
- Ensure your listing includes all essential amenities for Brinnon: Wifi, Free parking on premises, Smoke alarm.
- Prioritize adding missing essentials: Free parking on premises, Smoke alarm.
- Consider adding popular differentiators like TV or Kitchen to increase appeal.
- Highlight unique or less common amenities you offer (e.g., hot tub, dedicated workspace, EV charger) in your listing description and photos.
- Regularly check competitor amenities in Brinnon to stay competitive.
Brinnon Airbnb Guest Demographics & Profile Analysis (2026)
Guest Profile Summary for Brinnon
- The typical guest profile for Airbnb in Brinnon consists of primarily domestic travelers (96%), often arriving from nearby Seattle, typically belonging to the Post-2000s (Gen Z/Alpha) group (50%), primarily speaking English or Spanish.
- Domestic travelers account for 95.8% of guests.
- Key international markets include United States (95.8%) and Canada (1.3%).
- Top languages spoken are English (70.6%) followed by Spanish (10.5%).
- A significant demographic segment is the Post-2000s (Gen Z/Alpha) group, representing 50% of guests.
Recommendations for Hosts
- Target domestic marketing efforts towards travelers from Seattle and Portland.
- Tailor amenities and listing descriptions to appeal to the dominant Post-2000s (Gen Z/Alpha) demographic (e.g., highlight fast WiFi, smart home features, local guides).
- Highlight unique local experiences or amenities relevant to the primary guest profile.
- Consider seasonal promotions aligned with peak travel times for key origin markets.
Nearby Short-Term Rental Market Comparison
How does the Brinnon Airbnb market stack up against its neighbors? Compare key performance metrics like average monthly revenue, ADR, and occupancy rates in surrounding areas to understand the broader regional STR landscape.
| Market | Active Properties | Monthly Revenue | Daily Rate | Avg. Occupancy |
|---|---|---|---|---|
| Erlands Point-Kitsap Lake | 12 | $5,285 | $366.41 | 47% |
| North Bend | 51 | $5,073 | $352.89 | 57% |
| Olalla | 13 | $4,868 | $334.79 | 49% |
| Sudden Valley | 63 | $4,821 | $324.44 | 51% |
| Warm Beach | 10 | $4,811 | $319.50 | 43% |
| Verlot | 11 | $4,608 | $314.03 | 49% |
| Canyon Creek | 13 | $4,568 | $301.22 | 51% |
| Ronald | 153 | $4,567 | $456.22 | 35% |
| Sultan | 17 | $4,436 | $300.44 | 51% |
| Woodinville | 35 | $4,409 | $340.44 | 51% |