Bremerton Airbnb Market Analysis 2026: Short Term Rental Data & Vacation Rental Statistics in Washington, United States
Is Airbnb profitable in Bremerton in 2026? Explore comprehensive Airbnb analytics for Bremerton, Washington, United States to uncover income potential. This 2026 STR market report for Bremerton, based on AirROI data from February 2025 to January 2026, reveals key trends in the niche market of 177 active listings.
Whether you're considering an Airbnb investment in Bremerton, optimizing your existing vacation rental, or exploring rental arbitrage opportunities, understanding the Bremerton Airbnb data is crucial. Leveraging the low regulation environment is key to maximizing your short term rental income potential. Let's dive into the specifics.
Key Bremerton Airbnb Performance Metrics Overview
Monthly Airbnb Revenue Variations & Income Potential in Bremerton (2026)
Understanding the monthly revenue variations for Airbnb listings in Bremerton is key to maximizing your short term rental income potential. Seasonality significantly impacts earnings. Our analysis, based on data from the past 12 months, shows that the peak revenue month for STRs in Bremerton is typically July, while February often presents the lowest earnings, highlighting opportunities for strategic pricing adjustments during shoulder and low seasons. Explore the typical Airbnb income in Bremerton across different performance tiers:
- Best-in-class properties (Top 10%) achieve $7,515+ monthly, often utilizing dynamic pricing and superior guest experiences.
- Strong performing properties (Top 25%) earn $4,793 or more, indicating effective management and desirable locations/amenities.
- Typical properties (Median) generate around $2,908 per month, representing the average market performance.
- Entry-level properties (Bottom 25%) see earnings around $1,516, often with potential for optimization.
Average Monthly Airbnb Earnings Trend in Bremerton
Bremerton Airbnb Occupancy Rate Trends (2026)
Maximize your bookings by understanding the Bremerton STR occupancy trends. Seasonal demand shifts significantly influence how often properties are booked. Typically, Julysees the highest demand (peak season occupancy), while April experiences the lowest (low season). Effective strategies, like adjusting minimum stays or offering promotions, can boost occupancy during slower periods. Here's how different property tiers perform in Bremerton:
- Best-in-class properties (Top 10%) achieve 85%+ occupancy, indicating high desirability and potentially optimized availability.
- Strong performing properties (Top 25%) maintain 73% or higher occupancy, suggesting good market fit and guest satisfaction.
- Typical properties (Median) have an occupancy rate around 55%.
- Entry-level properties (Bottom 25%) average 32% occupancy, potentially facing higher vacancy.
Average Monthly Occupancy Rate Trend in Bremerton
Average Daily Rate (ADR) Airbnb Trends in Bremerton (2026)
Effective short term rental pricing strategy in Bremerton involves understanding monthly ADR fluctuations. The Average Daily Rate (ADR) for Airbnb in Bremerton typically peaks in September and dips lowest during February. Leveraging Airbnb dynamic pricing tools or strategies based on this seasonality can significantly boost revenue. Here's a look at the typical nightly rates achieved:
- Best-in-class properties (Top 10%) command rates of $416+ per night, often due to premium features or locations.
- Strong performing properties (Top 25%) achieve nightly rates of $273 or more.
- Typical properties (Median) charge around $168 per night.
- Entry-level properties (Bottom 25%) earn around $109 per night.
Average Daily Rate (ADR) Trend by Month in Bremerton
Get Live Bremerton Market Intelligence 👇

Explore Real-time Analytics
Airbnb Seasonality Analysis & Trends in Bremerton (2026)
Peak Season (July, August, June)
- Revenue averages $5,455 per month
- Occupancy rates average 66.4%
- Daily rates average $232
Shoulder Season
- Revenue averages $3,357 per month
- Occupancy maintains around 49.6%
- Daily rates hold near $221
Low Season (January, February, April)
- Revenue drops to average $2,518 per month
- Occupancy decreases to average 44.1%
- Daily rates adjust to average $201
Seasonality Insights for Bremerton
- The Airbnb seasonality in Bremerton shows highly seasonal trends requiring careful strategy. While the sections above show seasonal averages, it's also insightful to look at the extremes:
- During the high season, the absolute peak month showcases Bremerton's highest earning potential, with monthly revenues capable of climbing to $6,013, occupancy reaching a high of 72.9%, and ADRs peaking at $241.
- Conversely, the slowest single month of the year, typically falling within the low season, marks the market's lowest point. In this month, revenue might dip to $2,242, occupancy could drop to 42.8%, and ADRs may adjust down to $190.
- Understanding both the seasonal averages and these monthly peaks and troughs in revenue, occupancy, and ADR is crucial for maximizing your Airbnb profit potential in Bremerton.
Seasonal Strategies for Maximizing Profit
- Peak Season: Maximize revenue through premium pricing and potentially longer minimum stays. Ensure high availability.
- Low Season: Offer competitive pricing, special promotions (e.g., extended stay discounts), and flexible cancellation policies. Target off-season travelers like remote workers or budget-conscious guests.
- Shoulder Seasons: Implement dynamic pricing that balances peak and low rates. Target weekend travelers or specific events. Offer slightly more flexible terms than peak season.
- Regularly analyze your own performance against these Bremerton seasonality benchmarks and adjust your pricing and availability strategy accordingly.
Best Areas for Airbnb Investment in Bremerton (2026)
Exploring the top neighborhoods for short-term rentals in Bremerton? This section highlights key areas, outlining why they are attractive for hosts and guests, along with notable local attractions. Consider these locations based on your target guest profile and investment strategy.
| Neighborhood / Area | Why Host Here? (Target Guests & Appeal) | Key Attractions & Landmarks |
|---|---|---|
| Downtown Bremerton | The heart of Bremerton with easy access to shops, restaurants, and ferry services. Ideal for both business travelers and tourists exploring Kitsap County. | Bremerton Ferry Terminal, USS Turner Joy, Bremerton Arts District, Harborside Fountain Park, Bremerton Boardwalk |
| East Bremerton | Suburban area with family-friendly neighborhoods and proximity to amenities. Attractive for longer stays and families visiting the area. | Parks and Recreation areas, Restaurants and Shopping Centers, Kitsap Mall, Ridgeview Park, Navy Yard City |
| Manette | Historic waterfront neighborhood with charming homes and a strong local community. Offers a quieter experience close to nature and water activities. | Manette Bridge, Manette Park, Waterfront Park, Local shops and cafes, Scenic views of Puget Sound |
| West Bremerton | Emerging area with affordable properties and proximity to downtown. Captures a mix of local charm and access to amenities. | Kitsap Conference Center, Olympic College, Local festivals, Harborside Commons, Easy access to parks |
| Port Orchard | Just a short ferry ride away, great for guests who want to explore the area. Offers waterfront views and local charm. | Port Orchard Marina, Veterans Memorial Park, Local shops and eateries, Waterfront sidewalk, Kitsap History Museum |
| Silverdale | Growing shopping area with many amenities and outdoor activities. Popular among families and weekend travelers. | Silverdale Waterfront Park, Kitsap Mall, Clear Creek Trail, Local parks, Restaurants and cafes |
| Poulsbo | Known as 'Little Norway,' this charming town is filled with history, shops, and dining options. Great for visitors looking to explore unique cultural experiences. | Poulsbo Marina, Viking-themed shops, Fish Park, Local bakeries, Outdoor festivals |
| Bremerton Parks | Many parks in Bremerton offer outdoor activities and family-friendly options. Perfect for those looking for a getaway with access to nature. | Kitsap Lake Park, Ella Fitzgerald Park, Harborview Park, Waterfront activities, Nature trails |
Understanding Airbnb License Requirements & STR Laws in Bremerton (2026)
While Bremerton, Washington, United States currently shows low STR regulations, specific Airbnb license requirements might still exist or change. Always verify the latest short term rental regulations and Airbnb license requirements directly with local government authorities for Bremerton to ensure full compliance before hosting.
(Source: AirROI data, 2026, finding no licensed listings among those analyzed)
Top Performing Airbnb Properties in Bremerton (2026)
Benchmark your potential! Explore examples of top-performing Airbnb properties in Bremertonbased on Trailing Twelve Month (TTM) revenue. Analyze their characteristics, revenue, occupancy rate, and ADR to understand what drives success in this market.

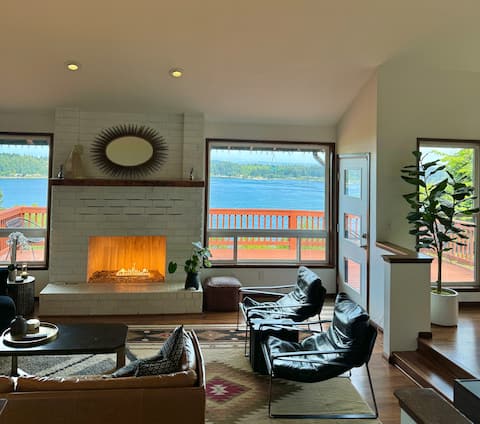
The Kitsap Lakefront Oasis
Entire Place • 5 bedrooms
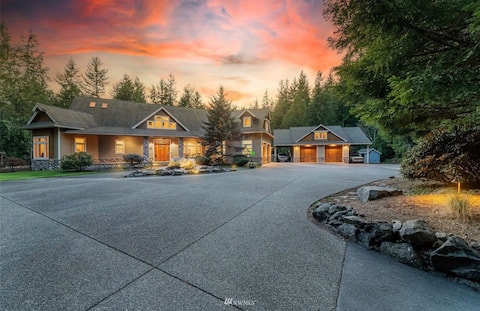
5 king bed, cliff-house, w/ 2 hot tubs & sauna!
Entire Place • 5 bedrooms
Timber Lodge at Wildcat Creek
Entire Place • 4 bedrooms
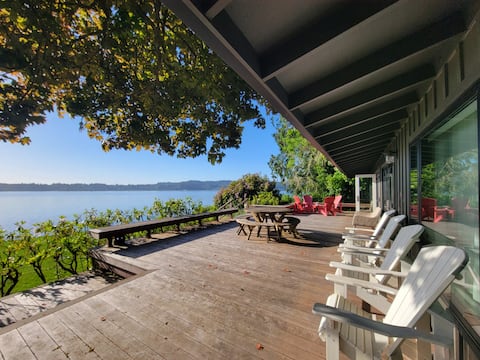
Enetai Beach House w/ dock and Hot tub
Entire Place • 4 bedrooms

The Rockland Woods Lodge, Lake & Land
Entire Place • 4 bedrooms
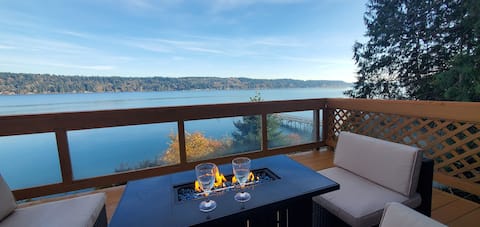
Luxe Waterfront | Pvt Beach, Views & Game Room
Entire Place • 4 bedrooms
Note: Performance varies based on location, size, amenities, seasonality, and management quality. Data reflects the past 12 months.
Top Performing Airbnb Hosts in Bremerton (2026)
Learn from the best! This table showcases top-performing Airbnb hosts in Bremerton based on the number of properties managed and estimated total revenue over the past year. Analyze their scale and performance metrics.
| Host Name | Properties | Grossing Revenue | Stay Reviews | Avg Rating |
|---|---|---|---|---|
| Melissa | 15 | $906,501 | 1519 | 4.95/5.0 |
| Crystal And Jason | 6 | $297,119 | 213 | 4.95/5.0 |
| Charnie | 2 | $224,324 | 108 | 4.96/5.0 |
| Shawn | 2 | $194,043 | 468 | 4.96/5.0 |
| Evolve | 5 | $190,689 | 203 | 4.86/5.0 |
| Kiel | 1 | $153,608 | 120 | 4.93/5.0 |
| Patrick | 3 | $135,293 | 335 | 4.90/5.0 |
| Wade | 1 | $130,564 | 98 | 4.97/5.0 |
| Marie | 3 | $127,519 | 148 | 4.80/5.0 |
| Jiaqi @ Yirental | 2 | $124,144 | 17 | 4.74/5.0 |
Analyzing the strategies of top hosts, such as their property selection, pricing, and guest communication, can offer valuable lessons for optimizing your own Airbnb operations in Bremerton.
Dive Deeper: Advanced Bremerton STR Market Data (2026)
Ready to unlock more insights? AirROI provides access to advanced metrics and comprehensive Airbnb data for Bremerton. Explore detailed analytics beyond this report to refine your investment strategy, optimize pricing, and maximize your vacation rental profits.
Explore Advanced MetricsBremerton Short-Term Rental Market Composition (2026): Property & Room Types
Room Type Distribution
Property Type Distribution
Market Composition Insights for Bremerton
- The Bremerton Airbnb market composition is heavily skewed towards Entire Home/Apt listings, which make up 88.7% of the 177 active rentals. This indicates strong guest preference for privacy and space.
- Looking at the property type distribution in Bremerton, House properties are the most common (76.3%), reflecting the local real estate landscape.
- Houses represent a significant 76.3% portion, catering likely to families or larger groups.
- Smaller segments like hotel/boutique, outdoor/unique, unique stays (combined 6.2%) offer potential for unique stay experiences.
Bremerton Airbnb Room Capacity Analysis (2026): Bedroom Distribution
Distribution of Listings by Number of Bedrooms
Room Capacity Insights for Bremerton
- The dominant room capacity in Bremerton is 1 bedroom listings, making up 26.6% of the market. This suggests a strong demand for properties suitable for couples or solo travelers.
- Together, 1 bedroom and 2 bedrooms properties represent 52.0% of the active Airbnb listings in Bremerton, indicating a high concentration in these sizes.
- A significant 35.0% of listings offer 3+ bedrooms, catering to larger groups and families seeking more space in Bremerton.
Bremerton Vacation Rental Guest Capacity Trends (2026)
Distribution of Listings by Guest Capacity
Guest Capacity Insights for Bremerton
- The most common guest capacity trend in Bremerton vacation rentals is listings accommodating 8+ guests (20.3%). This suggests the primary traveler segment is likely larger groups.
- Properties designed for 8+ guests and 4 guests dominate the Bremerton STR market, accounting for 38.9% of listings.
- 40.6% of properties accommodate 6+ guests, serving the market segment for larger families or group travel in Bremerton.
- On average, properties in Bremerton are equipped to host 4.4 guests.
Bremerton Airbnb Booking Patterns (2026): Available vs. Booked Days
Available Days Distribution
Booked Days Distribution
Booking Pattern Insights for Bremerton
- The most common availability pattern in Bremerton falls within the 181-270 days range, representing 32.2% of listings. This suggests many properties have significant open periods on their calendars.
- Approximately 62.1% of listings show high availability (181+ days open annually), indicating potential for increased bookings or specific owner usage patterns.
- For booked days, the 181-270 days range is most frequent in Bremerton (31.6%), reflecting common guest stay durations or potential owner blocking patterns.
- A notable 39.5% of properties secure long booking periods (181+ days booked per year), highlighting successful long-term rental strategies or significant owner usage.
Bremerton Airbnb Minimum Stay Requirements Analysis
Distribution of Listings by Minimum Night Requirement
1 Night
22 listings
12.4% of total
2 Nights
57 listings
32.2% of total
3 Nights
19 listings
10.7% of total
4-6 Nights
13 listings
7.3% of total
7-29 Nights
11 listings
6.2% of total
30+ Nights
55 listings
31.1% of total
Key Insights
- The most prevalent minimum stay requirement in Bremerton is 2 Nights, adopted by 32.2% of listings. This highlights the market's preference for shorter, flexible bookings.
- A significant segment (31.1%) caters to monthly stays (30+ nights) in Bremerton, pointing to opportunities in the extended-stay market.
Recommendations
- Align with the market by considering a 2 Nights minimum stay, as 32.2% of Bremerton hosts use this setting.
- If feasible, allowing 1-night stays, especially midweek or during low season, could capture last-minute bookings, as only 12.4% currently do.
- A 2-night minimum appears standard (32.2%). Consider this for weekends or peak periods.
- Explore offering discounts for stays of 30+ nights to attract the 31.1% of the market seeking extended stays.
- Adjust minimum nights based on seasonality – potentially shorter during low season and longer during peak demand periods in Bremerton.
Bremerton Airbnb Cancellation Policy Trends Analysis (2026)
Super Strict 60 Days
2 listings
1.1% of total
Super Strict 30 Days
3 listings
1.7% of total
Limited
6 listings
3.4% of total
Flexible
25 listings
14.1% of total
Moderate
56 listings
31.6% of total
Firm
64 listings
36.2% of total
Strict
21 listings
11.9% of total
Cancellation Policy Insights for Bremerton
- The prevailing Airbnb cancellation policy trend in Bremerton is Firm, used by 36.2% of listings.
- There's a relatively balanced mix between guest-friendly (45.7%) and stricter (48.1%) policies, offering choices for different guest needs.
Recommendations for Hosts
- Consider adopting a Firm policy to align with the 36.2% market standard in Bremerton.
- Using a Strict policy might deter some guests, as only 11.9% of listings use it. Evaluate if potential revenue protection outweighs possible lower booking rates.
- Regularly review your cancellation policy against competitors and market demand shifts in Bremerton.
Bremerton STR Booking Lead Time Analysis (2026)
Average Booking Lead Time by Month
Booking Lead Time Insights for Bremerton
- The overall average booking lead time for vacation rentals in Bremerton is 40 days.
- Guests book furthest in advance for stays during July (average 63 days), likely coinciding with peak travel demand or local events.
- The shortest booking windows occur for stays in March (average 25 days), indicating more last-minute travel plans during this time.
- Seasonally, Summer (58 days avg.) sees the longest lead times, while Spring (30 days avg.) has the shortest, reflecting typical travel planning cycles.
Recommendations for Hosts
- Use the overall average lead time (40 days) as a baseline for your pricing and availability strategy in Bremerton.
- For July stays, consider implementing length-of-stay discounts or slightly higher rates for bookings made less than 63 days out to capitalize on advance planning.
- Target marketing efforts for the Summer season well in advance (at least 58 days) to capture early planners.
- Monitor your own booking lead times against these Bremerton averages to identify opportunities for dynamic pricing adjustments.
Popular & Essential Airbnb Amenities in Bremerton (2026)
Amenity Prevalence
Amenity Insights for Bremerton
- Essential amenities in Bremerton that guests expect include: Smoke alarm, Wifi, Heating, Carbon monoxide alarm, Coffee maker, Dishes and silverware, Hot water. Lacking these (any) could significantly impact bookings.
- Popular amenities like Refrigerator, Free parking on premises, Kitchen are common but not universal. Offering these can provide a competitive edge.
Recommendations for Hosts
- Ensure your listing includes all essential amenities for Bremerton: Smoke alarm, Wifi, Heating, Carbon monoxide alarm, Coffee maker, Dishes and silverware, Hot water.
- Prioritize adding missing essentials: Wifi, Heating, Carbon monoxide alarm, Coffee maker, Dishes and silverware, Hot water.
- Consider adding popular differentiators like Refrigerator or Free parking on premises to increase appeal.
- Highlight unique or less common amenities you offer (e.g., hot tub, dedicated workspace, EV charger) in your listing description and photos.
- Regularly check competitor amenities in Bremerton to stay competitive.
Bremerton Airbnb Guest Demographics & Profile Analysis (2026)
Guest Profile Summary for Bremerton
- The typical guest profile for Airbnb in Bremerton consists of primarily domestic travelers (97%), often arriving from nearby Seattle, typically belonging to the Post-2000s (Gen Z/Alpha) group (50%), primarily speaking English or Spanish.
- Domestic travelers account for 96.8% of guests.
- Key international markets include United States (96.8%) and Canada (0.9%).
- Top languages spoken are English (69.7%) followed by Spanish (12.9%).
- A significant demographic segment is the Post-2000s (Gen Z/Alpha) group, representing 50% of guests.
Recommendations for Hosts
- Target domestic marketing efforts towards travelers from Seattle and Portland.
- Tailor amenities and listing descriptions to appeal to the dominant Post-2000s (Gen Z/Alpha) demographic (e.g., highlight fast WiFi, smart home features, local guides).
- Highlight unique local experiences or amenities relevant to the primary guest profile.
- Consider seasonal promotions aligned with peak travel times for key origin markets.
Nearby Short-Term Rental Market Comparison
How does the Bremerton Airbnb market stack up against its neighbors? Compare key performance metrics like average monthly revenue, ADR, and occupancy rates in surrounding areas to understand the broader regional STR landscape.
| Market | Active Properties | Monthly Revenue | Daily Rate | Avg. Occupancy |
|---|---|---|---|---|
| Erlands Point-Kitsap Lake | 12 | $5,285 | $366.41 | 47% |
| North Bend | 51 | $5,073 | $352.89 | 57% |
| Olalla | 13 | $4,868 | $334.79 | 49% |
| Sudden Valley | 63 | $4,821 | $324.44 | 51% |
| Warm Beach | 10 | $4,811 | $319.50 | 43% |
| Verlot | 11 | $4,608 | $314.03 | 49% |
| Canyon Creek | 13 | $4,568 | $301.22 | 51% |
| Ronald | 153 | $4,567 | $456.22 | 35% |
| Sultan | 17 | $4,436 | $300.44 | 51% |
| Woodinville | 35 | $4,409 | $340.44 | 51% |