Beaver Airbnb Market Analysis 2026: Short Term Rental Data & Vacation Rental Statistics in Washington, United States
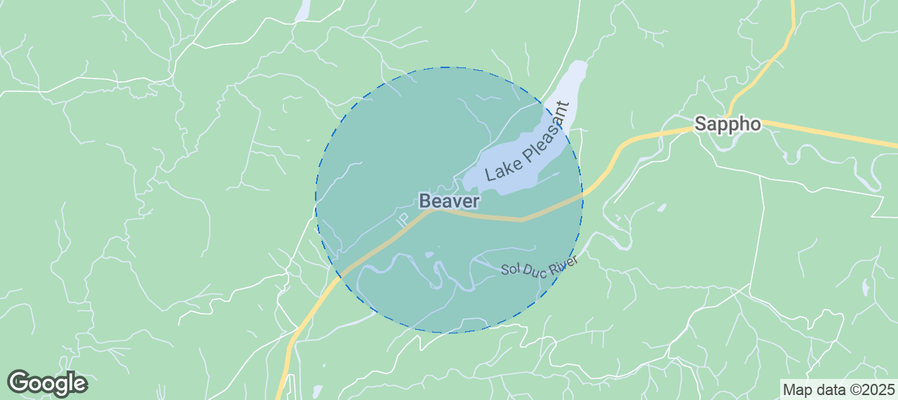
Is Airbnb profitable in Beaver in 2026? Explore comprehensive Airbnb analytics for Beaver, Washington, United States to uncover income potential. This 2026 STR market report for Beaver, based on AirROI data from February 2025 to January 2026, reveals key trends in the niche market of 24 active listings.
Whether you're considering an Airbnb investment in Beaver, optimizing your existing vacation rental, or exploring rental arbitrage opportunities, understanding the Beaver Airbnb data is crucial. Leveraging the low regulation environment is key to maximizing your short term rental income potential. Let's dive into the specifics.
Key Beaver Airbnb Performance Metrics Overview
Monthly Airbnb Revenue Variations & Income Potential in Beaver (2026)
Understanding the monthly revenue variations for Airbnb listings in Beaver is key to maximizing your short term rental income potential. Seasonality significantly impacts earnings. Our analysis, based on data from the past 12 months, shows that the peak revenue month for STRs in Beaver is typically July, while February often presents the lowest earnings, highlighting opportunities for strategic pricing adjustments during shoulder and low seasons. Explore the typical Airbnb income in Beaver across different performance tiers:
- Best-in-class properties (Top 10%) achieve $8,338+ monthly, often utilizing dynamic pricing and superior guest experiences.
- Strong performing properties (Top 25%) earn $6,389 or more, indicating effective management and desirable locations/amenities.
- Typical properties (Median) generate around $3,594 per month, representing the average market performance.
- Entry-level properties (Bottom 25%) see earnings around $2,543, often with potential for optimization.
Average Monthly Airbnb Earnings Trend in Beaver
Beaver Airbnb Occupancy Rate Trends (2026)
Maximize your bookings by understanding the Beaver STR occupancy trends. Seasonal demand shifts significantly influence how often properties are booked. Typically, Julysees the highest demand (peak season occupancy), while January experiences the lowest (low season). Effective strategies, like adjusting minimum stays or offering promotions, can boost occupancy during slower periods. Here's how different property tiers perform in Beaver:
- Best-in-class properties (Top 10%) achieve 80%+ occupancy, indicating high desirability and potentially optimized availability.
- Strong performing properties (Top 25%) maintain 75% or higher occupancy, suggesting good market fit and guest satisfaction.
- Typical properties (Median) have an occupancy rate around 59%.
- Entry-level properties (Bottom 25%) average 42% occupancy, potentially facing higher vacancy.
Average Monthly Occupancy Rate Trend in Beaver
Average Daily Rate (ADR) Airbnb Trends in Beaver (2026)
Effective short term rental pricing strategy in Beaver involves understanding monthly ADR fluctuations. The Average Daily Rate (ADR) for Airbnb in Beaver typically peaks in July and dips lowest during February. Leveraging Airbnb dynamic pricing tools or strategies based on this seasonality can significantly boost revenue. Here's a look at the typical nightly rates achieved:
- Best-in-class properties (Top 10%) command rates of $488+ per night, often due to premium features or locations.
- Strong performing properties (Top 25%) achieve nightly rates of $379 or more.
- Typical properties (Median) charge around $282 per night.
- Entry-level properties (Bottom 25%) earn around $153 per night.
Average Daily Rate (ADR) Trend by Month in Beaver
Get Live Beaver Market Intelligence 👇
Explore Real-time Analytics
Airbnb Seasonality Analysis & Trends in Beaver (2026)
Peak Season (July, August, June)
- Revenue averages $8,190 per month
- Occupancy rates average 79.5%
- Daily rates average $322
Shoulder Season
- Revenue averages $4,158 per month
- Occupancy maintains around 54.4%
- Daily rates hold near $286
Low Season (January, February, December)
- Revenue drops to average $2,179 per month
- Occupancy decreases to average 35.3%
- Daily rates adjust to average $267
Seasonality Insights for Beaver
- The Airbnb seasonality in Beaver shows highly seasonal trends requiring careful strategy. While the sections above show seasonal averages, it's also insightful to look at the extremes:
- During the high season, the absolute peak month showcases Beaver's highest earning potential, with monthly revenues capable of climbing to $8,623, occupancy reaching a high of 82.2%, and ADRs peaking at $326.
- Conversely, the slowest single month of the year, typically falling within the low season, marks the market's lowest point. In this month, revenue might dip to $2,083, occupancy could drop to 33.6%, and ADRs may adjust down to $262.
- Understanding both the seasonal averages and these monthly peaks and troughs in revenue, occupancy, and ADR is crucial for maximizing your Airbnb profit potential in Beaver.
Seasonal Strategies for Maximizing Profit
- Peak Season: Maximize revenue through premium pricing and potentially longer minimum stays. Ensure high availability.
- Low Season: Offer competitive pricing, special promotions (e.g., extended stay discounts), and flexible cancellation policies. Target off-season travelers like remote workers or budget-conscious guests.
- Shoulder Seasons: Implement dynamic pricing that balances peak and low rates. Target weekend travelers or specific events. Offer slightly more flexible terms than peak season.
- Regularly analyze your own performance against these Beaver seasonality benchmarks and adjust your pricing and availability strategy accordingly.
Best Areas for Airbnb Investment in Beaver (2026)
Exploring the top neighborhoods for short-term rentals in Beaver? This section highlights key areas, outlining why they are attractive for hosts and guests, along with notable local attractions. Consider these locations based on your target guest profile and investment strategy.
| Neighborhood / Area | Why Host Here? (Target Guests & Appeal) | Key Attractions & Landmarks |
|---|---|---|
| Lake Merwin | Beautiful reservoir surrounded by forest and mountains, perfect for nature lovers and outdoor activities. Attracts visitors for boating, fishing, and hiking. | Lake Merwin, Merwin Park, Hiking Trails, Wildlife Viewing, Fishing Spots |
| Mount St. Helens National Park | A stunning national park offering unique volcanic landscapes and recreational activities. Highly visited by tourists interested in geology and nature. | Mount St. Helens, Visitor Center, Hiking Trails, Lava Canyon, Spirit Lake |
| Ryderwood | A quaint, small town atmosphere with charming homes and a tight-knit community. Ideal for travelers seeking a peaceful retreat. | Ryderwood Community, Local Parks, Nature Trails, Seventh Day Adventist Church |
| Coweeman River | Known for its serene river views and fishing opportunities. Attracts those looking for tranquility and outdoor recreation. | Coweeman River, Fishing Spots, Canoeing, Hiking Trails |
| Woodland | A growing community located near I-5 with easy access to both Portland and Seattle. Suitable for visitors needing urban amenities with rural charm. | Woodland Park Zoo, Outdoor Festivals, Fishing, Community Events |
| Vancouver | Close to Beaver and offers urban amenities, dining, and cultural activities. A desirable spot for all types of visitors. | Fort Vancouver, Waterfront Park, Vancouver Mall, Dining and Shopping |
| Columbia River Gorge | Renowned for its breathtaking landscapes, waterfalls, and hiking trails, a magnet for outdoor enthusiasts and sightseers. | Multnomah Falls, Hood River, Hiking Trails, Scenic Views |
| Gifford Pinchot National Forest | Offers expansive wilderness areas and recreational activities. Ideal for visitors looking to connect with nature and enjoy camping and hiking. | Camping Areas, Hiking Trails, Fishing Spots, Scenic Drives |
Understanding Airbnb License Requirements & STR Laws in Beaver (2026)
While Beaver, Washington, United States currently shows low STR regulations, specific Airbnb license requirements might still exist or change. Always verify the latest short term rental regulations and Airbnb license requirements directly with local government authorities for Beaver to ensure full compliance before hosting.
(Source: AirROI data, 2026, finding no licensed listings among those analyzed)
Top Performing Airbnb Properties in Beaver (2026)
Benchmark your potential! Explore examples of top-performing Airbnb properties in Beaverbased on Trailing Twelve Month (TTM) revenue. Analyze their characteristics, revenue, occupancy rate, and ADR to understand what drives success in this market.

Solduc Riverfront tranquil log Cabin Retreat
Entire Place • 3 bedrooms

Charming Pacific N.W. Retreat W/Lake Front Living
Entire Place • 4 bedrooms
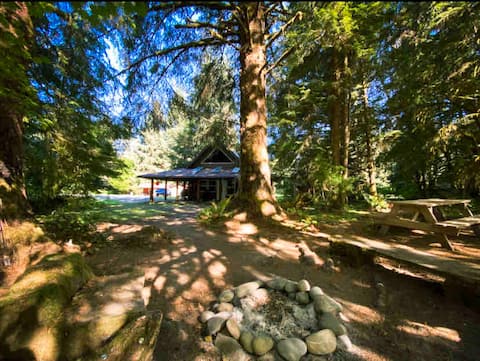
Sol Duc Fishing Cabin
Entire Place • 3 bedrooms
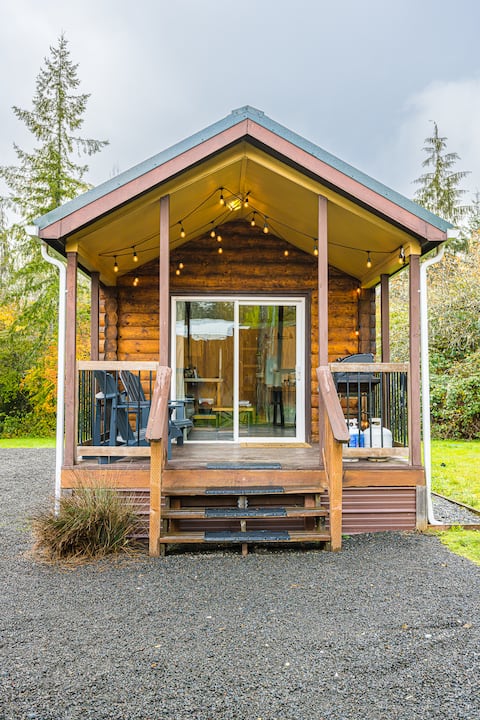
Beaver's Den: Private & Cozy Experience
Entire Place • 2 bedrooms
Pleasant Meadows Riverside
Entire Place • 2 bedrooms
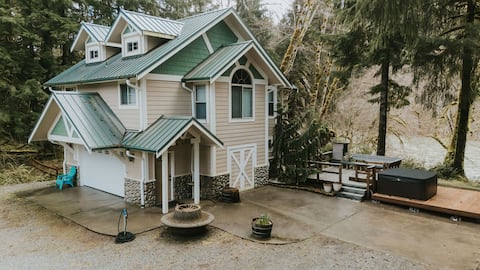
perfect 3brm winter getaway w/ Hot tub & riverview
Entire Place • 3 bedrooms
Note: Performance varies based on location, size, amenities, seasonality, and management quality. Data reflects the past 12 months.
Top Performing Airbnb Hosts in Beaver (2026)
Learn from the best! This table showcases top-performing Airbnb hosts in Beaver based on the number of properties managed and estimated total revenue over the past year. Analyze their scale and performance metrics.
| Host Name | Properties | Grossing Revenue | Stay Reviews | Avg Rating |
|---|---|---|---|---|
| Erin | 2 | $165,461 | 107 | 4.98/5.0 |
| Kiley | 2 | $136,041 | 427 | 4.82/5.0 |
| Rachel | 2 | $125,667 | 329 | 4.93/5.0 |
| Laura | 1 | $88,683 | 132 | 4.97/5.0 |
| Christian Davis | 1 | $74,702 | 133 | 4.95/5.0 |
| Sarah | 2 | $72,120 | 271 | 4.90/5.0 |
| Jenna | 2 | $70,644 | 188 | 4.87/5.0 |
| Collin | 3 | $69,875 | 52 | 4.91/5.0 |
| Chela | 1 | $63,330 | 47 | 4.94/5.0 |
| Greg And Dana | 1 | $62,777 | 35 | 4.97/5.0 |
Analyzing the strategies of top hosts, such as their property selection, pricing, and guest communication, can offer valuable lessons for optimizing your own Airbnb operations in Beaver.
Dive Deeper: Advanced Beaver STR Market Data (2026)
Ready to unlock more insights? AirROI provides access to advanced metrics and comprehensive Airbnb data for Beaver. Explore detailed analytics beyond this report to refine your investment strategy, optimize pricing, and maximize your vacation rental profits.
Explore Advanced MetricsBeaver Short-Term Rental Market Composition (2026): Property & Room Types
Room Type Distribution
Property Type Distribution
Market Composition Insights for Beaver
- The Beaver Airbnb market composition is heavily skewed towards Entire Home/Apt listings, which make up 100% of the 24 active rentals. This indicates strong guest preference for privacy and space.
- Looking at the property type distribution in Beaver, Outdoor/Unique properties are the most common (54.2%), reflecting the local real estate landscape.
- Houses represent a significant 37.5% portion, catering likely to families or larger groups.
- The presence of 8.3% Hotel/Boutique listings indicates integration with traditional hospitality.
Beaver Airbnb Room Capacity Analysis (2026): Bedroom Distribution
Distribution of Listings by Number of Bedrooms
Room Capacity Insights for Beaver
- The dominant room capacity in Beaver is 2 bedrooms listings, making up 33.3% of the market. This suggests a strong demand for properties suitable for couples or solo travelers.
- Together, 2 bedrooms and 1 bedroom properties represent 62.5% of the active Airbnb listings in Beaver, indicating a high concentration in these sizes.
- A significant 33.3% of listings offer 3+ bedrooms, catering to larger groups and families seeking more space in Beaver.
Beaver Vacation Rental Guest Capacity Trends (2026)
Distribution of Listings by Guest Capacity
Guest Capacity Insights for Beaver
- The most common guest capacity trend in Beaver vacation rentals is listings accommodating 6 guests (29.2%). This suggests the primary traveler segment is likely larger groups.
- Properties designed for 6 guests and 2 guests dominate the Beaver STR market, accounting for 50.0% of listings.
- 54.2% of properties accommodate 6+ guests, serving the market segment for larger families or group travel in Beaver.
- On average, properties in Beaver are equipped to host 5.2 guests.
Beaver Airbnb Booking Patterns (2026): Available vs. Booked Days
Available Days Distribution
Booked Days Distribution
Booking Pattern Insights for Beaver
- The most common availability pattern in Beaver falls within the 181-270 days range, representing 41.7% of listings. This suggests many properties have significant open periods on their calendars.
- Approximately 66.7% of listings show high availability (181+ days open annually), indicating potential for increased bookings or specific owner usage patterns.
- For booked days, the 91-180 days range is most frequent in Beaver (41.7%), reflecting common guest stay durations or potential owner blocking patterns.
- A notable 37.5% of properties secure long booking periods (181+ days booked per year), highlighting successful long-term rental strategies or significant owner usage.
Beaver Airbnb Minimum Stay Requirements Analysis
Distribution of Listings by Minimum Night Requirement
1 Night
8 listings
33.3% of total
2 Nights
5 listings
20.8% of total
3 Nights
1 listings
4.2% of total
30+ Nights
10 listings
41.7% of total
Key Insights
- The most prevalent minimum stay requirement in Beaver is 30+ Nights, adopted by 41.7% of listings. This highlights the market's preference for longer commitments.
- A significant segment (41.7%) caters to monthly stays (30+ nights) in Beaver, pointing to opportunities in the extended-stay market.
Recommendations
- Align with the market by considering a 30+ Nights minimum stay, as 41.7% of Beaver hosts use this setting.
- Explore offering discounts for stays of 30+ nights to attract the 41.7% of the market seeking extended stays.
- Adjust minimum nights based on seasonality – potentially shorter during low season and longer during peak demand periods in Beaver.
Beaver Airbnb Cancellation Policy Trends Analysis (2026)
Super Strict 30 Days
3 listings
12.5% of total
Flexible
6 listings
25% of total
Moderate
9 listings
37.5% of total
Firm
5 listings
20.8% of total
Strict
1 listings
4.2% of total
Cancellation Policy Insights for Beaver
- The prevailing Airbnb cancellation policy trend in Beaver is Moderate, used by 37.5% of listings.
- There's a relatively balanced mix between guest-friendly (62.5%) and stricter (25.0%) policies, offering choices for different guest needs.
- Strict cancellation policies are quite rare (4.2%), potentially making listings with this policy less competitive unless justified by high demand or property type.
Recommendations for Hosts
- Consider adopting a Moderate policy to align with the 37.5% market standard in Beaver.
- Using a Strict policy might deter some guests, as only 4.2% of listings use it. Evaluate if potential revenue protection outweighs possible lower booking rates.
- Regularly review your cancellation policy against competitors and market demand shifts in Beaver.
Beaver STR Booking Lead Time Analysis (2026)
Average Booking Lead Time by Month
Booking Lead Time Insights for Beaver
- The overall average booking lead time for vacation rentals in Beaver is 53 days.
- Guests book furthest in advance for stays during July (average 81 days), likely coinciding with peak travel demand or local events.
- The shortest booking windows occur for stays in January (average 31 days), indicating more last-minute travel plans during this time.
- Seasonally, Summer (72 days avg.) sees the longest lead times, while Winter (33 days avg.) has the shortest, reflecting typical travel planning cycles.
Recommendations for Hosts
- Use the overall average lead time (53 days) as a baseline for your pricing and availability strategy in Beaver.
- For July stays, consider implementing length-of-stay discounts or slightly higher rates for bookings made less than 81 days out to capitalize on advance planning.
- Target marketing efforts for the Summer season well in advance (at least 72 days) to capture early planners.
- Monitor your own booking lead times against these Beaver averages to identify opportunities for dynamic pricing adjustments.
Popular & Essential Airbnb Amenities in Beaver (2026)
Amenity Prevalence
Amenity Insights for Beaver
- Essential amenities in Beaver that guests expect include: Heating, Dishes and silverware, Smoke alarm, Coffee maker, Kitchen, Hot water, Free parking on premises, Cooking basics. Lacking these (any) could significantly impact bookings.
- Popular amenities like Fire extinguisher, Coffee are common but not universal. Offering these can provide a competitive edge.
Recommendations for Hosts
- Ensure your listing includes all essential amenities for Beaver: Heating, Dishes and silverware, Smoke alarm, Coffee maker, Kitchen, Hot water, Free parking on premises, Cooking basics.
- Prioritize adding missing essentials: Kitchen, Hot water, Free parking on premises, Cooking basics.
- Consider adding popular differentiators like Fire extinguisher or Coffee to increase appeal.
- Highlight unique or less common amenities you offer (e.g., hot tub, dedicated workspace, EV charger) in your listing description and photos.
- Regularly check competitor amenities in Beaver to stay competitive.
Beaver Airbnb Guest Demographics & Profile Analysis (2026)
Guest Profile Summary for Beaver
- The typical guest profile for Airbnb in Beaver consists of primarily domestic travelers (93%), often arriving from nearby Seattle, typically belonging to the Post-2000s (Gen Z/Alpha) group (50%), primarily speaking English or Spanish.
- Domestic travelers account for 92.6% of guests.
- Key international markets include United States (92.6%) and United Kingdom (1.2%).
- Top languages spoken are English (65.4%) followed by Spanish (8.8%).
- A significant demographic segment is the Post-2000s (Gen Z/Alpha) group, representing 50% of guests.
Recommendations for Hosts
- Target domestic marketing efforts towards travelers from Seattle and New York.
- Tailor amenities and listing descriptions to appeal to the dominant Post-2000s (Gen Z/Alpha) demographic (e.g., highlight fast WiFi, smart home features, local guides).
- Highlight unique local experiences or amenities relevant to the primary guest profile.
- Consider seasonal promotions aligned with peak travel times for key origin markets.
Nearby Short-Term Rental Market Comparison
How does the Beaver Airbnb market stack up against its neighbors? Compare key performance metrics like average monthly revenue, ADR, and occupancy rates in surrounding areas to understand the broader regional STR landscape.
| Market | Active Properties | Monthly Revenue | Daily Rate | Avg. Occupancy |
|---|---|---|---|---|
| Tofino | 326 | $5,228 | $303.37 | 57% |
| Moclips | 108 | $4,391 | $433.53 | 39% |
| Amanda Park | 11 | $4,328 | $447.54 | 40% |
| Friday Harbor | 235 | $4,233 | $420.06 | 43% |
| Ocean City | 10 | $4,024 | $281.20 | 47% |
| Port Angeles | 685 | $3,855 | $281.12 | 51% |
| Seabrook | 302 | $3,843 | $438.32 | 33% |
| Ucluelet | 353 | $3,624 | $232.91 | 53% |
| Bowen Island Municipality | 118 | $3,607 | $237.73 | 59% |
| Clallam Bay | 12 | $3,306 | $241.10 | 56% |