Auburn Airbnb Market Analysis 2026: Short Term Rental Data & Vacation Rental Statistics in Washington, United States
Is Airbnb profitable in Auburn in 2026? Explore comprehensive Airbnb analytics for Auburn, Washington, United States to uncover income potential. This 2026 STR market report for Auburn, based on AirROI data from February 2025 to January 2026, reveals key trends in the niche market of 72 active listings.
Whether you're considering an Airbnb investment in Auburn, optimizing your existing vacation rental, or exploring rental arbitrage opportunities, understanding the Auburn Airbnb data is crucial. Leveraging the low regulation environment is key to maximizing your short term rental income potential. Let's dive into the specifics.
Key Auburn Airbnb Performance Metrics Overview
Monthly Airbnb Revenue Variations & Income Potential in Auburn (2026)
Understanding the monthly revenue variations for Airbnb listings in Auburn is key to maximizing your short term rental income potential. Seasonality significantly impacts earnings. Our analysis, based on data from the past 12 months, shows that the peak revenue month for STRs in Auburn is typically July, while January often presents the lowest earnings, highlighting opportunities for strategic pricing adjustments during shoulder and low seasons. Explore the typical Airbnb income in Auburn across different performance tiers:
- Best-in-class properties (Top 10%) achieve $8,345+ monthly, often utilizing dynamic pricing and superior guest experiences.
- Strong performing properties (Top 25%) earn $4,801 or more, indicating effective management and desirable locations/amenities.
- Typical properties (Median) generate around $2,661 per month, representing the average market performance.
- Entry-level properties (Bottom 25%) see earnings around $1,102, often with potential for optimization.
Average Monthly Airbnb Earnings Trend in Auburn
Auburn Airbnb Occupancy Rate Trends (2026)
Maximize your bookings by understanding the Auburn STR occupancy trends. Seasonal demand shifts significantly influence how often properties are booked. Typically, Julysees the highest demand (peak season occupancy), while January experiences the lowest (low season). Effective strategies, like adjusting minimum stays or offering promotions, can boost occupancy during slower periods. Here's how different property tiers perform in Auburn:
- Best-in-class properties (Top 10%) achieve 85%+ occupancy, indicating high desirability and potentially optimized availability.
- Strong performing properties (Top 25%) maintain 70% or higher occupancy, suggesting good market fit and guest satisfaction.
- Typical properties (Median) have an occupancy rate around 47%.
- Entry-level properties (Bottom 25%) average 25% occupancy, potentially facing higher vacancy.
Average Monthly Occupancy Rate Trend in Auburn
Average Daily Rate (ADR) Airbnb Trends in Auburn (2026)
Effective short term rental pricing strategy in Auburn involves understanding monthly ADR fluctuations. The Average Daily Rate (ADR) for Airbnb in Auburn typically peaks in June and dips lowest during January. Leveraging Airbnb dynamic pricing tools or strategies based on this seasonality can significantly boost revenue. Here's a look at the typical nightly rates achieved:
- Best-in-class properties (Top 10%) command rates of $498+ per night, often due to premium features or locations.
- Strong performing properties (Top 25%) achieve nightly rates of $281 or more.
- Typical properties (Median) charge around $145 per night.
- Entry-level properties (Bottom 25%) earn around $78 per night.
Average Daily Rate (ADR) Trend by Month in Auburn
Get Live Auburn Market Intelligence 👇

Explore Real-time Analytics
Airbnb Seasonality Analysis & Trends in Auburn (2026)
Peak Season (July, June, August)
- Revenue averages $4,953 per month
- Occupancy rates average 57.9%
- Daily rates average $246
Shoulder Season
- Revenue averages $3,380 per month
- Occupancy maintains around 47.9%
- Daily rates hold near $224
Low Season (January, April, November)
- Revenue drops to average $2,726 per month
- Occupancy decreases to average 37.2%
- Daily rates adjust to average $219
Seasonality Insights for Auburn
- The Airbnb seasonality in Auburn shows moderate seasonality with distinct peak and low periods. While the sections above show seasonal averages, it's also insightful to look at the extremes:
- During the high season, the absolute peak month showcases Auburn's highest earning potential, with monthly revenues capable of climbing to $5,135, occupancy reaching a high of 61.2%, and ADRs peaking at $248.
- Conversely, the slowest single month of the year, typically falling within the low season, marks the market's lowest point. In this month, revenue might dip to $2,627, occupancy could drop to 34.1%, and ADRs may adjust down to $215.
- Understanding both the seasonal averages and these monthly peaks and troughs in revenue, occupancy, and ADR is crucial for maximizing your Airbnb profit potential in Auburn.
Seasonal Strategies for Maximizing Profit
- Peak Season: Maximize revenue through premium pricing and potentially longer minimum stays. Ensure high availability.
- Low Season: Offer competitive pricing, special promotions (e.g., extended stay discounts), and flexible cancellation policies. Target off-season travelers like remote workers or budget-conscious guests.
- Shoulder Seasons: Implement dynamic pricing that balances peak and low rates. Target weekend travelers or specific events. Offer slightly more flexible terms than peak season.
- Regularly analyze your own performance against these Auburn seasonality benchmarks and adjust your pricing and availability strategy accordingly.
Best Areas for Airbnb Investment in Auburn (2026)
Exploring the top neighborhoods for short-term rentals in Auburn? This section highlights key areas, outlining why they are attractive for hosts and guests, along with notable local attractions. Consider these locations based on your target guest profile and investment strategy.
| Neighborhood / Area | Why Host Here? (Target Guests & Appeal) | Key Attractions & Landmarks |
|---|---|---|
| Downtown Auburn | The heart of the city, Downtown Auburn features a variety of shops, eateries, and entertainment options, making it ideal for those wanting to experience local culture and community events. | Auburn Performing Arts Center, White River Valley Museum, The Outlet Collection Seattle, Auburn Municipal Park, Game Farm Park |
| Lake Tapps | A beautiful area known for its lake and outdoor recreation, attracting families and visitors looking for a peaceful retreat by the water. | Lake Tapps Park, Lakeside Beach, boating and fishing activities, picnic areas, scenic walking trails |
| West Hill | A neighborhood with picturesque views and proximity to nature, perfect for outdoor enthusiasts and families looking for a nice suburban environment. | Green River Gorge, Wildlife viewing, Outdoor sports facilities, Parks and trails, Close to shopping areas |
| Auburn Valley | Offers a mix of residential charm and easy access to outdoor activities, this area appeals to those who appreciate nature and community. | Auburn Valley Park, Riverside Park, Walking and biking trails, Playgrounds, Picnic areas |
| Auburn Supermall Area | Home to one of the largest malls in the area, attracting shoppers and visitors who enjoy retail and entertainment, making it a lucrative location for short-term rentals. | The Outlet Collection Seattle, Cinema, Various restaurants and cafes, Shopping amenities, Family entertainment centers |
| Graham | A growing suburban area near Auburn that offers a family-friendly atmosphere and proximity to outdoor activities, appealing to visitors looking for a quieter stay. | Jackson Lake, Heritage Park, Graham Community Park, Picnic areas, Nature walks |
| Pacific | Just a short drive from Auburn, this small city offers a peaceful setting with a sense of community while being close to attractions in Auburn. | Pacific Community Center, West Valley High School, Parks and sports fields, Local shops and eateries, Easy access to larger cities |
| Federal Way | Nearby Federal Way offers urban conveniences and attractions, catering to guests who want a mix of city life and outdoor escapades. | Wild Waves Theme Park, Dash Point State Park, The Commons at Federal Way, Federal Way Aquatic Center, Local dining and shopping options |
Understanding Airbnb License Requirements & STR Laws in Auburn (2026)
While Auburn, Washington, United States currently shows low STR regulations, specific Airbnb license requirements might still exist or change. Always verify the latest short term rental regulations and Airbnb license requirements directly with local government authorities for Auburn to ensure full compliance before hosting.
(Source: AirROI data, 2026, based on 1% licensed listings)
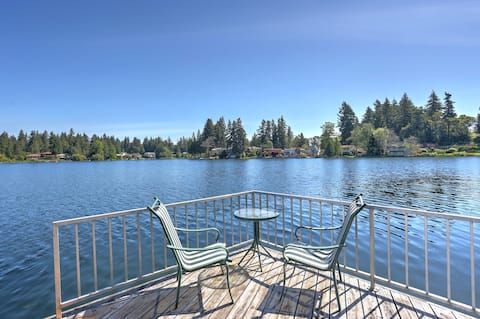
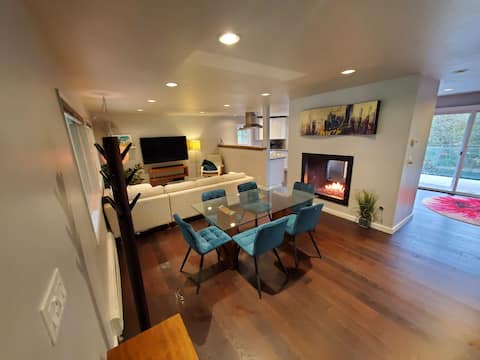
Top Performing Airbnb Properties in Auburn (2026)
Benchmark your potential! Explore examples of top-performing Airbnb properties in Auburnbased on Trailing Twelve Month (TTM) revenue. Analyze their characteristics, revenue, occupancy rate, and ADR to understand what drives success in this market.

Large Home on 2acres In the City
Entire Place • 5 bedrooms
Lake Waterfront “DUO” Homes / Seattle / Tacoma
Entire Place • 6 bedrooms
The Cove on Lake Killarney Full Home
Entire Place • 3 bedrooms
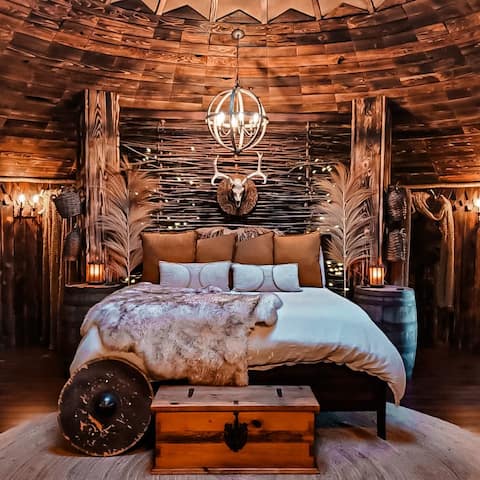
Viking Luxury Hygge at The Jarl's Yurt & Spa
Entire Place • 1 bedroom

Stunning Mt Rainier View House, hot tub, fire pit.
Entire Place • 3 bedrooms

Water Front Private Ranch
Entire Place • 4 bedrooms
Note: Performance varies based on location, size, amenities, seasonality, and management quality. Data reflects the past 12 months.
Top Performing Airbnb Hosts in Auburn (2026)
Learn from the best! This table showcases top-performing Airbnb hosts in Auburn based on the number of properties managed and estimated total revenue over the past year. Analyze their scale and performance metrics.
| Host Name | Properties | Grossing Revenue | Stay Reviews | Avg Rating |
|---|---|---|---|---|
| Alex | 3 | $261,021 | 235 | 4.88/5.0 |
| Manjinder | 1 | $184,501 | 67 | 5.00/5.0 |
| Evolve | 5 | $163,424 | 62 | 4.59/5.0 |
| Ruth | 2 | $135,373 | 240 | 4.97/5.0 |
| Gene | 1 | $119,676 | 90 | 4.97/5.0 |
| Douglas | 1 | $99,069 | 217 | 4.98/5.0 |
| Qing | 1 | $75,141 | 68 | 4.84/5.0 |
| Elena | 1 | $68,557 | 29 | 4.86/5.0 |
| Steven | 1 | $68,359 | 13 | 5.00/5.0 |
| Allen Lu | 1 | $63,796 | 25 | 4.96/5.0 |
Analyzing the strategies of top hosts, such as their property selection, pricing, and guest communication, can offer valuable lessons for optimizing your own Airbnb operations in Auburn.
Dive Deeper: Advanced Auburn STR Market Data (2026)
Ready to unlock more insights? AirROI provides access to advanced metrics and comprehensive Airbnb data for Auburn. Explore detailed analytics beyond this report to refine your investment strategy, optimize pricing, and maximize your vacation rental profits.
Explore Advanced MetricsAuburn Short-Term Rental Market Composition (2026): Property & Room Types
Room Type Distribution
Property Type Distribution
Market Composition Insights for Auburn
- The Auburn Airbnb market composition is heavily skewed towards Entire Home/Apt listings, which make up 70.8% of the 72 active rentals. This indicates strong guest preference for privacy and space.
- Looking at the property type distribution in Auburn, House properties are the most common (77.8%), reflecting the local real estate landscape.
- Houses represent a significant 77.8% portion, catering likely to families or larger groups.
- Smaller segments like others, hotel/boutique, unique stays (combined 5.6%) offer potential for unique stay experiences.
Auburn Airbnb Room Capacity Analysis (2026): Bedroom Distribution
Distribution of Listings by Number of Bedrooms
Room Capacity Insights for Auburn
- The dominant room capacity in Auburn is 1 bedroom listings, making up 23.6% of the market. This suggests a strong demand for properties suitable for couples or solo travelers.
- Together, 1 bedroom and 3 bedrooms properties represent 44.4% of the active Airbnb listings in Auburn, indicating a high concentration in these sizes.
- A significant 37.4% of listings offer 3+ bedrooms, catering to larger groups and families seeking more space in Auburn.
Auburn Vacation Rental Guest Capacity Trends (2026)
Distribution of Listings by Guest Capacity
Guest Capacity Insights for Auburn
- The most common guest capacity trend in Auburn vacation rentals is listings accommodating 6 guests (20.8%). This suggests the primary traveler segment is likely larger groups.
- Properties designed for 6 guests and 8+ guests dominate the Auburn STR market, accounting for 41.6% of listings.
- 41.6% of properties accommodate 6+ guests, serving the market segment for larger families or group travel in Auburn.
- On average, properties in Auburn are equipped to host 3.8 guests.
Auburn Airbnb Booking Patterns (2026): Available vs. Booked Days
Available Days Distribution
Booked Days Distribution
Booking Pattern Insights for Auburn
- The most common availability pattern in Auburn falls within the 271-366 days range, representing 47.2% of listings. This suggests many properties have significant open periods on their calendars.
- Approximately 70.8% of listings show high availability (181+ days open annually), indicating potential for increased bookings or specific owner usage patterns.
- For booked days, the 31-90 days range is most frequent in Auburn (25%), reflecting common guest stay durations or potential owner blocking patterns.
- A notable 33.3% of properties secure long booking periods (181+ days booked per year), highlighting successful long-term rental strategies or significant owner usage.
Auburn Airbnb Minimum Stay Requirements Analysis
Distribution of Listings by Minimum Night Requirement
1 Night
21 listings
29.2% of total
2 Nights
21 listings
29.2% of total
3 Nights
3 listings
4.2% of total
4-6 Nights
2 listings
2.8% of total
7-29 Nights
9 listings
12.5% of total
30+ Nights
16 listings
22.2% of total
Key Insights
- The most prevalent minimum stay requirement in Auburn is 1 Night, adopted by 29.2% of listings. This highlights the market's preference for shorter, flexible bookings.
- A significant segment (22.2%) caters to monthly stays (30+ nights) in Auburn, pointing to opportunities in the extended-stay market.
Recommendations
- Align with the market by considering a 1 Night minimum stay, as 29.2% of Auburn hosts use this setting.
- If feasible, allowing 1-night stays, especially midweek or during low season, could capture last-minute bookings, as only 29.2% currently do.
- Explore offering discounts for stays of 30+ nights to attract the 22.2% of the market seeking extended stays.
- Adjust minimum nights based on seasonality – potentially shorter during low season and longer during peak demand periods in Auburn.
Auburn Airbnb Cancellation Policy Trends Analysis (2026)
Limited
2 listings
2.8% of total
Flexible
15 listings
21.1% of total
Moderate
24 listings
33.8% of total
Firm
21 listings
29.6% of total
Strict
9 listings
12.7% of total
Cancellation Policy Insights for Auburn
- The prevailing Airbnb cancellation policy trend in Auburn is Moderate, used by 33.8% of listings.
- There's a relatively balanced mix between guest-friendly (54.9%) and stricter (42.3%) policies, offering choices for different guest needs.
Recommendations for Hosts
- Consider adopting a Moderate policy to align with the 33.8% market standard in Auburn.
- Using a Strict policy might deter some guests, as only 12.7% of listings use it. Evaluate if potential revenue protection outweighs possible lower booking rates.
- Regularly review your cancellation policy against competitors and market demand shifts in Auburn.
Auburn STR Booking Lead Time Analysis (2026)
Average Booking Lead Time by Month
Booking Lead Time Insights for Auburn
- The overall average booking lead time for vacation rentals in Auburn is 36 days.
- Guests book furthest in advance for stays during August (average 64 days), likely coinciding with peak travel demand or local events.
- The shortest booking windows occur for stays in January (average 24 days), indicating more last-minute travel plans during this time.
- Seasonally, Summer (61 days avg.) sees the longest lead times, while Winter (33 days avg.) has the shortest, reflecting typical travel planning cycles.
Recommendations for Hosts
- Use the overall average lead time (36 days) as a baseline for your pricing and availability strategy in Auburn.
- For August stays, consider implementing length-of-stay discounts or slightly higher rates for bookings made less than 64 days out to capitalize on advance planning.
- Target marketing efforts for the Summer season well in advance (at least 61 days) to capture early planners.
- Monitor your own booking lead times against these Auburn averages to identify opportunities for dynamic pricing adjustments.
Popular & Essential Airbnb Amenities in Auburn (2026)
Amenity Prevalence
Amenity Insights for Auburn
- Essential amenities in Auburn that guests expect include: Wifi, Smoke alarm, Hot water. Lacking these (any) could significantly impact bookings.
- Popular amenities like Carbon monoxide alarm, Heating, Free parking on premises are common but not universal. Offering these can provide a competitive edge.
Recommendations for Hosts
- Ensure your listing includes all essential amenities for Auburn: Wifi, Smoke alarm, Hot water.
- Prioritize adding missing essentials: Wifi, Smoke alarm, Hot water.
- Consider adding popular differentiators like Carbon monoxide alarm or Heating to increase appeal.
- Highlight unique or less common amenities you offer (e.g., hot tub, dedicated workspace, EV charger) in your listing description and photos.
- Regularly check competitor amenities in Auburn to stay competitive.
Auburn Airbnb Guest Demographics & Profile Analysis (2026)
Guest Profile Summary for Auburn
- The typical guest profile for Airbnb in Auburn consists of primarily domestic travelers (93%), often arriving from nearby Seattle, typically belonging to the Post-2000s (Gen Z/Alpha) group (50%), primarily speaking English or Spanish.
- Domestic travelers account for 92.9% of guests.
- Key international markets include United States (92.9%) and Canada (3.3%).
- Top languages spoken are English (67.1%) followed by Spanish (11.1%).
- A significant demographic segment is the Post-2000s (Gen Z/Alpha) group, representing 50% of guests.
Recommendations for Hosts
- Target domestic marketing efforts towards travelers from Seattle and Portland.
- Tailor amenities and listing descriptions to appeal to the dominant Post-2000s (Gen Z/Alpha) demographic (e.g., highlight fast WiFi, smart home features, local guides).
- Highlight unique local experiences or amenities relevant to the primary guest profile.
- Consider seasonal promotions aligned with peak travel times for key origin markets.
Nearby Short-Term Rental Market Comparison
How does the Auburn Airbnb market stack up against its neighbors? Compare key performance metrics like average monthly revenue, ADR, and occupancy rates in surrounding areas to understand the broader regional STR landscape.
| Market | Active Properties | Monthly Revenue | Daily Rate | Avg. Occupancy |
|---|---|---|---|---|
| Erlands Point-Kitsap Lake | 12 | $5,285 | $366.41 | 47% |
| North Bend | 51 | $5,073 | $352.89 | 57% |
| Olalla | 13 | $4,868 | $334.79 | 49% |
| Sudden Valley | 63 | $4,821 | $324.44 | 51% |
| Warm Beach | 10 | $4,811 | $319.50 | 43% |
| Verlot | 11 | $4,608 | $314.03 | 49% |
| Canyon Creek | 13 | $4,568 | $301.22 | 51% |
| Ronald | 153 | $4,567 | $456.22 | 35% |
| Sultan | 17 | $4,436 | $300.44 | 51% |
| Woodinville | 35 | $4,409 | $340.44 | 51% |