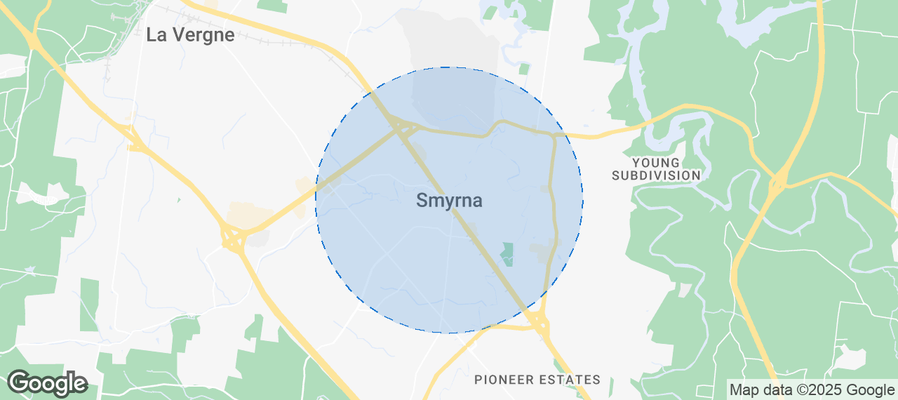
Smyrna Airbnb Market Analysis 2026: Short Term Rental Data & Vacation Rental Statistics in Tennessee, United States
Is Airbnb profitable in Smyrna in 2026? Explore comprehensive Airbnb analytics for Smyrna, Tennessee, United States to uncover income potential. This 2026 STR market report for Smyrna, based on AirROI data from February 2025 to January 2026, reveals key trends in the niche market of 22 active listings.
Whether you're considering an Airbnb investment in Smyrna, optimizing your existing vacation rental, or exploring rental arbitrage opportunities, understanding the Smyrna Airbnb data is crucial. Leveraging the low regulation environment is key to maximizing your short term rental income potential. Let's dive into the specifics.
Key Smyrna Airbnb Performance Metrics Overview
Monthly Airbnb Revenue Variations & Income Potential in Smyrna (2026)
Understanding the monthly revenue variations for Airbnb listings in Smyrna is key to maximizing your short term rental income potential. Seasonality significantly impacts earnings. Our analysis, based on data from the past 12 months, shows that the peak revenue month for STRs in Smyrna is typically June, while January often presents the lowest earnings, highlighting opportunities for strategic pricing adjustments during shoulder and low seasons. Explore the typical Airbnb income in Smyrna across different performance tiers:
- Best-in-class properties (Top 10%) achieve $7,291+ monthly, often utilizing dynamic pricing and superior guest experiences.
- Strong performing properties (Top 25%) earn $4,249 or more, indicating effective management and desirable locations/amenities.
- Typical properties (Median) generate around $2,318 per month, representing the average market performance.
- Entry-level properties (Bottom 25%) see earnings around $1,481, often with potential for optimization.
Average Monthly Airbnb Earnings Trend in Smyrna
Smyrna Airbnb Occupancy Rate Trends (2026)
Maximize your bookings by understanding the Smyrna STR occupancy trends. Seasonal demand shifts significantly influence how often properties are booked. Typically, Marchsees the highest demand (peak season occupancy), while January experiences the lowest (low season). Effective strategies, like adjusting minimum stays or offering promotions, can boost occupancy during slower periods. Here's how different property tiers perform in Smyrna:
- Best-in-class properties (Top 10%) achieve 76%+ occupancy, indicating high desirability and potentially optimized availability.
- Strong performing properties (Top 25%) maintain 62% or higher occupancy, suggesting good market fit and guest satisfaction.
- Typical properties (Median) have an occupancy rate around 40%.
- Entry-level properties (Bottom 25%) average 24% occupancy, potentially facing higher vacancy.
Average Monthly Occupancy Rate Trend in Smyrna
Average Daily Rate (ADR) Airbnb Trends in Smyrna (2026)
Effective short term rental pricing strategy in Smyrna involves understanding monthly ADR fluctuations. The Average Daily Rate (ADR) for Airbnb in Smyrna typically peaks in December and dips lowest during February. Leveraging Airbnb dynamic pricing tools or strategies based on this seasonality can significantly boost revenue. Here's a look at the typical nightly rates achieved:
- Best-in-class properties (Top 10%) command rates of $624+ per night, often due to premium features or locations.
- Strong performing properties (Top 25%) achieve nightly rates of $267 or more.
- Typical properties (Median) charge around $186 per night.
- Entry-level properties (Bottom 25%) earn around $101 per night.
Average Daily Rate (ADR) Trend by Month in Smyrna
Get Live Smyrna Market Intelligence 👇
Explore Real-time Analytics
Airbnb Seasonality Analysis & Trends in Smyrna (2026)
Peak Season (June, August, October)
- Revenue averages $4,621 per month
- Occupancy rates average 49.0%
- Daily rates average $269
Shoulder Season
- Revenue averages $3,401 per month
- Occupancy maintains around 47.3%
- Daily rates hold near $246
Low Season (January, February, September)
- Revenue drops to average $2,205 per month
- Occupancy decreases to average 31.6%
- Daily rates adjust to average $255
Seasonality Insights for Smyrna
- The Airbnb seasonality in Smyrna shows highly seasonal trends requiring careful strategy. While the sections above show seasonal averages, it's also insightful to look at the extremes:
- During the high season, the absolute peak month showcases Smyrna's highest earning potential, with monthly revenues capable of climbing to $4,927, occupancy reaching a high of 60.4%, and ADRs peaking at $299.
- Conversely, the slowest single month of the year, typically falling within the low season, marks the market's lowest point. In this month, revenue might dip to $1,834, occupancy could drop to 27.4%, and ADRs may adjust down to $190.
- Understanding both the seasonal averages and these monthly peaks and troughs in revenue, occupancy, and ADR is crucial for maximizing your Airbnb profit potential in Smyrna.
Seasonal Strategies for Maximizing Profit
- Peak Season: Maximize revenue through premium pricing and potentially longer minimum stays. Ensure high availability.
- Low Season: Offer competitive pricing, special promotions (e.g., extended stay discounts), and flexible cancellation policies. Target off-season travelers like remote workers or budget-conscious guests.
- Shoulder Seasons: Implement dynamic pricing that balances peak and low rates. Target weekend travelers or specific events. Offer slightly more flexible terms than peak season.
- Regularly analyze your own performance against these Smyrna seasonality benchmarks and adjust your pricing and availability strategy accordingly.
Best Areas for Airbnb Investment in Smyrna (2026)
Exploring the top neighborhoods for short-term rentals in Smyrna? This section highlights key areas, outlining why they are attractive for hosts and guests, along with notable local attractions. Consider these locations based on your target guest profile and investment strategy.
| Neighborhood / Area | Why Host Here? (Target Guests & Appeal) | Key Attractions & Landmarks |
|---|---|---|
| Smyrna Downtown | The lively downtown area offers a mix of local shops, restaurants, and parks, making it an attractive destination for visitors looking to explore the local culture and community events. | Smyrna Town Center, Smyrna Outdoor Adventure Center, Local restaurants and cafes, Historic sites, Community events |
| Nashville Supercharger Area | As part of the greater Nashville area, this region attracts travelers visiting Nashville for its music scene, festivals, and attractions while providing a quieter suburban experience. | Nashville music venues, The Grand Ole Opry, Paramount Center for the Arts, Easy access to downtown Nashville |
| Borough Hill | A residential area known for its family-friendly environment, parks, and proximity to schools, making it appealing for families traveling to Smyrna for events or visiting relatives. | Local parks, Playgrounds, Community festivals, Nearby shopping centers |
| Smyrna Golf Club Area | Attracts golf enthusiasts and offers recreation opportunities with its close proximity to local golf courses and beautiful green landscapes. | Smyrna Golf Club, Parks and outdoor spaces, Relaxed dining options |
| Sam Ridley Parkway | This commercial corridor features numerous shops and services, making it a convenient and popular stop for travelers and those seeking a variety of dining options. | Shopping centers, Restaurants, Office parks, Convenient access to major roadways |
| Briarfield | A suburban community that appeals to families and vacationers alike, offering a peaceful environment while still being close to Smyrna amenities and attractions. | Community parks, Friendly neighborhoods, Local markets |
| La Vergne | Just adjacent to Smyrna, also known for its residential areas and family-friendly atmosphere, providing easy access to both Smyrna and Nashville attractions. | Community events, Family recreation areas, Nearby shopping |
| Smyrna Historic District | Rich in history and charm, this area is great for visitors interested in the historical aspects of Smyrna and looking for a unique cultural experience. | Old Smyrna Town Hall, Local museums, Historic architecture |
Understanding Airbnb License Requirements & STR Laws in Smyrna (2026)
While Smyrna, Tennessee, United States currently shows low STR regulations, specific Airbnb license requirements might still exist or change. Always verify the latest short term rental regulations and Airbnb license requirements directly with local government authorities for Smyrna to ensure full compliance before hosting.
(Source: AirROI data, 2026, finding no licensed listings among those analyzed)
Top Performing Airbnb Properties in Smyrna (2026)
Benchmark your potential! Explore examples of top-performing Airbnb properties in Smyrnabased on Trailing Twelve Month (TTM) revenue. Analyze their characteristics, revenue, occupancy rate, and ADR to understand what drives success in this market.
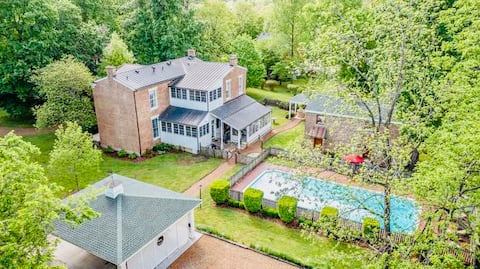
Luxury Historic Estate with Hot Tub & Pool
Entire Place • 5 bedrooms

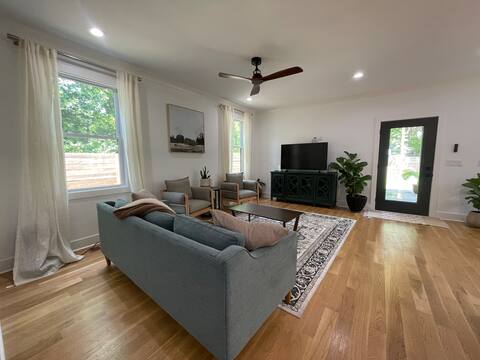
Rockin' Records 232-Rooftop Deck-Mins to Broadway
Entire Place • 4 bedrooms

The Promise Oasis!
Entire Place • 4 bedrooms

*4BR | Near Nashville | Great Location
Entire Place • 4 bedrooms

Luxury Mansion at Idler's Retreat with Hot Tub
Entire Place • 3 bedrooms
Smyrna home close to Nash, Boro
Entire Place • 4 bedrooms
Note: Performance varies based on location, size, amenities, seasonality, and management quality. Data reflects the past 12 months.
Top Performing Airbnb Hosts in Smyrna (2026)
Learn from the best! This table showcases top-performing Airbnb hosts in Smyrna based on the number of properties managed and estimated total revenue over the past year. Analyze their scale and performance metrics.
| Host Name | Properties | Grossing Revenue | Stay Reviews | Avg Rating |
|---|---|---|---|---|
| Savannah | 3 | $158,673 | 144 | 4.54/5.0 |
| David | 1 | $84,200 | 16 | 4.69/5.0 |
| Gerald And Nikita | 1 | $70,717 | 6 | 5.00/5.0 |
| Jill | 2 | $51,240 | 184 | 4.72/5.0 |
| Emilee | 1 | $50,462 | 122 | 4.84/5.0 |
| Rosalba | 1 | $39,382 | 50 | 5.00/5.0 |
| Jim | 1 | $33,798 | 129 | 4.91/5.0 |
| Lauren | 1 | $31,062 | 311 | 4.98/5.0 |
| Kristin | 1 | $30,594 | 180 | 4.91/5.0 |
| Iraci | 1 | $25,553 | 51 | 4.75/5.0 |
Analyzing the strategies of top hosts, such as their property selection, pricing, and guest communication, can offer valuable lessons for optimizing your own Airbnb operations in Smyrna.
Dive Deeper: Advanced Smyrna STR Market Data (2026)
Ready to unlock more insights? AirROI provides access to advanced metrics and comprehensive Airbnb data for Smyrna. Explore detailed analytics beyond this report to refine your investment strategy, optimize pricing, and maximize your vacation rental profits.
Explore Advanced MetricsSmyrna Short-Term Rental Market Composition (2026): Property & Room Types
Room Type Distribution
Property Type Distribution
Market Composition Insights for Smyrna
- The Smyrna Airbnb market composition is heavily skewed towards Entire Home/Apt listings, which make up 90.9% of the 22 active rentals. This indicates strong guest preference for privacy and space.
- Looking at the property type distribution in Smyrna, House properties are the most common (81.8%), reflecting the local real estate landscape.
- Houses represent a significant 81.8% portion, catering likely to families or larger groups.
- The presence of 9.1% Hotel/Boutique listings indicates integration with traditional hospitality.
- Smaller segments like others, apartment/condo (combined 9.0%) offer potential for unique stay experiences.
Smyrna Airbnb Room Capacity Analysis (2026): Bedroom Distribution
Distribution of Listings by Number of Bedrooms
Room Capacity Insights for Smyrna
- The dominant room capacity in Smyrna is 3 bedrooms listings, making up 27.3% of the market. This suggests a strong demand for properties suitable for families or small groups.
- Together, 3 bedrooms and 2 bedrooms properties represent 50.0% of the active Airbnb listings in Smyrna, indicating a high concentration in these sizes.
- A significant 50.0% of listings offer 3+ bedrooms, catering to larger groups and families seeking more space in Smyrna.
Smyrna Vacation Rental Guest Capacity Trends (2026)
Distribution of Listings by Guest Capacity
Guest Capacity Insights for Smyrna
- The most common guest capacity trend in Smyrna vacation rentals is listings accommodating 4 guests (31.8%). This suggests the primary traveler segment is likely small families or groups.
- Properties designed for 4 guests and 8+ guests dominate the Smyrna STR market, accounting for 63.6% of listings.
- 54.5% of properties accommodate 6+ guests, serving the market segment for larger families or group travel in Smyrna.
- On average, properties in Smyrna are equipped to host 5.3 guests.
Smyrna Airbnb Booking Patterns (2026): Available vs. Booked Days
Available Days Distribution
Booked Days Distribution
Booking Pattern Insights for Smyrna
- The most common availability pattern in Smyrna falls within the 181-270 days range, representing 40.9% of listings. This suggests many properties have significant open periods on their calendars.
- Approximately 77.3% of listings show high availability (181+ days open annually), indicating potential for increased bookings or specific owner usage patterns.
- For booked days, the 91-180 days range is most frequent in Smyrna (40.9%), reflecting common guest stay durations or potential owner blocking patterns.
- A notable 22.7% of properties secure long booking periods (181+ days booked per year), highlighting successful long-term rental strategies or significant owner usage.
Smyrna Airbnb Minimum Stay Requirements Analysis
Distribution of Listings by Minimum Night Requirement
1 Night
5 listings
22.7% of total
2 Nights
5 listings
22.7% of total
3 Nights
2 listings
9.1% of total
7-29 Nights
1 listings
4.5% of total
30+ Nights
9 listings
40.9% of total
Key Insights
- The most prevalent minimum stay requirement in Smyrna is 30+ Nights, adopted by 40.9% of listings. This highlights the market's preference for longer commitments.
- A significant segment (40.9%) caters to monthly stays (30+ nights) in Smyrna, pointing to opportunities in the extended-stay market.
Recommendations
- Align with the market by considering a 30+ Nights minimum stay, as 40.9% of Smyrna hosts use this setting.
- If feasible, allowing 1-night stays, especially midweek or during low season, could capture last-minute bookings, as only 22.7% currently do.
- Explore offering discounts for stays of 30+ nights to attract the 40.9% of the market seeking extended stays.
- Adjust minimum nights based on seasonality – potentially shorter during low season and longer during peak demand periods in Smyrna.
Smyrna Airbnb Cancellation Policy Trends Analysis (2026)
Flexible
5 listings
22.7% of total
Moderate
5 listings
22.7% of total
Firm
10 listings
45.5% of total
Strict
2 listings
9.1% of total
Cancellation Policy Insights for Smyrna
- The prevailing Airbnb cancellation policy trend in Smyrna is Firm, used by 45.5% of listings.
- A majority (54.6%) of hosts in Smyrna utilize Firm or Strict policies, indicating a market where hosts prioritize booking security.
- Strict cancellation policies are quite rare (9.1%), potentially making listings with this policy less competitive unless justified by high demand or property type.
Recommendations for Hosts
- Consider adopting a Firm policy to align with the 45.5% market standard in Smyrna.
- Using a Strict policy might deter some guests, as only 9.1% of listings use it. Evaluate if potential revenue protection outweighs possible lower booking rates.
- Regularly review your cancellation policy against competitors and market demand shifts in Smyrna.
Smyrna STR Booking Lead Time Analysis (2026)
Average Booking Lead Time by Month
Booking Lead Time Insights for Smyrna
- The overall average booking lead time for vacation rentals in Smyrna is 39 days.
- Guests book furthest in advance for stays during August (average 54 days), likely coinciding with peak travel demand or local events.
- The shortest booking windows occur for stays in March (average 23 days), indicating more last-minute travel plans during this time.
- Seasonally, Summer (47 days avg.) sees the longest lead times, while Winter (30 days avg.) has the shortest, reflecting typical travel planning cycles.
Recommendations for Hosts
- Use the overall average lead time (39 days) as a baseline for your pricing and availability strategy in Smyrna.
- For August stays, consider implementing length-of-stay discounts or slightly higher rates for bookings made less than 54 days out to capitalize on advance planning.
- Target marketing efforts for the Summer season well in advance (at least 47 days) to capture early planners.
- Monitor your own booking lead times against these Smyrna averages to identify opportunities for dynamic pricing adjustments.
Popular & Essential Airbnb Amenities in Smyrna (2026)
Amenity Prevalence
Amenity Insights for Smyrna
- Essential amenities in Smyrna that guests expect include: Hot water, Air conditioning, Wifi, Free parking on premises, Hair dryer, Coffee maker, Heating, Smoke alarm, TV, Microwave. Lacking these (any) could significantly impact bookings.
Recommendations for Hosts
- Ensure your listing includes all essential amenities for Smyrna: Hot water, Air conditioning, Wifi, Free parking on premises, Hair dryer, Coffee maker, Heating, Smoke alarm, TV, Microwave.
- Prioritize adding missing essentials: TV, Microwave.
- Highlight unique or less common amenities you offer (e.g., hot tub, dedicated workspace, EV charger) in your listing description and photos.
- Regularly check competitor amenities in Smyrna to stay competitive.
Smyrna Airbnb Guest Demographics & Profile Analysis (2026)
Guest Profile Summary for Smyrna
- The typical guest profile for Airbnb in Smyrna consists of primarily domestic travelers (98%), often arriving from nearby Nashville, typically belonging to the Post-2000s (Gen Z/Alpha) group (50%), primarily speaking English or Spanish.
- Domestic travelers account for 97.6% of guests.
- Key international markets include United States (97.6%) and Ireland (0.6%).
- Top languages spoken are English (70.4%) followed by Spanish (16%).
- A significant demographic segment is the Post-2000s (Gen Z/Alpha) group, representing 50% of guests.
Recommendations for Hosts
- Target domestic marketing efforts towards travelers from Nashville and Murfreesboro.
- Tailor amenities and listing descriptions to appeal to the dominant Post-2000s (Gen Z/Alpha) demographic (e.g., highlight fast WiFi, smart home features, local guides).
- Highlight unique local experiences or amenities relevant to the primary guest profile.
- Consider seasonal promotions aligned with peak travel times for key origin markets.
Nearby Short-Term Rental Market Comparison
How does the Smyrna Airbnb market stack up against its neighbors? Compare key performance metrics like average monthly revenue, ADR, and occupancy rates in surrounding areas to understand the broader regional STR landscape.
| Market | Active Properties | Monthly Revenue | Daily Rate | Avg. Occupancy |
|---|---|---|---|---|
| Brentwood | 14 | $4,937 | $601.43 | 47% |
| Bremen | 23 | $4,914 | $603.74 | 33% |
| Arley | 47 | $4,531 | $525.71 | 35% |
| Berry Hill | 136 | $4,232 | $323.78 | 44% |
| Coalmont | 13 | $3,864 | $240.00 | 52% |
| Nashville-Davidson | 6,085 | $3,810 | $321.42 | 45% |
| Cedar Bluff | 37 | $3,805 | $390.28 | 36% |
| Franklin | 409 | $3,777 | $297.07 | 48% |
| Mt. Juliet | 54 | $3,588 | $312.34 | 44% |
| Lookout Mountain | 82 | $3,569 | $311.06 | 47% |