Pittman Center Airbnb Market Analysis 2026: Short Term Rental Data & Vacation Rental Statistics in Tennessee, United States
Is Airbnb profitable in Pittman Center in 2026? Explore comprehensive Airbnb analytics for Pittman Center, Tennessee, United States to uncover income potential. This 2026 STR market report for Pittman Center, based on AirROI data from February 2025 to January 2026, reveals key trends in the market of 297 active listings.
Whether you're considering an Airbnb investment in Pittman Center, optimizing your existing vacation rental, or exploring rental arbitrage opportunities, understanding the Pittman Center Airbnb data is crucial. Leveraging the low regulation environment is key to maximizing your short term rental income potential. Let's dive into the specifics.
Key Pittman Center Airbnb Performance Metrics Overview
Monthly Airbnb Revenue Variations & Income Potential in Pittman Center (2026)
Understanding the monthly revenue variations for Airbnb listings in Pittman Center is key to maximizing your short term rental income potential. Seasonality significantly impacts earnings. Our analysis, based on data from the past 12 months, shows that the peak revenue month for STRs in Pittman Center is typically December, while February often presents the lowest earnings, highlighting opportunities for strategic pricing adjustments during shoulder and low seasons. Explore the typical Airbnb income in Pittman Center across different performance tiers:
- Best-in-class properties (Top 10%) achieve $9,665+ monthly, often utilizing dynamic pricing and superior guest experiences.
- Strong performing properties (Top 25%) earn $5,521 or more, indicating effective management and desirable locations/amenities.
- Typical properties (Median) generate around $3,284 per month, representing the average market performance.
- Entry-level properties (Bottom 25%) see earnings around $1,795, often with potential for optimization.
Average Monthly Airbnb Earnings Trend in Pittman Center
Pittman Center Airbnb Occupancy Rate Trends (2026)
Maximize your bookings by understanding the Pittman Center STR occupancy trends. Seasonal demand shifts significantly influence how often properties are booked. Typically, Octobersees the highest demand (peak season occupancy), while January experiences the lowest (low season). Effective strategies, like adjusting minimum stays or offering promotions, can boost occupancy during slower periods. Here's how different property tiers perform in Pittman Center:
- Best-in-class properties (Top 10%) achieve 79%+ occupancy, indicating high desirability and potentially optimized availability.
- Strong performing properties (Top 25%) maintain 64% or higher occupancy, suggesting good market fit and guest satisfaction.
- Typical properties (Median) have an occupancy rate around 43%.
- Entry-level properties (Bottom 25%) average 25% occupancy, potentially facing higher vacancy.
Average Monthly Occupancy Rate Trend in Pittman Center
Average Daily Rate (ADR) Airbnb Trends in Pittman Center (2026)
Effective short term rental pricing strategy in Pittman Center involves understanding monthly ADR fluctuations. The Average Daily Rate (ADR) for Airbnb in Pittman Center typically peaks in December and dips lowest during February. Leveraging Airbnb dynamic pricing tools or strategies based on this seasonality can significantly boost revenue. Here's a look at the typical nightly rates achieved:
- Best-in-class properties (Top 10%) command rates of $573+ per night, often due to premium features or locations.
- Strong performing properties (Top 25%) achieve nightly rates of $356 or more.
- Typical properties (Median) charge around $239 per night.
- Entry-level properties (Bottom 25%) earn around $175 per night.
Average Daily Rate (ADR) Trend by Month in Pittman Center
Get Live Pittman Center Market Intelligence 👇

Explore Real-time Analytics
Airbnb Seasonality Analysis & Trends in Pittman Center (2026)
Peak Season (December, July, October)
- Revenue averages $6,297 per month
- Occupancy rates average 54.4%
- Daily rates average $358
Shoulder Season
- Revenue averages $4,337 per month
- Occupancy maintains around 46.1%
- Daily rates hold near $299
Low Season (January, February, May)
- Revenue drops to average $2,919 per month
- Occupancy decreases to average 33.7%
- Daily rates adjust to average $278
Seasonality Insights for Pittman Center
- The Airbnb seasonality in Pittman Center shows highly seasonal trends requiring careful strategy. While the sections above show seasonal averages, it's also insightful to look at the extremes:
- During the high season, the absolute peak month showcases Pittman Center's highest earning potential, with monthly revenues capable of climbing to $6,488, occupancy reaching a high of 59.2%, and ADRs peaking at $392.
- Conversely, the slowest single month of the year, typically falling within the low season, marks the market's lowest point. In this month, revenue might dip to $2,317, occupancy could drop to 30.1%, and ADRs may adjust down to $238.
- Understanding both the seasonal averages and these monthly peaks and troughs in revenue, occupancy, and ADR is crucial for maximizing your Airbnb profit potential in Pittman Center.
Seasonal Strategies for Maximizing Profit
- Peak Season: Maximize revenue through premium pricing and potentially longer minimum stays. Ensure high availability.
- Low Season: Offer competitive pricing, special promotions (e.g., extended stay discounts), and flexible cancellation policies. Target off-season travelers like remote workers or budget-conscious guests.
- Shoulder Seasons: Implement dynamic pricing that balances peak and low rates. Target weekend travelers or specific events. Offer slightly more flexible terms than peak season.
- Regularly analyze your own performance against these Pittman Center seasonality benchmarks and adjust your pricing and availability strategy accordingly.
Best Areas for Airbnb Investment in Pittman Center (2026)
Exploring the top neighborhoods for short-term rentals in Pittman Center? This section highlights key areas, outlining why they are attractive for hosts and guests, along with notable local attractions. Consider these locations based on your target guest profile and investment strategy.
| Neighborhood / Area | Why Host Here? (Target Guests & Appeal) | Key Attractions & Landmarks |
|---|---|---|
| Gatlinburg | A popular resort town known for its proximity to the Great Smoky Mountains National Park, offering outdoor activities and family-friendly attractions, making it a prime destination for tourists year-round. | Great Smoky Mountains National Park, Gatlinburg SkyLift Park, Ripley's Aquarium of the Smokies, Ober Gatlinburg, Anakeesta, Gatlinburg Strip |
| Pigeon Forge | Famous for the Dollywood theme park and numerous entertainment options, Pigeon Forge is a major family vacation destination, attracting visitors seeking fun and adventure. | Dollywood, The Island in Pigeon Forge, Titanic Museum Attraction, WonderWorks, Pigeon Forge Snow, Great Smoky Mountains |
| Sevierville | Known for shopping and scenic views, Sevierville is a gateway to the Smoky Mountains and offers a blend of outdoor activities and entertainment, appealing to a wide range of travelers. | Dolly Parton's Statue, Sevierville Golf Club, Wilderness at the Smokies, Tanger Outlets, Fort Sanders-Sevierville Hospital, Great Smoky Mountains |
| Cherokee | Located near the entrance to the Great Smoky Mountains, Cherokee offers rich Native American history and cultural experiences, as well as outdoor recreation, attracting nature and culture enthusiasts. | Museum of the Cherokee Indian, Oconaluftee River, Harrah's Cherokee Casino, Mingo Falls, Great Smoky Mountains National Park, Cherokee Indian Reservation |
| Townsend | A quiet alternative to the more tourist-heavy areas, Townsend is known as the 'Peaceful Side of the Smokies' and appeals to those looking for tranquility and natural beauty. | Great Smoky Mountains National Park, Cades Cove, Tuckaleechee Caverns, Townsend Riverwalk, Trillium Gap Trail, Little River |
| Douglas Lake | A popular destination for water sports and fishing, Douglas Lake offers beautiful scenery and recreational activities, making it ideal for families and outdoor lovers. | Douglas Dam, Fishing and boating, Paddleboarding, Beach access, Picnic areas, Scenic views |
| Wears Valley | A serene community close to Pigeon Forge and Gatlinburg, Wears Valley provides a more laid-back atmosphere with access to stunning mountain scenery and outdoor adventures. | Great Smoky Mountains National Park, Wears Valley Zipline Adventures, Wildland Adventures, Hiking trails, Scenic drives, Local eateries |
| Cosby | Less crowded than Gatlinburg and Pigeon Forge, Cosby is ideal for visitors wanting to explore nature while enjoying a peaceful setting, great for hiking and camping enthusiasts. | Cosby Campground, Great Smoky Mountains National Park, Hen Wallow Falls, Laurel Falls, Hiking trails, Picnic areas |
Understanding Airbnb License Requirements & STR Laws in Pittman Center (2026)
While Pittman Center, Tennessee, United States currently shows low STR regulations, specific Airbnb license requirements might still exist or change. Always verify the latest short term rental regulations and Airbnb license requirements directly with local government authorities for Pittman Center to ensure full compliance before hosting.
(Source: AirROI data, 2026, finding no licensed listings among those analyzed)
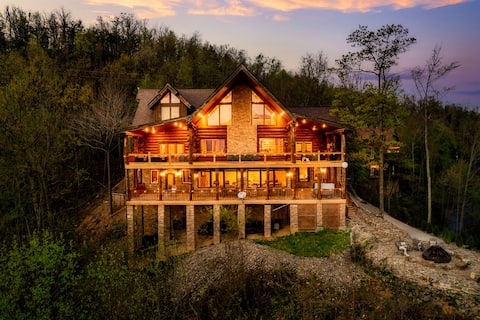
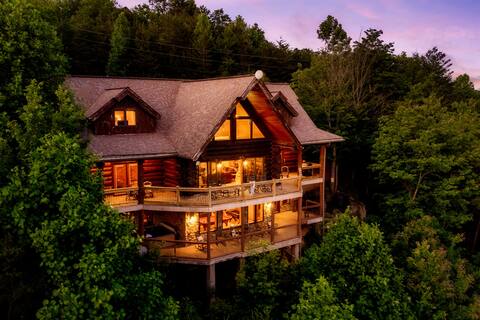
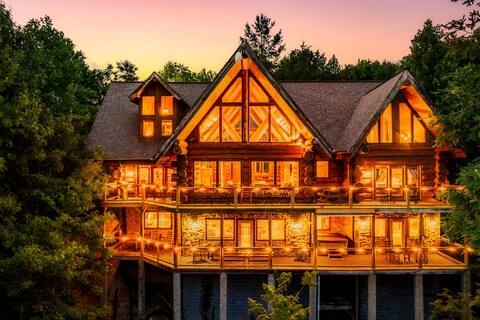
Top Performing Airbnb Properties in Pittman Center (2026)
Benchmark your potential! Explore examples of top-performing Airbnb properties in Pittman Centerbased on Trailing Twelve Month (TTM) revenue. Analyze their characteristics, revenue, occupancy rate, and ADR to understand what drives success in this market.

Stunning Views| Roof Deck| Hot Pool | Hot Tub| GmRm!
Entire Place • 5 bedrooms
Luxe 5* Retreat~JanDeals~GmRm~PS5~FirePit~HotTub
Entire Place • 6 bedrooms
4Suites| JanDeal | View | HotTub | FirePit | GmRm
Entire Place • 6 bedrooms
Views | Theater | JanDeals | GameRm | HotTub
Entire Place • 7 bedrooms

Luxury Cabin w/ Sauna | 3rd Night Free!
Entire Place • 5 bedrooms

Stunning Log Construction • Owner Managed Cabin
Entire Place • 6 bedrooms
Note: Performance varies based on location, size, amenities, seasonality, and management quality. Data reflects the past 12 months.
Top Performing Airbnb Hosts in Pittman Center (2026)
Learn from the best! This table showcases top-performing Airbnb hosts in Pittman Center based on the number of properties managed and estimated total revenue over the past year. Analyze their scale and performance metrics.
| Host Name | Properties | Grossing Revenue | Stay Reviews | Avg Rating |
|---|---|---|---|---|
| ErwinA | 5 | $980,235 | 215 | 4.92/5.0 |
| Stony Brook Cabins | 16 | $770,606 | 579 | 4.73/5.0 |
| Parkside Cabin Rentals LLC | 14 | $698,121 | 94 | 4.69/5.0 |
| Creekside Hideaway | 23 | $637,233 | 656 | 4.95/5.0 |
| Prestige | 14 | $436,780 | 657 | 4.69/5.0 |
| Heavenly Views Resort | 9 | $364,828 | 72 | 4.58/5.0 |
| Christopher Shayne | 5 | $310,568 | 412 | 4.92/5.0 |
| Jackson Mountain Rentals | 6 | $293,507 | 45 | 4.36/5.0 |
| Bear Camp Cabin Rentals | 6 | $284,486 | 80 | 4.58/5.0 |
| Elk Springs | 7 | $278,930 | 130 | 4.43/5.0 |
Analyzing the strategies of top hosts, such as their property selection, pricing, and guest communication, can offer valuable lessons for optimizing your own Airbnb operations in Pittman Center.
Dive Deeper: Advanced Pittman Center STR Market Data (2026)
Ready to unlock more insights? AirROI provides access to advanced metrics and comprehensive Airbnb data for Pittman Center. Explore detailed analytics beyond this report to refine your investment strategy, optimize pricing, and maximize your vacation rental profits.
Explore Advanced MetricsPittman Center Short-Term Rental Market Composition (2026): Property & Room Types
Room Type Distribution
Property Type Distribution
Market Composition Insights for Pittman Center
- The Pittman Center Airbnb market composition is heavily skewed towards Entire Home/Apt listings, which make up 100% of the 297 active rentals. This indicates strong guest preference for privacy and space.
- Looking at the property type distribution in Pittman Center, Outdoor/Unique properties are the most common (74.7%), reflecting the local real estate landscape.
- Smaller segments like unique stays, others (combined 1.3%) offer potential for unique stay experiences.
Pittman Center Airbnb Room Capacity Analysis (2026): Bedroom Distribution
Distribution of Listings by Number of Bedrooms
Room Capacity Insights for Pittman Center
- The dominant room capacity in Pittman Center is 1 bedroom listings, making up 32.3% of the market. This suggests a strong demand for properties suitable for couples or solo travelers.
- Together, 1 bedroom and 2 bedrooms properties represent 63.6% of the active Airbnb listings in Pittman Center, indicating a high concentration in these sizes.
- A significant 33.3% of listings offer 3+ bedrooms, catering to larger groups and families seeking more space in Pittman Center.
Pittman Center Vacation Rental Guest Capacity Trends (2026)
Distribution of Listings by Guest Capacity
Guest Capacity Insights for Pittman Center
- The most common guest capacity trend in Pittman Center vacation rentals is listings accommodating 8+ guests (36%). This suggests the primary traveler segment is likely larger groups.
- Properties designed for 8+ guests and 4 guests dominate the Pittman Center STR market, accounting for 64.3% of listings.
- 62.6% of properties accommodate 6+ guests, serving the market segment for larger families or group travel in Pittman Center.
- On average, properties in Pittman Center are equipped to host 5.9 guests.
Pittman Center Airbnb Booking Patterns (2026): Available vs. Booked Days
Available Days Distribution
Booked Days Distribution
Booking Pattern Insights for Pittman Center
- The most common availability pattern in Pittman Center falls within the 181-270 days range, representing 39.7% of listings. This suggests many properties have significant open periods on their calendars.
- Approximately 70.0% of listings show high availability (181+ days open annually), indicating potential for increased bookings or specific owner usage patterns.
- For booked days, the 91-180 days range is most frequent in Pittman Center (40.1%), reflecting common guest stay durations or potential owner blocking patterns.
- A notable 32.0% of properties secure long booking periods (181+ days booked per year), highlighting successful long-term rental strategies or significant owner usage.
Pittman Center Airbnb Minimum Stay Requirements Analysis
Distribution of Listings by Minimum Night Requirement
1 Night
29 listings
9.8% of total
2 Nights
120 listings
40.4% of total
3 Nights
12 listings
4% of total
30+ Nights
136 listings
45.8% of total
Key Insights
- The most prevalent minimum stay requirement in Pittman Center is 30+ Nights, adopted by 45.8% of listings. This highlights the market's preference for longer commitments.
- A significant segment (45.8%) caters to monthly stays (30+ nights) in Pittman Center, pointing to opportunities in the extended-stay market.
Recommendations
- Align with the market by considering a 30+ Nights minimum stay, as 45.8% of Pittman Center hosts use this setting.
- If feasible, allowing 1-night stays, especially midweek or during low season, could capture last-minute bookings, as only 9.8% currently do.
- A 2-night minimum appears standard (40.4%). Consider this for weekends or peak periods.
- Explore offering discounts for stays of 30+ nights to attract the 45.8% of the market seeking extended stays.
- Adjust minimum nights based on seasonality – potentially shorter during low season and longer during peak demand periods in Pittman Center.
Pittman Center Airbnb Cancellation Policy Trends Analysis (2026)
Super Strict 30 Days
16 listings
5.4% of total
Limited
15 listings
5.1% of total
Super Strict 60 Days
6 listings
2% of total
Flexible
38 listings
12.8% of total
Moderate
37 listings
12.5% of total
Firm
129 listings
43.6% of total
Strict
55 listings
18.6% of total
Cancellation Policy Insights for Pittman Center
- The prevailing Airbnb cancellation policy trend in Pittman Center is Firm, used by 43.6% of listings.
- A majority (62.2%) of hosts in Pittman Center utilize Firm or Strict policies, indicating a market where hosts prioritize booking security.
Recommendations for Hosts
- Consider adopting a Firm policy to align with the 43.6% market standard in Pittman Center.
- Regularly review your cancellation policy against competitors and market demand shifts in Pittman Center.
Pittman Center STR Booking Lead Time Analysis (2026)
Average Booking Lead Time by Month
Booking Lead Time Insights for Pittman Center
- The overall average booking lead time for vacation rentals in Pittman Center is 55 days.
- Guests book furthest in advance for stays during November (average 68 days), likely coinciding with peak travel demand or local events.
- The shortest booking windows occur for stays in February (average 33 days), indicating more last-minute travel plans during this time.
- Seasonally, Fall (64 days avg.) sees the longest lead times, while Winter (48 days avg.) has the shortest, reflecting typical travel planning cycles.
Recommendations for Hosts
- Use the overall average lead time (55 days) as a baseline for your pricing and availability strategy in Pittman Center.
- For November stays, consider implementing length-of-stay discounts or slightly higher rates for bookings made less than 68 days out to capitalize on advance planning.
- Target marketing efforts for the Fall season well in advance (at least 64 days) to capture early planners.
- Monitor your own booking lead times against these Pittman Center averages to identify opportunities for dynamic pricing adjustments.
Popular & Essential Airbnb Amenities in Pittman Center (2026)
Amenity Prevalence
Amenity Insights for Pittman Center
- Essential amenities in Pittman Center that guests expect include: Heating, TV, Air conditioning, Smoke alarm, Kitchen, Wifi, Coffee maker, Free parking on premises, Microwave, Bed linens. Lacking these (any) could significantly impact bookings.
Recommendations for Hosts
- Ensure your listing includes all essential amenities for Pittman Center: Heating, TV, Air conditioning, Smoke alarm, Kitchen, Wifi, Coffee maker, Free parking on premises, Microwave, Bed linens.
- Prioritize adding missing essentials: Heating, TV, Air conditioning, Smoke alarm, Kitchen, Wifi, Coffee maker, Free parking on premises, Microwave, Bed linens.
- Highlight unique or less common amenities you offer (e.g., hot tub, dedicated workspace, EV charger) in your listing description and photos.
- Regularly check competitor amenities in Pittman Center to stay competitive.
Pittman Center Airbnb Guest Demographics & Profile Analysis (2026)
Guest Profile Summary for Pittman Center
- The typical guest profile for Airbnb in Pittman Center consists of primarily domestic travelers (98%), often arriving from nearby Nashville, typically belonging to the Post-2000s (Gen Z/Alpha) group (50%), primarily speaking English or Spanish.
- Domestic travelers account for 97.8% of guests.
- Key international markets include United States (97.8%) and United Kingdom (0.6%).
- Top languages spoken are English (79.3%) followed by Spanish (12.4%).
- A significant demographic segment is the Post-2000s (Gen Z/Alpha) group, representing 50% of guests.
Recommendations for Hosts
- Target domestic marketing efforts towards travelers from Nashville and Atlanta.
- Tailor amenities and listing descriptions to appeal to the dominant Post-2000s (Gen Z/Alpha) demographic (e.g., highlight fast WiFi, smart home features, local guides).
- Highlight unique local experiences or amenities relevant to the primary guest profile.
- Consider seasonal promotions aligned with peak travel times for key origin markets.
Nearby Short-Term Rental Market Comparison
How does the Pittman Center Airbnb market stack up against its neighbors? Compare key performance metrics like average monthly revenue, ADR, and occupancy rates in surrounding areas to understand the broader regional STR landscape.
| Market | Active Properties | Monthly Revenue | Daily Rate | Avg. Occupancy |
|---|---|---|---|---|
| Sevier County | 68 | $7,108 | $567.95 | 44% |
| Gilmer County | 26 | $5,298 | $459.59 | 40% |
| Union Mills | 15 | $4,938 | $442.76 | 41% |
| Sevierville | 6,269 | $4,747 | $370.20 | 46% |
| Fannin County | 42 | $4,574 | $435.93 | 38% |
| East Ellijay | 15 | $4,415 | $368.05 | 41% |
| Epworth | 79 | $4,411 | $406.97 | 40% |
| Six Mile | 57 | $4,396 | $449.78 | 42% |
| Gatlinburg | 3,565 | $4,385 | $353.70 | 45% |
| Commerce | 19 | $4,298 | $285.34 | 45% |