Nashville-Davidson Airbnb Market Analysis 2026: Short Term Rental Data & Vacation Rental Statistics in Tennessee, United States
Is Airbnb profitable in Nashville-Davidson in 2026? Explore comprehensive Airbnb analytics for Nashville-Davidson, Tennessee, United States to uncover income potential. This 2026 STR market report for Nashville-Davidson, based on AirROI data from February 2025 to January 2026, reveals key trends in the bustling market of 6,085 active listings.
Whether you're considering an Airbnb investment in Nashville-Davidson, optimizing your existing vacation rental, or exploring rental arbitrage opportunities, understanding the Nashville-Davidson Airbnb data is crucial. Understanding the local regulations is key to maximizing your short term rental income potential. Let's dive into the specifics.
Key Nashville-Davidson Airbnb Performance Metrics Overview
Monthly Airbnb Revenue Variations & Income Potential in Nashville-Davidson (2026)
Understanding the monthly revenue variations for Airbnb listings in Nashville-Davidson is key to maximizing your short term rental income potential. Seasonality significantly impacts earnings. Our analysis, based on data from the past 12 months, shows that the peak revenue month for STRs in Nashville-Davidson is typically October, while February often presents the lowest earnings, highlighting opportunities for strategic pricing adjustments during shoulder and low seasons. Explore the typical Airbnb income in Nashville-Davidson across different performance tiers:
- Best-in-class properties (Top 10%) achieve $9,220+ monthly, often utilizing dynamic pricing and superior guest experiences.
- Strong performing properties (Top 25%) earn $5,931 or more, indicating effective management and desirable locations/amenities.
- Typical properties (Median) generate around $3,654 per month, representing the average market performance.
- Entry-level properties (Bottom 25%) see earnings around $2,049, often with potential for optimization.
Average Monthly Airbnb Earnings Trend in Nashville-Davidson
Nashville-Davidson Airbnb Occupancy Rate Trends (2026)
Maximize your bookings by understanding the Nashville-Davidson STR occupancy trends. Seasonal demand shifts significantly influence how often properties are booked. Typically, Octobersees the highest demand (peak season occupancy), while January experiences the lowest (low season). Effective strategies, like adjusting minimum stays or offering promotions, can boost occupancy during slower periods. Here's how different property tiers perform in Nashville-Davidson:
- Best-in-class properties (Top 10%) achieve 78%+ occupancy, indicating high desirability and potentially optimized availability.
- Strong performing properties (Top 25%) maintain 64% or higher occupancy, suggesting good market fit and guest satisfaction.
- Typical properties (Median) have an occupancy rate around 46%.
- Entry-level properties (Bottom 25%) average 28% occupancy, potentially facing higher vacancy.
Average Monthly Occupancy Rate Trend in Nashville-Davidson
Average Daily Rate (ADR) Airbnb Trends in Nashville-Davidson (2026)
Effective short term rental pricing strategy in Nashville-Davidson involves understanding monthly ADR fluctuations. The Average Daily Rate (ADR) for Airbnb in Nashville-Davidson typically peaks in October and dips lowest during February. Leveraging Airbnb dynamic pricing tools or strategies based on this seasonality can significantly boost revenue. Here's a look at the typical nightly rates achieved:
- Best-in-class properties (Top 10%) command rates of $568+ per night, often due to premium features or locations.
- Strong performing properties (Top 25%) achieve nightly rates of $388 or more.
- Typical properties (Median) charge around $250 per night.
- Entry-level properties (Bottom 25%) earn around $160 per night.
Average Daily Rate (ADR) Trend by Month in Nashville-Davidson
Get Live Nashville-Davidson Market Intelligence 👇

Explore Real-time Analytics
Airbnb Seasonality Analysis & Trends in Nashville-Davidson (2026)
Peak Season (October, May, June)
- Revenue averages $5,718 per month
- Occupancy rates average 51.9%
- Daily rates average $339
Shoulder Season
- Revenue averages $4,762 per month
- Occupancy maintains around 47.9%
- Daily rates hold near $312
Low Season (January, February, December)
- Revenue drops to average $3,346 per month
- Occupancy decreases to average 37.2%
- Daily rates adjust to average $295
Seasonality Insights for Nashville-Davidson
- The Airbnb seasonality in Nashville-Davidson shows highly seasonal trends requiring careful strategy. While the sections above show seasonal averages, it's also insightful to look at the extremes:
- During the high season, the absolute peak month showcases Nashville-Davidson's highest earning potential, with monthly revenues capable of climbing to $6,319, occupancy reaching a high of 53.7%, and ADRs peaking at $360.
- Conversely, the slowest single month of the year, typically falling within the low season, marks the market's lowest point. In this month, revenue might dip to $2,769, occupancy could drop to 32.1%, and ADRs may adjust down to $253.
- Understanding both the seasonal averages and these monthly peaks and troughs in revenue, occupancy, and ADR is crucial for maximizing your Airbnb profit potential in Nashville-Davidson.
Seasonal Strategies for Maximizing Profit
- Peak Season: Maximize revenue through premium pricing and potentially longer minimum stays. Ensure high availability.
- Low Season: Offer competitive pricing, special promotions (e.g., extended stay discounts), and flexible cancellation policies. Target off-season travelers like remote workers or budget-conscious guests.
- Shoulder Seasons: Implement dynamic pricing that balances peak and low rates. Target weekend travelers or specific events. Offer slightly more flexible terms than peak season.
- Regularly analyze your own performance against these Nashville-Davidson seasonality benchmarks and adjust your pricing and availability strategy accordingly.
Best Areas for Airbnb Investment in Nashville-Davidson (2026)
Exploring the top neighborhoods for short-term rentals in Nashville-Davidson? This section highlights key areas, outlining why they are attractive for hosts and guests, along with notable local attractions. Consider these locations based on your target guest profile and investment strategy.
| Neighborhood / Area | Why Host Here? (Target Guests & Appeal) | Key Attractions & Landmarks |
|---|---|---|
| Downtown Nashville | The vibrant heart of Nashville, known for its live music scene, restaurants, and nightlife. A prime location for tourists wanting to experience the best of Music City. | Nashville Broadway, Ryman Auditorium, Nashville Symphony, The Country Music Hall of Fame, Printer's Alley |
| East Nashville | A hip and trendy neighborhood known for its eclectic vibe and local arts scene. Popular with younger guests looking for a unique Nashville experience. | Five Points, Shelby Bottoms Greenway, Nashville Flea Market, The Basement East, East Nashville Beer Works |
| The Gulch | A fashionable neighborhood full of upscale dining and shopping options. This area attracts those looking for a modern, urban experience close to downtown. | The Gulch Murals, One Nashville Place, The Station Inn, Patterson House, Idego Coffee |
| Music Row | The epicenter of Nashville's music industry, perfect for visitors interested in country music and music production. It's a key area for industry professionals and music lovers alike. | The Studio B, The Country Music Hall of Fame, Fame Studios, Historic RCA Studio B, Frist Art Museum |
| West End | Close to Vanderbilt University and a diverse array of entertainment options. This area attracts students, professionals, and tourists alike. | Centennial Park, Parthenon, Vanderbilt University, Music venues, The Belcourt Theatre |
| 12 South | A charming and walkable neighborhood that’s popular for its boutiques, restaurants, and laid-back atmosphere, often frequented by locals and tourists. | 12 South Park, Edley's Bar-B-Que, all the local shops, Mas Tacos Por Favor |
| Sylvan Park | A family-friendly neighborhood with a mix of parks and local shops, ideal for visitors looking for a quieter Nashville experience yet still near all the main attractions. | Lipscomb University, Elysian Fields, Local parks, Nashville Children's Theater |
| Bellevue | A suburban area that still has access to Nashville's amenities, attracting families and those looking for a more residential feel while visiting the city. | Bonnaroo Music & Arts Festival, Local restaurants, Bicycle riding trails, Edwin Warner Park |
Understanding Airbnb License Requirements & STR Laws in Nashville-Davidson (2026)
With 11% of listings showing registration in 2026, understanding potential Airbnb license requirements is crucial in Nashville-Davidson. Always verify the latest short term rental regulations and Airbnb license requirements directly with local government authorities for Nashville-Davidson to ensure full compliance before hosting.
(Source: AirROI data, 2026, based on 11% licensed listings)
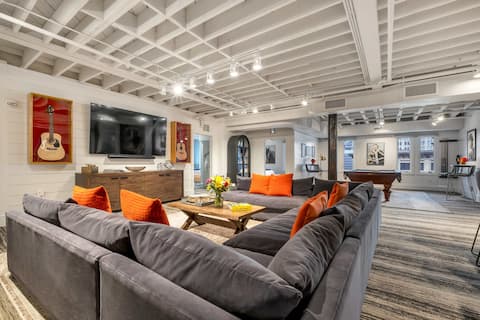
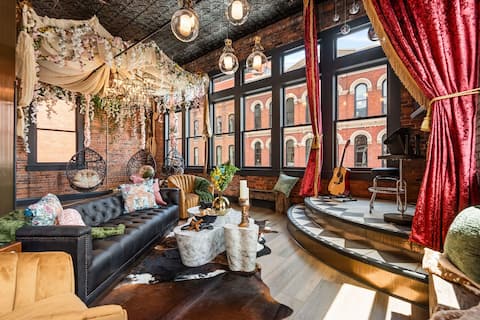
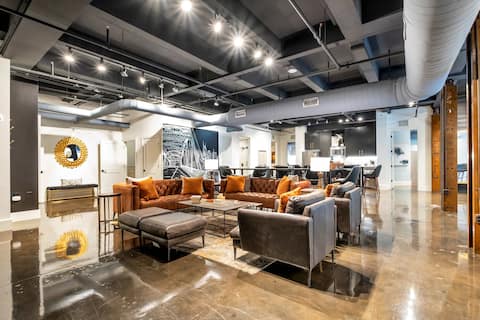
Top Performing Airbnb Properties in Nashville-Davidson (2026)
Benchmark your potential! Explore examples of top-performing Airbnb properties in Nashville-Davidsonbased on Trailing Twelve Month (TTM) revenue. Analyze their characteristics, revenue, occupancy rate, and ADR to understand what drives success in this market.
Skyline Suite Penthouse Rooftop 6BR by Maddox Hote
Entire Place • 6 bedrooms
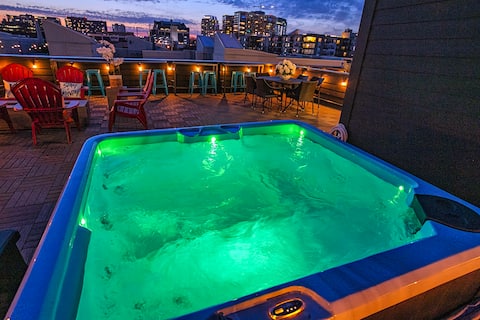
Hot Tub Heaven C&D @ The Gulch
Entire Place • 10 bedrooms
Skyline view loft w/ workspace
Entire Place • 4 bedrooms

Rockstar Mansion By Broadway
Entire Place • 8 bedrooms
Modern Suite 6BR by Maddox Hotel
Entire Place • 6 bedrooms
Mansion Luxury@Lakehouse Pool/Hot Tub for Big Fams
Entire Place • 4 bedrooms
Note: Performance varies based on location, size, amenities, seasonality, and management quality. Data reflects the past 12 months.
Top Performing Airbnb Hosts in Nashville-Davidson (2026)
Learn from the best! This table showcases top-performing Airbnb hosts in Nashville-Davidson based on the number of properties managed and estimated total revenue over the past year. Analyze their scale and performance metrics.
| Host Name | Properties | Grossing Revenue | Stay Reviews | Avg Rating |
|---|---|---|---|---|
| Host Extraordinaires | 173 | $10,957,169 | 16574 | 4.78/5.0 |
| Chris | 78 | $7,703,989 | 9934 | 4.84/5.0 |
| AvantStay Nashville | 131 | $7,196,239 | 2848 | 4.73/5.0 |
| GoodNight | 109 | $5,378,170 | 2801 | 4.58/5.0 |
| Meagan | 73 | $5,176,457 | 4467 | 4.78/5.0 |
| Hallson Hospitality Co | 42 | $5,040,180 | 3934 | 4.89/5.0 |
| Amy | 50 | $3,754,189 | 5408 | 4.91/5.0 |
| Amanda | 55 | $3,559,458 | 22917 | 4.80/5.0 |
| Beckon Homes | 53 | $3,303,586 | 4483 | 4.90/5.0 |
| Teryn & Darbi | 69 | $2,920,495 | 7581 | 4.72/5.0 |
Analyzing the strategies of top hosts, such as their property selection, pricing, and guest communication, can offer valuable lessons for optimizing your own Airbnb operations in Nashville-Davidson.
Dive Deeper: Advanced Nashville-Davidson STR Market Data (2026)
Ready to unlock more insights? AirROI provides access to advanced metrics and comprehensive Airbnb data for Nashville-Davidson. Explore detailed analytics beyond this report to refine your investment strategy, optimize pricing, and maximize your vacation rental profits.
Explore Advanced MetricsNashville-Davidson Short-Term Rental Market Composition (2026): Property & Room Types
Room Type Distribution
Property Type Distribution
Market Composition Insights for Nashville-Davidson
- The Nashville-Davidson Airbnb market composition is heavily skewed towards Entire Home/Apt listings, which make up 93.6% of the 6,085 active rentals. This indicates strong guest preference for privacy and space.
- Looking at the property type distribution in Nashville-Davidson, House properties are the most common (55%), reflecting the local real estate landscape.
- Houses represent a significant 55% portion, catering likely to families or larger groups.
- The presence of 5.7% Hotel/Boutique listings indicates integration with traditional hospitality.
- Smaller segments like others, outdoor/unique, unique stays (combined 4.6%) offer potential for unique stay experiences.
Nashville-Davidson Airbnb Room Capacity Analysis (2026): Bedroom Distribution
Distribution of Listings by Number of Bedrooms
Room Capacity Insights for Nashville-Davidson
- The dominant room capacity in Nashville-Davidson is 1 bedroom listings, making up 26.9% of the market. This suggests a strong demand for properties suitable for couples or solo travelers.
- Together, 1 bedroom and 2 bedrooms properties represent 49.6% of the active Airbnb listings in Nashville-Davidson, indicating a high concentration in these sizes.
- A significant 44.5% of listings offer 3+ bedrooms, catering to larger groups and families seeking more space in Nashville-Davidson.
Nashville-Davidson Vacation Rental Guest Capacity Trends (2026)
Distribution of Listings by Guest Capacity
Guest Capacity Insights for Nashville-Davidson
- The most common guest capacity trend in Nashville-Davidson vacation rentals is listings accommodating 8+ guests (44.2%). This suggests the primary traveler segment is likely larger groups.
- Properties designed for 8+ guests and 4 guests dominate the Nashville-Davidson STR market, accounting for 62.6% of listings.
- 62.1% of properties accommodate 6+ guests, serving the market segment for larger families or group travel in Nashville-Davidson.
- On average, properties in Nashville-Davidson are equipped to host 5.8 guests.
Nashville-Davidson Airbnb Booking Patterns (2026): Available vs. Booked Days
Available Days Distribution
Booked Days Distribution
Booking Pattern Insights for Nashville-Davidson
- The most common availability pattern in Nashville-Davidson falls within the 181-270 days range, representing 39.3% of listings. This suggests many properties have significant open periods on their calendars.
- Approximately 70.0% of listings show high availability (181+ days open annually), indicating potential for increased bookings or specific owner usage patterns.
- For booked days, the 91-180 days range is most frequent in Nashville-Davidson (38.6%), reflecting common guest stay durations or potential owner blocking patterns.
- A notable 32.2% of properties secure long booking periods (181+ days booked per year), highlighting successful long-term rental strategies or significant owner usage.
Nashville-Davidson Airbnb Minimum Stay Requirements Analysis
Distribution of Listings by Minimum Night Requirement
1 Night
1522 listings
25% of total
2 Nights
2135 listings
35.1% of total
3 Nights
178 listings
2.9% of total
4-6 Nights
48 listings
0.8% of total
7-29 Nights
149 listings
2.4% of total
30+ Nights
2052 listings
33.7% of total
Key Insights
- The most prevalent minimum stay requirement in Nashville-Davidson is 2 Nights, adopted by 35.1% of listings. This highlights the market's preference for shorter, flexible bookings.
- A strong majority (60.1%) of the Nashville-Davidson Airbnb data shows acceptance of very short stays (1-2 nights), indicating a dynamic, high-turnover market.
- A significant segment (33.7%) caters to monthly stays (30+ nights) in Nashville-Davidson, pointing to opportunities in the extended-stay market.
Recommendations
- Align with the market by considering a 2 Nights minimum stay, as 35.1% of Nashville-Davidson hosts use this setting.
- If feasible, allowing 1-night stays, especially midweek or during low season, could capture last-minute bookings, as only 25% currently do.
- Explore offering discounts for stays of 30+ nights to attract the 33.7% of the market seeking extended stays.
- Adjust minimum nights based on seasonality – potentially shorter during low season and longer during peak demand periods in Nashville-Davidson.
Nashville-Davidson Airbnb Cancellation Policy Trends Analysis (2026)
Refundable
1 listings
0% of total
Non-refundable
2 listings
0% of total
Super Strict 60 Days
41 listings
0.7% of total
Limited
202 listings
3.3% of total
Super Strict 30 Days
241 listings
4% of total
Flexible
722 listings
11.9% of total
Moderate
1539 listings
25.3% of total
Firm
2296 listings
37.8% of total
Strict
1032 listings
17% of total
Cancellation Policy Insights for Nashville-Davidson
- The prevailing Airbnb cancellation policy trend in Nashville-Davidson is Firm, used by 37.8% of listings.
- A majority (54.8%) of hosts in Nashville-Davidson utilize Firm or Strict policies, indicating a market where hosts prioritize booking security.
Recommendations for Hosts
- Consider adopting a Firm policy to align with the 37.8% market standard in Nashville-Davidson.
- Regularly review your cancellation policy against competitors and market demand shifts in Nashville-Davidson.
Nashville-Davidson STR Booking Lead Time Analysis (2026)
Average Booking Lead Time by Month
Booking Lead Time Insights for Nashville-Davidson
- The overall average booking lead time for vacation rentals in Nashville-Davidson is 53 days.
- Guests book furthest in advance for stays during May (average 68 days), likely coinciding with peak travel demand or local events.
- The shortest booking windows occur for stays in January (average 35 days), indicating more last-minute travel plans during this time.
- Seasonally, Fall (60 days avg.) sees the longest lead times, while Winter (40 days avg.) has the shortest, reflecting typical travel planning cycles.
Recommendations for Hosts
- Use the overall average lead time (53 days) as a baseline for your pricing and availability strategy in Nashville-Davidson.
- For May stays, consider implementing length-of-stay discounts or slightly higher rates for bookings made less than 68 days out to capitalize on advance planning.
- Target marketing efforts for the Fall season well in advance (at least 60 days) to capture early planners.
- Monitor your own booking lead times against these Nashville-Davidson averages to identify opportunities for dynamic pricing adjustments.
Popular & Essential Airbnb Amenities in Nashville-Davidson (2026)
Amenity Prevalence
Amenity Insights for Nashville-Davidson
- Essential amenities in Nashville-Davidson that guests expect include: Air conditioning, Wifi, Smoke alarm, TV, Heating, Hot water, Hair dryer, Coffee maker. Lacking these (any) could significantly impact bookings.
- Popular amenities like Essentials, Microwave are common but not universal. Offering these can provide a competitive edge.
Recommendations for Hosts
- Ensure your listing includes all essential amenities for Nashville-Davidson: Air conditioning, Wifi, Smoke alarm, TV, Heating, Hot water, Hair dryer, Coffee maker.
- Prioritize adding missing essentials: Air conditioning, Wifi, Smoke alarm, TV, Heating, Hot water, Hair dryer, Coffee maker.
- Consider adding popular differentiators like Essentials or Microwave to increase appeal.
- Highlight unique or less common amenities you offer (e.g., hot tub, dedicated workspace, EV charger) in your listing description and photos.
- Regularly check competitor amenities in Nashville-Davidson to stay competitive.
Nashville-Davidson Airbnb Guest Demographics & Profile Analysis (2026)
Guest Profile Summary for Nashville-Davidson
- The typical guest profile for Airbnb in Nashville-Davidson consists of primarily domestic travelers (92%), often arriving from nearby Nashville, typically belonging to the Post-2000s (Gen Z/Alpha) group (50%), primarily speaking English or Spanish.
- Domestic travelers account for 92.1% of guests.
- Key international markets include United States (92.1%) and Canada (2.8%).
- Top languages spoken are English (75.9%) followed by Spanish (11.4%).
- A significant demographic segment is the Post-2000s (Gen Z/Alpha) group, representing 50% of guests.
Recommendations for Hosts
- Target domestic marketing efforts towards travelers from Nashville and New York.
- Tailor amenities and listing descriptions to appeal to the dominant Post-2000s (Gen Z/Alpha) demographic (e.g., highlight fast WiFi, smart home features, local guides).
- Highlight unique local experiences or amenities relevant to the primary guest profile.
- Consider seasonal promotions aligned with peak travel times for key origin markets.
Nearby Short-Term Rental Market Comparison
How does the Nashville-Davidson Airbnb market stack up against its neighbors? Compare key performance metrics like average monthly revenue, ADR, and occupancy rates in surrounding areas to understand the broader regional STR landscape.
| Market | Active Properties | Monthly Revenue | Daily Rate | Avg. Occupancy |
|---|---|---|---|---|
| Brentwood | 14 | $4,937 | $601.43 | 47% |
| Berry Hill | 136 | $4,232 | $323.78 | 44% |
| Coxs Creek | 12 | $3,872 | $415.38 | 40% |
| Coalmont | 13 | $3,864 | $240.00 | 52% |
| Bee Spring | 12 | $3,834 | $471.34 | 41% |
| Franklin | 409 | $3,777 | $297.07 | 48% |
| Bloomfield | 11 | $3,611 | $420.13 | 34% |
| Mt. Juliet | 54 | $3,588 | $312.34 | 44% |
| Cub Run | 26 | $3,555 | $291.16 | 46% |
| Pegram | 19 | $3,535 | $254.12 | 45% |