Maynardville Airbnb Market Analysis 2026: Short Term Rental Data & Vacation Rental Statistics in Tennessee, United States
Is Airbnb profitable in Maynardville in 2026? Explore comprehensive Airbnb analytics for Maynardville, Tennessee, United States to uncover income potential. This 2026 STR market report for Maynardville, based on AirROI data from February 2025 to January 2026, reveals key trends in the niche market of 20 active listings.
Whether you're considering an Airbnb investment in Maynardville, optimizing your existing vacation rental, or exploring rental arbitrage opportunities, understanding the Maynardville Airbnb data is crucial. Leveraging the low regulation environment is key to maximizing your short term rental income potential. Let's dive into the specifics.
Key Maynardville Airbnb Performance Metrics Overview
Monthly Airbnb Revenue Variations & Income Potential in Maynardville (2026)
Understanding the monthly revenue variations for Airbnb listings in Maynardville is key to maximizing your short term rental income potential. Seasonality significantly impacts earnings. Our analysis, based on data from the past 12 months, shows that the peak revenue month for STRs in Maynardville is typically July, while January often presents the lowest earnings, highlighting opportunities for strategic pricing adjustments during shoulder and low seasons. Explore the typical Airbnb income in Maynardville across different performance tiers:
- Best-in-class properties (Top 10%) achieve $8,976+ monthly, often utilizing dynamic pricing and superior guest experiences.
- Strong performing properties (Top 25%) earn $6,239 or more, indicating effective management and desirable locations/amenities.
- Typical properties (Median) generate around $3,740 per month, representing the average market performance.
- Entry-level properties (Bottom 25%) see earnings around $1,704, often with potential for optimization.
Average Monthly Airbnb Earnings Trend in Maynardville
Maynardville Airbnb Occupancy Rate Trends (2026)
Maximize your bookings by understanding the Maynardville STR occupancy trends. Seasonal demand shifts significantly influence how often properties are booked. Typically, Julysees the highest demand (peak season occupancy), while January experiences the lowest (low season). Effective strategies, like adjusting minimum stays or offering promotions, can boost occupancy during slower periods. Here's how different property tiers perform in Maynardville:
- Best-in-class properties (Top 10%) achieve 72%+ occupancy, indicating high desirability and potentially optimized availability.
- Strong performing properties (Top 25%) maintain 56% or higher occupancy, suggesting good market fit and guest satisfaction.
- Typical properties (Median) have an occupancy rate around 43%.
- Entry-level properties (Bottom 25%) average 23% occupancy, potentially facing higher vacancy.
Average Monthly Occupancy Rate Trend in Maynardville
Average Daily Rate (ADR) Airbnb Trends in Maynardville (2026)
Effective short term rental pricing strategy in Maynardville involves understanding monthly ADR fluctuations. The Average Daily Rate (ADR) for Airbnb in Maynardville typically peaks in June and dips lowest during February. Leveraging Airbnb dynamic pricing tools or strategies based on this seasonality can significantly boost revenue. Here's a look at the typical nightly rates achieved:
- Best-in-class properties (Top 10%) command rates of $568+ per night, often due to premium features or locations.
- Strong performing properties (Top 25%) achieve nightly rates of $446 or more.
- Typical properties (Median) charge around $336 per night.
- Entry-level properties (Bottom 25%) earn around $275 per night.
Average Daily Rate (ADR) Trend by Month in Maynardville
Get Live Maynardville Market Intelligence 👇

Explore Real-time Analytics
Airbnb Seasonality Analysis & Trends in Maynardville (2026)
Peak Season (July, June, August)
- Revenue averages $7,294 per month
- Occupancy rates average 58.5%
- Daily rates average $408
Shoulder Season
- Revenue averages $4,241 per month
- Occupancy maintains around 40.1%
- Daily rates hold near $358
Low Season (January, February, March)
- Revenue drops to average $1,878 per month
- Occupancy decreases to average 26.0%
- Daily rates adjust to average $325
Seasonality Insights for Maynardville
- The Airbnb seasonality in Maynardville shows highly seasonal trends requiring careful strategy. While the sections above show seasonal averages, it's also insightful to look at the extremes:
- During the high season, the absolute peak month showcases Maynardville's highest earning potential, with monthly revenues capable of climbing to $8,356, occupancy reaching a high of 63.9%, and ADRs peaking at $434.
- Conversely, the slowest single month of the year, typically falling within the low season, marks the market's lowest point. In this month, revenue might dip to $1,811, occupancy could drop to 17.1%, and ADRs may adjust down to $305.
- Understanding both the seasonal averages and these monthly peaks and troughs in revenue, occupancy, and ADR is crucial for maximizing your Airbnb profit potential in Maynardville.
Seasonal Strategies for Maximizing Profit
- Peak Season: Maximize revenue through premium pricing and potentially longer minimum stays. Ensure high availability.
- Low Season: Offer competitive pricing, special promotions (e.g., extended stay discounts), and flexible cancellation policies. Target off-season travelers like remote workers or budget-conscious guests.
- Shoulder Seasons: Implement dynamic pricing that balances peak and low rates. Target weekend travelers or specific events. Offer slightly more flexible terms than peak season.
- Regularly analyze your own performance against these Maynardville seasonality benchmarks and adjust your pricing and availability strategy accordingly.
Best Areas for Airbnb Investment in Maynardville (2026)
Exploring the top neighborhoods for short-term rentals in Maynardville? This section highlights key areas, outlining why they are attractive for hosts and guests, along with notable local attractions. Consider these locations based on your target guest profile and investment strategy.
| Neighborhood / Area | Why Host Here? (Target Guests & Appeal) | Key Attractions & Landmarks |
|---|---|---|
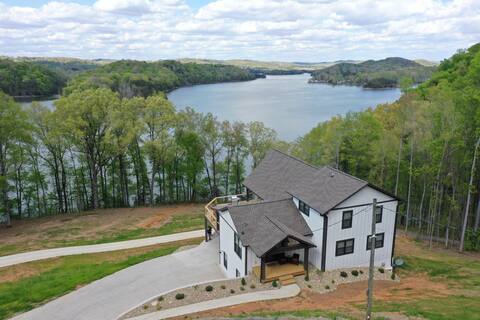
| Norris Lake | A popular destination for water activities and relaxation, offering stunning views and recreational options. Ideal for those seeking a serene getaway with access to outdoor adventures. | Norris Dam State Park, White Pine Beach, Speedboat rentals, Fishing excursions, Hiking trails |
| Historic Downtown Maynardville | Rich in history and local culture, this area attracts visitors interested in the heritage of East Tennessee. Great for hosting travelers looking for a unique and authentic local experience. | Maynardville Museum, Local shops and cafes, Historical landmarks, Community events |
| Twin Cove Resort | A favorite spot for vacationers, this lakeside resort offers numerous amenities and activities. Attractive for families and group travelers looking to enjoy a lake vacation. | Lakeside cabin rentals, Boating and fishing, Swimming area, Picnic spots, Nature trails |
| Big Ridge State Park | A beautiful natural area near Maynardville, ideal for outdoor enthusiasts and nature lovers. Perfect for travelers seeking adventure and exploration in the great outdoors. | Hiking trails, Camping sites, Fishing and boating, Wildlife viewing, Scenic overlooks |
| Sharps Chapel | A quiet and picturesque area close to Norris Lake, appealing to those seeking a tranquil escape from city life. Ideal for Airbnb hosts wanting to attract visitors looking for peace and quiet. | Beautiful lake views, Fishing spots, Cabin rentals, Local dining options |
| Union County | With its charming rural landscapes and proximity to nature, Union County provides a unique experience for visitors interested in exploring East Tennessee's outdoor attractions. | Natural gas tours, Local farm visits, Outdoor recreation, Craft shops, Community festivals |
| Windrock Park | Known for its off-road trails and outdoor sports, this location draws adventure seekers and outdoor enthusiasts. A perfect destination for Airbnb hosts catering to those looking for thrills. | ATV/UTV trails, Camping, Hiking, Events and competitions, Scenic views |
| Claiborne County | Adjacent to Maynardville and known for its scenic beauty and historical sites. It offers a variety of experiences for tourists, especially those wanting to explore the rural charm of Tennessee. | Historic sites, Local wineries, Nature excursions, Festivals, Cultural experiences |
Understanding Airbnb License Requirements & STR Laws in Maynardville (2026)
While Maynardville, Tennessee, United States currently shows low STR regulations, specific Airbnb license requirements might still exist or change. Always verify the latest short term rental regulations and Airbnb license requirements directly with local government authorities for Maynardville to ensure full compliance before hosting.
(Source: AirROI data, 2026, finding no licensed listings among those analyzed)
Top Performing Airbnb Properties in Maynardville (2026)
Benchmark your potential! Explore examples of top-performing Airbnb properties in Maynardvillebased on Trailing Twelve Month (TTM) revenue. Analyze their characteristics, revenue, occupancy rate, and ADR to understand what drives success in this market.

The Black Pearl on Norris Lake
Entire Place • 5 bedrooms
Lakefront Getaway at Swan Seymour w/ Kayaks
Entire Place • 7 bedrooms
Lakefront home at Tumbling Run Estates w/ Kayaks
Entire Place • 5 bedrooms
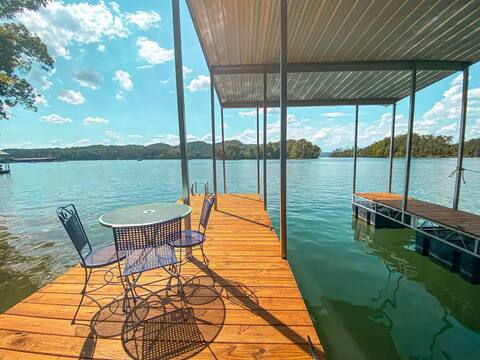
Norris Lakefront: Spectacular Views / Private Dock
Entire Place • 3 bedrooms

Paradise Cove on Norris Lake w/ Kayaks
Entire Place • 4 bedrooms

Lakefront Escape on Norris Lake w/ Kayaks
Entire Place • 3 bedrooms
Note: Performance varies based on location, size, amenities, seasonality, and management quality. Data reflects the past 12 months.
Top Performing Airbnb Hosts in Maynardville (2026)
Learn from the best! This table showcases top-performing Airbnb hosts in Maynardville based on the number of properties managed and estimated total revenue over the past year. Analyze their scale and performance metrics.
| Host Name | Properties | Grossing Revenue | Stay Reviews | Avg Rating |
|---|---|---|---|---|
| Lake Norris Chalets | 8 | $503,264 | 388 | 4.85/5.0 |
| Stuart | 1 | $57,900 | 38 | 4.95/5.0 |
| Logan | 1 | $36,941 | 165 | 4.96/5.0 |
| Shaun | 1 | $36,666 | 3 | 5.00/5.0 |
| Leisa | 1 | $35,184 | 87 | 5.00/5.0 |
| Vacasa Tennessee | 1 | $28,477 | 19 | 4.79/5.0 |
| Vacasa Tennessee | 2 | $21,197 | 90 | 4.74/5.0 |
| Lisa | 1 | $21,096 | 64 | 4.78/5.0 |
| Vacasa Tennessee | 2 | $15,764 | 47 | 4.60/5.0 |
| Ryan | 1 | $14,047 | 78 | 4.95/5.0 |
Analyzing the strategies of top hosts, such as their property selection, pricing, and guest communication, can offer valuable lessons for optimizing your own Airbnb operations in Maynardville.
Dive Deeper: Advanced Maynardville STR Market Data (2026)
Ready to unlock more insights? AirROI provides access to advanced metrics and comprehensive Airbnb data for Maynardville. Explore detailed analytics beyond this report to refine your investment strategy, optimize pricing, and maximize your vacation rental profits.
Explore Advanced MetricsMaynardville Short-Term Rental Market Composition (2026): Property & Room Types
Room Type Distribution
Property Type Distribution
Market Composition Insights for Maynardville
- The Maynardville Airbnb market composition is heavily skewed towards Entire Home/Apt listings, which make up 100% of the 20 active rentals. This indicates strong guest preference for privacy and space.
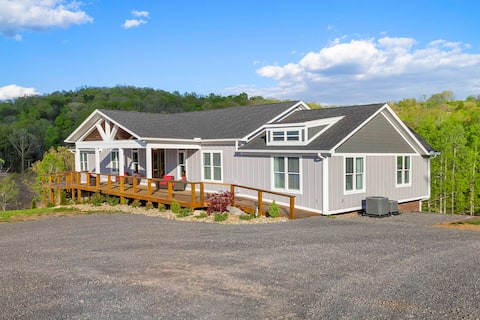
- Looking at the property type distribution in Maynardville, House properties are the most common (95%), reflecting the local real estate landscape.
- Houses represent a significant 95% portion, catering likely to families or larger groups.
Maynardville Airbnb Room Capacity Analysis (2026): Bedroom Distribution
Distribution of Listings by Number of Bedrooms
Room Capacity Insights for Maynardville
- The dominant room capacity in Maynardville is 3 bedrooms listings, making up 45% of the market. This suggests a strong demand for properties suitable for families or small groups.
- Together, 3 bedrooms and 5+ bedrooms properties represent 70.0% of the active Airbnb listings in Maynardville, indicating a high concentration in these sizes.
- A significant 90.0% of listings offer 3+ bedrooms, catering to larger groups and families seeking more space in Maynardville.
Maynardville Vacation Rental Guest Capacity Trends (2026)
Distribution of Listings by Guest Capacity
Guest Capacity Insights for Maynardville
- The most common guest capacity trend in Maynardville vacation rentals is listings accommodating 8+ guests (90%). This suggests the primary traveler segment is likely larger groups.
- Properties designed for 8+ guests and 4 guests dominate the Maynardville STR market, accounting for 95.0% of listings.
- 90.0% of properties accommodate 6+ guests, serving the market segment for larger families or group travel in Maynardville.
- On average, properties in Maynardville are equipped to host 7.7 guests.
Maynardville Airbnb Booking Patterns (2026): Available vs. Booked Days
Available Days Distribution
Booked Days Distribution
Booking Pattern Insights for Maynardville
- The most common availability pattern in Maynardville falls within the 271-366 days range, representing 45% of listings. This suggests many properties have significant open periods on their calendars.
- Approximately 85.0% of listings show high availability (181+ days open annually), indicating potential for increased bookings or specific owner usage patterns.
- For booked days, the 91-180 days range is most frequent in Maynardville (40%), reflecting common guest stay durations or potential owner blocking patterns.
- A notable 15.0% of properties secure long booking periods (181+ days booked per year), highlighting successful long-term rental strategies or significant owner usage.
Maynardville Airbnb Minimum Stay Requirements Analysis
Distribution of Listings by Minimum Night Requirement
1 Night
1 listings
5% of total
2 Nights
3 listings
15% of total
3 Nights
6 listings
30% of total
30+ Nights
10 listings
50% of total
Key Insights
- The most prevalent minimum stay requirement in Maynardville is 30+ Nights, adopted by 50% of listings. This highlights the market's preference for longer commitments.
- A significant segment (50%) caters to monthly stays (30+ nights) in Maynardville, pointing to opportunities in the extended-stay market.
Recommendations
- Align with the market by considering a 30+ Nights minimum stay, as 50% of Maynardville hosts use this setting.
- If feasible, allowing 1-night stays, especially midweek or during low season, could capture last-minute bookings, as only 5% currently do.
- Explore offering discounts for stays of 30+ nights to attract the 50% of the market seeking extended stays.
- Adjust minimum nights based on seasonality – potentially shorter during low season and longer during peak demand periods in Maynardville.
Maynardville Airbnb Cancellation Policy Trends Analysis (2026)
Super Strict 30 Days
4 listings
20% of total
Limited
1 listings
5% of total
Moderate
2 listings
10% of total
Firm
12 listings
60% of total
Strict
1 listings
5% of total
Cancellation Policy Insights for Maynardville
- The prevailing Airbnb cancellation policy trend in Maynardville is Firm, used by 60% of listings.
- A majority (65.0%) of hosts in Maynardville utilize Firm or Strict policies, indicating a market where hosts prioritize booking security.
- Strict cancellation policies are quite rare (5%), potentially making listings with this policy less competitive unless justified by high demand or property type.
Recommendations for Hosts
- Consider adopting a Firm policy to align with the 60% market standard in Maynardville.
- Using a Strict policy might deter some guests, as only 5% of listings use it. Evaluate if potential revenue protection outweighs possible lower booking rates.
- Regularly review your cancellation policy against competitors and market demand shifts in Maynardville.
Maynardville STR Booking Lead Time Analysis (2026)
Average Booking Lead Time by Month
Booking Lead Time Insights for Maynardville
- The overall average booking lead time for vacation rentals in Maynardville is 86 days.
- Guests book furthest in advance for stays during July (average 133 days), likely coinciding with peak travel demand or local events.
- The shortest booking windows occur for stays in March (average 13 days), indicating more last-minute travel plans during this time.
- Seasonally, Summer (113 days avg.) sees the longest lead times, while Winter (63 days avg.) has the shortest, reflecting typical travel planning cycles.
Recommendations for Hosts
- Use the overall average lead time (86 days) as a baseline for your pricing and availability strategy in Maynardville.
- For July stays, consider implementing length-of-stay discounts or slightly higher rates for bookings made less than 133 days out to capitalize on advance planning.
- During March, focus on last-minute booking availability and promotions, as guests book with very short notice (13 days avg.).
- Target marketing efforts for the Summer season well in advance (at least 113 days) to capture early planners.
- Monitor your own booking lead times against these Maynardville averages to identify opportunities for dynamic pricing adjustments.
Popular & Essential Airbnb Amenities in Maynardville (2026)
Amenity Prevalence
No amenities with partial availability (less than 100%) were found to display in the chart. All essential amenities might be present in all listings. Check insights below.
Amenity Insights for Maynardville
- Essential amenities in Maynardville that guests expect include: Hot water, Fire extinguisher, Dryer, Smoke alarm, Heating, Air conditioning, Bed linens, TV, Outdoor furniture, Wifi. Lacking these (any) could significantly impact bookings.
Recommendations for Hosts
- Ensure your listing includes all essential amenities for Maynardville: Hot water, Fire extinguisher, Dryer, Smoke alarm, Heating, Air conditioning, Bed linens, TV, Outdoor furniture, Wifi.
- Highlight unique or less common amenities you offer (e.g., hot tub, dedicated workspace, EV charger) in your listing description and photos.
- Regularly check competitor amenities in Maynardville to stay competitive.
Maynardville Airbnb Guest Demographics & Profile Analysis (2026)
Guest Profile Summary for Maynardville
- The typical guest profile for Airbnb in Maynardville consists of primarily domestic travelers (99%), often arriving from nearby Cincinnati, typically belonging to the Post-2000s (Gen Z/Alpha) group (50%), primarily speaking English or French.
- Domestic travelers account for 98.6% of guests.
- Key international markets include United States (98.6%) and Switzerland (1.4%).
- Top languages spoken are English (93.8%) followed by French (6.3%).
- A significant demographic segment is the Post-2000s (Gen Z/Alpha) group, representing 50% of guests.
Recommendations for Hosts
- Target domestic marketing efforts towards travelers from Cincinnati and Knoxville.
- Tailor amenities and listing descriptions to appeal to the dominant Post-2000s (Gen Z/Alpha) demographic (e.g., highlight fast WiFi, smart home features, local guides).
- Highlight unique local experiences or amenities relevant to the primary guest profile.
- Consider seasonal promotions aligned with peak travel times for key origin markets.
Nearby Short-Term Rental Market Comparison
How does the Maynardville Airbnb market stack up against its neighbors? Compare key performance metrics like average monthly revenue, ADR, and occupancy rates in surrounding areas to understand the broader regional STR landscape.
| Market | Active Properties | Monthly Revenue | Daily Rate | Avg. Occupancy |
|---|---|---|---|---|
| Sevier County | 68 | $7,108 | $567.95 | 44% |
| Union Mills | 15 | $4,938 | $442.76 | 41% |
| Sevierville | 6,269 | $4,747 | $370.20 | 46% |
| Gatlinburg | 3,565 | $4,385 | $353.70 | 45% |
| Pigeon Forge | 2,938 | $4,158 | $337.10 | 45% |
| Wears Valley | 204 | $4,010 | $325.95 | 43% |
| Strawberry Plains | 13 | $3,880 | $222.81 | 54% |
| Highlands | 328 | $3,870 | $402.17 | 37% |
| Fletcher | 113 | $3,859 | $333.95 | 46% |
| Buncombe County | 13 | $3,849 | $317.20 | 45% |