Knoxville Airbnb Market Analysis 2026: Short Term Rental Data & Vacation Rental Statistics in Tennessee, United States
Is Airbnb profitable in Knoxville in 2026? Explore comprehensive Airbnb analytics for Knoxville, Tennessee, United States to uncover income potential. This 2026 STR market report for Knoxville, based on AirROI data from February 2025 to January 2026, reveals key trends in the market of 974 active listings.
Whether you're considering an Airbnb investment in Knoxville, optimizing your existing vacation rental, or exploring rental arbitrage opportunities, understanding the Knoxville Airbnb data is crucial. Leveraging the low regulation environment is key to maximizing your short term rental income potential. Let's dive into the specifics.
Key Knoxville Airbnb Performance Metrics Overview
Monthly Airbnb Revenue Variations & Income Potential in Knoxville (2026)
Understanding the monthly revenue variations for Airbnb listings in Knoxville is key to maximizing your short term rental income potential. Seasonality significantly impacts earnings. Our analysis, based on data from the past 12 months, shows that the peak revenue month for STRs in Knoxville is typically October, while February often presents the lowest earnings, highlighting opportunities for strategic pricing adjustments during shoulder and low seasons. Explore the typical Airbnb income in Knoxville across different performance tiers:
- Best-in-class properties (Top 10%) achieve $5,931+ monthly, often utilizing dynamic pricing and superior guest experiences.
- Strong performing properties (Top 25%) earn $4,033 or more, indicating effective management and desirable locations/amenities.
- Typical properties (Median) generate around $2,464 per month, representing the average market performance.
- Entry-level properties (Bottom 25%) see earnings around $1,361, often with potential for optimization.
Average Monthly Airbnb Earnings Trend in Knoxville
Knoxville Airbnb Occupancy Rate Trends (2026)
Maximize your bookings by understanding the Knoxville STR occupancy trends. Seasonal demand shifts significantly influence how often properties are booked. Typically, Marchsees the highest demand (peak season occupancy), while January experiences the lowest (low season). Effective strategies, like adjusting minimum stays or offering promotions, can boost occupancy during slower periods. Here's how different property tiers perform in Knoxville:
- Best-in-class properties (Top 10%) achieve 81%+ occupancy, indicating high desirability and potentially optimized availability.
- Strong performing properties (Top 25%) maintain 68% or higher occupancy, suggesting good market fit and guest satisfaction.
- Typical properties (Median) have an occupancy rate around 49%.
- Entry-level properties (Bottom 25%) average 29% occupancy, potentially facing higher vacancy.
Average Monthly Occupancy Rate Trend in Knoxville
Average Daily Rate (ADR) Airbnb Trends in Knoxville (2026)
Effective short term rental pricing strategy in Knoxville involves understanding monthly ADR fluctuations. The Average Daily Rate (ADR) for Airbnb in Knoxville typically peaks in October and dips lowest during February. Leveraging Airbnb dynamic pricing tools or strategies based on this seasonality can significantly boost revenue. Here's a look at the typical nightly rates achieved:
- Best-in-class properties (Top 10%) command rates of $360+ per night, often due to premium features or locations.
- Strong performing properties (Top 25%) achieve nightly rates of $239 or more.
- Typical properties (Median) charge around $159 per night.
- Entry-level properties (Bottom 25%) earn around $104 per night.
Average Daily Rate (ADR) Trend by Month in Knoxville
Get Live Knoxville Market Intelligence 👇

Explore Real-time Analytics
Airbnb Seasonality Analysis & Trends in Knoxville (2026)
Peak Season (October, November, September)
- Revenue averages $3,608 per month
- Occupancy rates average 45.8%
- Daily rates average $232
Shoulder Season
- Revenue averages $3,197 per month
- Occupancy maintains around 51.5%
- Daily rates hold near $190
Low Season (January, February, April)
- Revenue drops to average $2,341 per month
- Occupancy decreases to average 43.7%
- Daily rates adjust to average $178
Seasonality Insights for Knoxville
- The Airbnb seasonality in Knoxville shows moderate seasonality with distinct peak and low periods. While the sections above show seasonal averages, it's also insightful to look at the extremes:
- During the high season, the absolute peak month showcases Knoxville's highest earning potential, with monthly revenues capable of climbing to $3,895, occupancy reaching a high of 54.1%, and ADRs peaking at $234.
- Conversely, the slowest single month of the year, typically falling within the low season, marks the market's lowest point. In this month, revenue might dip to $2,158, occupancy could drop to 36.0%, and ADRs may adjust down to $164.
- Understanding both the seasonal averages and these monthly peaks and troughs in revenue, occupancy, and ADR is crucial for maximizing your Airbnb profit potential in Knoxville.
Seasonal Strategies for Maximizing Profit
- Peak Season: Maximize revenue through premium pricing and potentially longer minimum stays. Ensure high availability.
- Low Season: Offer competitive pricing, special promotions (e.g., extended stay discounts), and flexible cancellation policies. Target off-season travelers like remote workers or budget-conscious guests.
- Shoulder Seasons: Implement dynamic pricing that balances peak and low rates. Target weekend travelers or specific events. Offer slightly more flexible terms than peak season.
- Regularly analyze your own performance against these Knoxville seasonality benchmarks and adjust your pricing and availability strategy accordingly.
Best Areas for Airbnb Investment in Knoxville (2026)
Exploring the top neighborhoods for short-term rentals in Knoxville? This section highlights key areas, outlining why they are attractive for hosts and guests, along with notable local attractions. Consider these locations based on your target guest profile and investment strategy.
| Neighborhood / Area | Why Host Here? (Target Guests & Appeal) | Key Attractions & Landmarks |
|---|---|---|
| Downtown Knoxville | The vibrant heart of the city, offering a mix of culture, dining, and entertainment. Downtown Knoxville is popular with tourists and locals alike, featuring festivals and events year-round. | Knoxville Museum of Art, Tennessee Theatre, Market Square, World's Fair Park, The Sunsphere |
| Old City | A historic area known for its nightlife and unique dining options, Old City attracts a younger crowd and offers a variety of bars, music venues, and art galleries. | Old City Historic District, The International, The Pilot Light, The Square Room |
| North Knoxville | This up-and-coming area features a mix of residential neighborhoods and commercial spaces, appealing to families and individuals looking for value and community. | Knoxville Zoo, The Museum of Science and Energy, Local parks and recreation areas |
| West Knoxville | A suburban area known for its shopping, dining, and family-friendly atmosphere. West Knoxville attracts families and those looking for quieter accommodations. | Turkey Creek, West Town Mall, Ijam's Nature Center, Local parks |
| South Knoxville | A historical area experiencing renovation and growth, South Knoxville is close to the waterfront and offers beautiful views along with outdoor activities. | Ijams Nature Center, Tennessee River, The Knoxville Botanical Garden |
| Sequoyah Hills | An upscale neighborhood known for its beautiful homes, river views, and proximity to the city. Ideal for those seeking a quieter and more luxurious stay. | Knoxville Convention Center, Sequoyah Park, Waterfront Park |
| Fountain City | A close-knit community known for its parks and local attractions, providing a friendly atmosphere away from the bustle of the city. | Fountain City Park, The Fountain City Art Center |
| University of Tennessee | Home to a large student population and a variety of events, this area is ideal for visitors attending sporting events, concerts, and university activities. | Neyland Stadium, UT Gardens, Thompson-Boling Arena |
Understanding Airbnb License Requirements & STR Laws in Knoxville (2026)
While Knoxville, Tennessee, United States currently shows low STR regulations, specific Airbnb license requirements might still exist or change. Always verify the latest short term rental regulations and Airbnb license requirements directly with local government authorities for Knoxville to ensure full compliance before hosting.
(Source: AirROI data, 2026, based on 0% licensed listings)
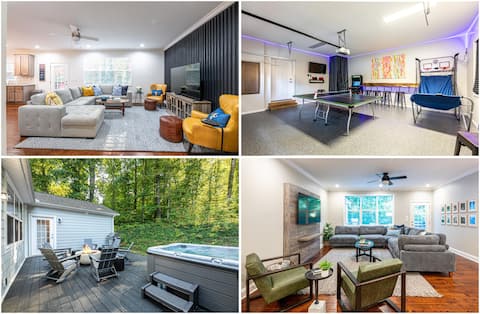
Top Performing Airbnb Properties in Knoxville (2026)
Benchmark your potential! Explore examples of top-performing Airbnb properties in Knoxvillebased on Trailing Twelve Month (TTM) revenue. Analyze their characteristics, revenue, occupancy rate, and ADR to understand what drives success in this market.

Friedman’s Loft | Ultimate Luxury Downtown Stay
Entire Place • 6 bedrooms
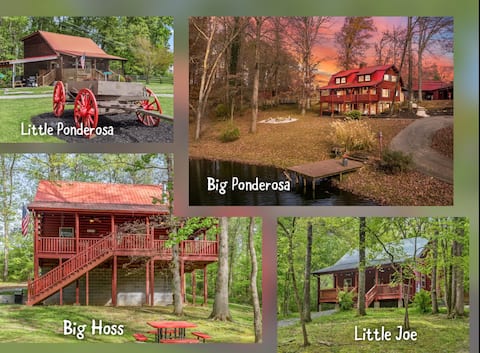
4 Log Cabins, 16acres near UTK, sleeps 31, fishing
Entire Place • 11 bedrooms

Heaven - Hot Tub, Pool Table, Pool, View, Steam
Entire Place • 5 bedrooms

LARGE Historic Home near UT & Downtown | Sleeps 16
Entire Place • 6 bedrooms
2 Secluded Homes~One Big Party~Hot tubs
Entire Place • 8 bedrooms

Amazing heart of Market Square Luxury Experience
Entire Place • 3 bedrooms
Note: Performance varies based on location, size, amenities, seasonality, and management quality. Data reflects the past 12 months.
Top Performing Airbnb Hosts in Knoxville (2026)
Learn from the best! This table showcases top-performing Airbnb hosts in Knoxville based on the number of properties managed and estimated total revenue over the past year. Analyze their scale and performance metrics.
| Host Name | Properties | Grossing Revenue | Stay Reviews | Avg Rating |
|---|---|---|---|---|
| Halo | 59 | $2,514,287 | 6360 | 4.78/5.0 |
| Dylan And Suzanne | 32 | $1,645,083 | 5134 | 4.76/5.0 |
| Lodgic | 14 | $1,056,014 | 2392 | 4.93/5.0 |
| The Vacation Company | 17 | $608,011 | 320 | 4.81/5.0 |
| Kristiana | 3 | $508,416 | 599 | 4.94/5.0 |
| Christopher | 9 | $486,609 | 682 | 4.98/5.0 |
| Evolve | 16 | $486,043 | 461 | 4.68/5.0 |
| Terry | 8 | $440,111 | 950 | 4.90/5.0 |
| AnneAlyse | 7 | $367,896 | 2971 | 4.92/5.0 |
| Kristy | 13 | $309,753 | 2061 | 4.61/5.0 |
Analyzing the strategies of top hosts, such as their property selection, pricing, and guest communication, can offer valuable lessons for optimizing your own Airbnb operations in Knoxville.
Dive Deeper: Advanced Knoxville STR Market Data (2026)
Ready to unlock more insights? AirROI provides access to advanced metrics and comprehensive Airbnb data for Knoxville. Explore detailed analytics beyond this report to refine your investment strategy, optimize pricing, and maximize your vacation rental profits.
Explore Advanced MetricsKnoxville Short-Term Rental Market Composition (2026): Property & Room Types
Room Type Distribution
Property Type Distribution
Market Composition Insights for Knoxville
- The Knoxville Airbnb market composition is heavily skewed towards Entire Home/Apt listings, which make up 90.8% of the 974 active rentals. This indicates strong guest preference for privacy and space.
- Looking at the property type distribution in Knoxville, House properties are the most common (60.6%), reflecting the local real estate landscape.
- Houses represent a significant 60.6% portion, catering likely to families or larger groups.
- Smaller segments like outdoor/unique, hotel/boutique, unique stays (combined 7.5%) offer potential for unique stay experiences.
Knoxville Airbnb Room Capacity Analysis (2026): Bedroom Distribution
Distribution of Listings by Number of Bedrooms
Room Capacity Insights for Knoxville
- The dominant room capacity in Knoxville is 2 bedrooms listings, making up 28.3% of the market. This suggests a strong demand for properties suitable for couples or solo travelers.
- Together, 2 bedrooms and 1 bedroom properties represent 53.7% of the active Airbnb listings in Knoxville, indicating a high concentration in these sizes.
- A significant 34.4% of listings offer 3+ bedrooms, catering to larger groups and families seeking more space in Knoxville.
Knoxville Vacation Rental Guest Capacity Trends (2026)
Distribution of Listings by Guest Capacity
Guest Capacity Insights for Knoxville
- The most common guest capacity trend in Knoxville vacation rentals is listings accommodating 4 guests (24.6%). This suggests the primary traveler segment is likely small families or groups.
- Properties designed for 4 guests and 8+ guests dominate the Knoxville STR market, accounting for 45.5% of listings.
- 45.1% of properties accommodate 6+ guests, serving the market segment for larger families or group travel in Knoxville.
- On average, properties in Knoxville are equipped to host 4.8 guests.
Knoxville Airbnb Booking Patterns (2026): Available vs. Booked Days
Available Days Distribution
Booked Days Distribution
Booking Pattern Insights for Knoxville
- The most common availability pattern in Knoxville falls within the 181-270 days range, representing 35.8% of listings. This suggests many properties have significant open periods on their calendars.
- Approximately 66.1% of listings show high availability (181+ days open annually), indicating potential for increased bookings or specific owner usage patterns.
- For booked days, the 91-180 days range is most frequent in Knoxville (35.2%), reflecting common guest stay durations or potential owner blocking patterns.
- A notable 35.6% of properties secure long booking periods (181+ days booked per year), highlighting successful long-term rental strategies or significant owner usage.
Knoxville Airbnb Minimum Stay Requirements Analysis
Distribution of Listings by Minimum Night Requirement
1 Night
362 listings
37.2% of total
2 Nights
203 listings
20.9% of total
3 Nights
18 listings
1.8% of total
4-6 Nights
15 listings
1.5% of total
7-29 Nights
56 listings
5.8% of total
30+ Nights
319 listings
32.8% of total
Key Insights
- The most prevalent minimum stay requirement in Knoxville is 1 Night, adopted by 37.2% of listings. This highlights the market's preference for shorter, flexible bookings.
- A significant segment (32.8%) caters to monthly stays (30+ nights) in Knoxville, pointing to opportunities in the extended-stay market.
Recommendations
- Align with the market by considering a 1 Night minimum stay, as 37.2% of Knoxville hosts use this setting.
- Explore offering discounts for stays of 30+ nights to attract the 32.8% of the market seeking extended stays.
- Adjust minimum nights based on seasonality – potentially shorter during low season and longer during peak demand periods in Knoxville.
Knoxville Airbnb Cancellation Policy Trends Analysis (2026)
Super Strict 30 Days
3 listings
0.3% of total
Limited
20 listings
2.1% of total
Super Strict 60 Days
7 listings
0.7% of total
Flexible
189 listings
19.4% of total
Moderate
248 listings
25.5% of total
Firm
393 listings
40.4% of total
Strict
112 listings
11.5% of total
Cancellation Policy Insights for Knoxville
- The prevailing Airbnb cancellation policy trend in Knoxville is Firm, used by 40.4% of listings.
- A majority (51.9%) of hosts in Knoxville utilize Firm or Strict policies, indicating a market where hosts prioritize booking security.
Recommendations for Hosts
- Consider adopting a Firm policy to align with the 40.4% market standard in Knoxville.
- Using a Strict policy might deter some guests, as only 11.5% of listings use it. Evaluate if potential revenue protection outweighs possible lower booking rates.
- Regularly review your cancellation policy against competitors and market demand shifts in Knoxville.
Knoxville STR Booking Lead Time Analysis (2026)
Average Booking Lead Time by Month
Booking Lead Time Insights for Knoxville
- The overall average booking lead time for vacation rentals in Knoxville is 44 days.
- Guests book furthest in advance for stays during October (average 69 days), likely coinciding with peak travel demand or local events.
- The shortest booking windows occur for stays in February (average 23 days), indicating more last-minute travel plans during this time.
- Seasonally, Fall (62 days avg.) sees the longest lead times, while Winter (29 days avg.) has the shortest, reflecting typical travel planning cycles.
Recommendations for Hosts
- Use the overall average lead time (44 days) as a baseline for your pricing and availability strategy in Knoxville.
- For October stays, consider implementing length-of-stay discounts or slightly higher rates for bookings made less than 69 days out to capitalize on advance planning.
- Target marketing efforts for the Fall season well in advance (at least 62 days) to capture early planners.
- Monitor your own booking lead times against these Knoxville averages to identify opportunities for dynamic pricing adjustments.
Popular & Essential Airbnb Amenities in Knoxville (2026)
Amenity Prevalence
Amenity Insights for Knoxville
- Essential amenities in Knoxville that guests expect include: Air conditioning, Wifi, Smoke alarm, TV. Lacking these (any) could significantly impact bookings.
- Popular amenities like Heating, Kitchen, Hot water are common but not universal. Offering these can provide a competitive edge.
Recommendations for Hosts
- Ensure your listing includes all essential amenities for Knoxville: Air conditioning, Wifi, Smoke alarm, TV.
- Prioritize adding missing essentials: Air conditioning, Wifi, Smoke alarm, TV.
- Consider adding popular differentiators like Heating or Kitchen to increase appeal.
- Highlight unique or less common amenities you offer (e.g., hot tub, dedicated workspace, EV charger) in your listing description and photos.
- Regularly check competitor amenities in Knoxville to stay competitive.
Knoxville Airbnb Guest Demographics & Profile Analysis (2026)
Guest Profile Summary for Knoxville
- The typical guest profile for Airbnb in Knoxville consists of primarily domestic travelers (97%), often arriving from nearby Knoxville, typically belonging to the Post-2000s (Gen Z/Alpha) group (50%), primarily speaking English or Spanish.
- Domestic travelers account for 97.1% of guests.
- Key international markets include United States (97.1%) and Canada (0.5%).
- Top languages spoken are English (78.6%) followed by Spanish (11.2%).
- A significant demographic segment is the Post-2000s (Gen Z/Alpha) group, representing 50% of guests.
Recommendations for Hosts
- Target domestic marketing efforts towards travelers from Knoxville and Nashville.
- Tailor amenities and listing descriptions to appeal to the dominant Post-2000s (Gen Z/Alpha) demographic (e.g., highlight fast WiFi, smart home features, local guides).
- Highlight unique local experiences or amenities relevant to the primary guest profile.
- Consider seasonal promotions aligned with peak travel times for key origin markets.
Nearby Short-Term Rental Market Comparison
How does the Knoxville Airbnb market stack up against its neighbors? Compare key performance metrics like average monthly revenue, ADR, and occupancy rates in surrounding areas to understand the broader regional STR landscape.
| Market | Active Properties | Monthly Revenue | Daily Rate | Avg. Occupancy |
|---|---|---|---|---|
| Sevier County | 68 | $7,108 | $567.95 | 44% |
| Gilmer County | 26 | $5,298 | $459.59 | 40% |
| Union Mills | 15 | $4,938 | $442.76 | 41% |
| Sevierville | 6,269 | $4,747 | $370.20 | 46% |
| Fannin County | 42 | $4,574 | $435.93 | 38% |
| East Ellijay | 15 | $4,415 | $368.05 | 41% |
| Epworth | 79 | $4,411 | $406.97 | 40% |
| Six Mile | 57 | $4,396 | $449.78 | 42% |
| Gatlinburg | 3,565 | $4,385 | $353.70 | 45% |
| Commerce | 19 | $4,298 | $285.34 | 45% |