Gallatin Airbnb Market Analysis 2026: Short Term Rental Data & Vacation Rental Statistics in Tennessee, United States
Is Airbnb profitable in Gallatin in 2026? Explore comprehensive Airbnb analytics for Gallatin, Tennessee, United States to uncover income potential. This 2026 STR market report for Gallatin, based on AirROI data from February 2025 to January 2026, reveals key trends in the niche market of 99 active listings.
Whether you're considering an Airbnb investment in Gallatin, optimizing your existing vacation rental, or exploring rental arbitrage opportunities, understanding the Gallatin Airbnb data is crucial. Leveraging the low regulation environment is key to maximizing your short term rental income potential. Let's dive into the specifics.
Key Gallatin Airbnb Performance Metrics Overview
Monthly Airbnb Revenue Variations & Income Potential in Gallatin (2026)
Understanding the monthly revenue variations for Airbnb listings in Gallatin is key to maximizing your short term rental income potential. Seasonality significantly impacts earnings. Our analysis, based on data from the past 12 months, shows that the peak revenue month for STRs in Gallatin is typically July, while February often presents the lowest earnings, highlighting opportunities for strategic pricing adjustments during shoulder and low seasons. Explore the typical Airbnb income in Gallatin across different performance tiers:
- Best-in-class properties (Top 10%) achieve $8,059+ monthly, often utilizing dynamic pricing and superior guest experiences.
- Strong performing properties (Top 25%) earn $4,789 or more, indicating effective management and desirable locations/amenities.
- Typical properties (Median) generate around $2,837 per month, representing the average market performance.
- Entry-level properties (Bottom 25%) see earnings around $1,656, often with potential for optimization.
Average Monthly Airbnb Earnings Trend in Gallatin
Gallatin Airbnb Occupancy Rate Trends (2026)
Maximize your bookings by understanding the Gallatin STR occupancy trends. Seasonal demand shifts significantly influence how often properties are booked. Typically, Julysees the highest demand (peak season occupancy), while January experiences the lowest (low season). Effective strategies, like adjusting minimum stays or offering promotions, can boost occupancy during slower periods. Here's how different property tiers perform in Gallatin:
- Best-in-class properties (Top 10%) achieve 78%+ occupancy, indicating high desirability and potentially optimized availability.
- Strong performing properties (Top 25%) maintain 64% or higher occupancy, suggesting good market fit and guest satisfaction.
- Typical properties (Median) have an occupancy rate around 45%.
- Entry-level properties (Bottom 25%) average 28% occupancy, potentially facing higher vacancy.
Average Monthly Occupancy Rate Trend in Gallatin
Average Daily Rate (ADR) Airbnb Trends in Gallatin (2026)
Effective short term rental pricing strategy in Gallatin involves understanding monthly ADR fluctuations. The Average Daily Rate (ADR) for Airbnb in Gallatin typically peaks in June and dips lowest during February. Leveraging Airbnb dynamic pricing tools or strategies based on this seasonality can significantly boost revenue. Here's a look at the typical nightly rates achieved:
- Best-in-class properties (Top 10%) command rates of $566+ per night, often due to premium features or locations.
- Strong performing properties (Top 25%) achieve nightly rates of $327 or more.
- Typical properties (Median) charge around $209 per night.
- Entry-level properties (Bottom 25%) earn around $146 per night.
Average Daily Rate (ADR) Trend by Month in Gallatin
Get Live Gallatin Market Intelligence 👇

Explore Real-time Analytics
Airbnb Seasonality Analysis & Trends in Gallatin (2026)
Peak Season (July, June, October)
- Revenue averages $5,214 per month
- Occupancy rates average 56.0%
- Daily rates average $316
Shoulder Season
- Revenue averages $3,618 per month
- Occupancy maintains around 44.4%
- Daily rates hold near $305
Low Season (January, February, April)
- Revenue drops to average $2,740 per month
- Occupancy decreases to average 38.8%
- Daily rates adjust to average $283
Seasonality Insights for Gallatin
- The Airbnb seasonality in Gallatin shows highly seasonal trends requiring careful strategy. While the sections above show seasonal averages, it's also insightful to look at the extremes:
- During the high season, the absolute peak month showcases Gallatin's highest earning potential, with monthly revenues capable of climbing to $5,860, occupancy reaching a high of 62.0%, and ADRs peaking at $327.
- Conversely, the slowest single month of the year, typically falling within the low season, marks the market's lowest point. In this month, revenue might dip to $2,467, occupancy could drop to 34.8%, and ADRs may adjust down to $277.
- Understanding both the seasonal averages and these monthly peaks and troughs in revenue, occupancy, and ADR is crucial for maximizing your Airbnb profit potential in Gallatin.
Seasonal Strategies for Maximizing Profit
- Peak Season: Maximize revenue through premium pricing and potentially longer minimum stays. Ensure high availability.
- Low Season: Offer competitive pricing, special promotions (e.g., extended stay discounts), and flexible cancellation policies. Target off-season travelers like remote workers or budget-conscious guests.
- Shoulder Seasons: Implement dynamic pricing that balances peak and low rates. Target weekend travelers or specific events. Offer slightly more flexible terms than peak season.
- Regularly analyze your own performance against these Gallatin seasonality benchmarks and adjust your pricing and availability strategy accordingly.
Best Areas for Airbnb Investment in Gallatin (2026)
Exploring the top neighborhoods for short-term rentals in Gallatin? This section highlights key areas, outlining why they are attractive for hosts and guests, along with notable local attractions. Consider these locations based on your target guest profile and investment strategy.
| Neighborhood / Area | Why Host Here? (Target Guests & Appeal) | Key Attractions & Landmarks |
|---|---|---|
| Long Hollow | A suburban area with a blend of serene residential neighborhoods and quick access to local amenities, making it appealing for families and long-term stays. | Long Hollow Golf Course, Gallatin Civic Center, Nearby parks and recreational areas |
| Downtown Gallatin | The historic heart of Gallatin with charming shops, restaurants, and a vibrant arts scene. It's perfect for guests looking to explore local culture and history. | Historic Gallatin Square, Sumner County Museum, The Palace Theater |
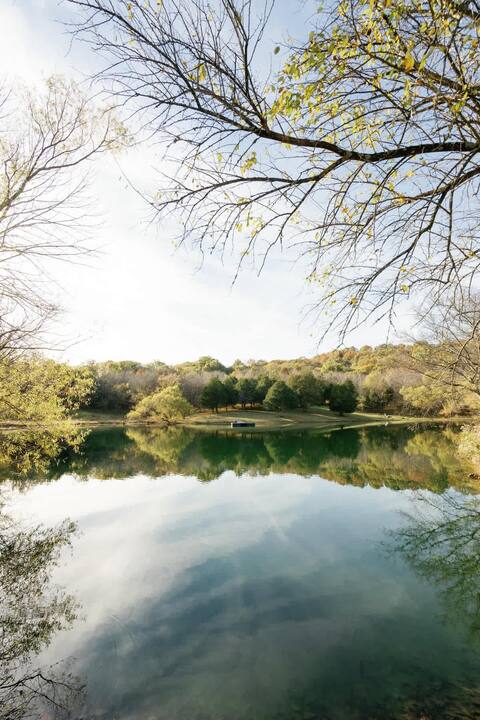
| Lake Sumner | A picturesque locale offering outdoor activities, waterfront views, and a tranquil atmosphere, ideal for nature lovers and travelers seeking relaxation. | Old Hickory Lake, Dodge's Store, Waterfront parks, Fishing spots |
| Amqui Station | A revitalized area focusing on community and recreation, with access to trails and parks, attracting both active travelers and families. | Amqui Station and Visitor's Center, Neighborhood parks, Community events and festivals |
| Moss Farms | A rural but accessible area offering a unique, tranquil experience with farm stay options and connection to nature, appealing to those seeking a getaway. | Local farms, Nature walks, Countryside views |
| South Gallatin | Residing near essential amenities and recreational areas, this area appeals to visitors wanting both accessibility and a relaxing environment. | Cumberland River access, Community parks, Shopping centers |
| Pheasant Run | A friendly residential community with a variety of family-oriented activities and convenience, great for longer stays with families. | Pheasant Run Park, Local schools, Community events |
| Shady Grove | A serene environment near lakes and outdoor activities, popular with nature enthusiasts and those looking for peaceful vacations. | Nearby lakes, Hiking trails, Picnic areas |
Understanding Airbnb License Requirements & STR Laws in Gallatin (2026)
While Gallatin, Tennessee, United States currently shows low STR regulations, specific Airbnb license requirements might still exist or change. Always verify the latest short term rental regulations and Airbnb license requirements directly with local government authorities for Gallatin to ensure full compliance before hosting.
(Source: AirROI data, 2026, finding no licensed listings among those analyzed)
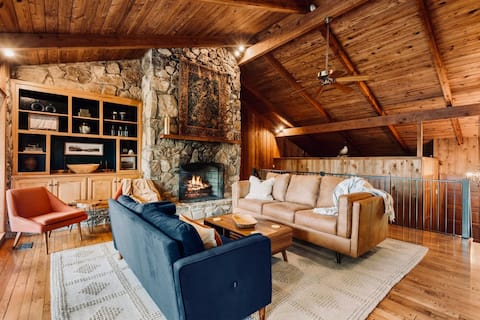
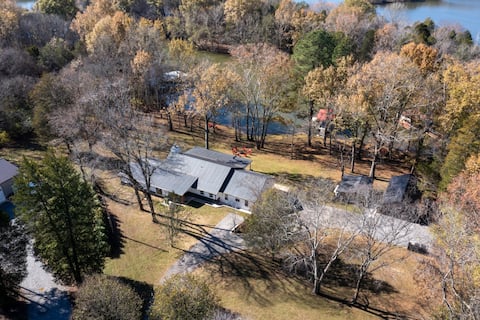
Top Performing Airbnb Properties in Gallatin (2026)
Benchmark your potential! Explore examples of top-performing Airbnb properties in Gallatinbased on Trailing Twelve Month (TTM) revenue. Analyze their characteristics, revenue, occupancy rate, and ADR to understand what drives success in this market.
Chic Lakefront Home|6 bdrm/4bath & Private Dock!
Entire Place • 6 bedrooms
Urban Rustic Lakeside Retreat with Dock Sleeps 20
Entire Place • 5 bedrooms
50 Acre Lux Cabin w Private Lake Pool Sauna
Entire Place • 5 bedrooms

Casa Vino - Farmhouse 30 mins North of Nashville
Entire Place • 5 bedrooms

Cozy Lake Cottage | Peaceful Views & Firelight
Entire Place • 4 bedrooms

Lake Front Beauty North of Nashville
Entire Place • 4 bedrooms
Note: Performance varies based on location, size, amenities, seasonality, and management quality. Data reflects the past 12 months.
Top Performing Airbnb Hosts in Gallatin (2026)
Learn from the best! This table showcases top-performing Airbnb hosts in Gallatin based on the number of properties managed and estimated total revenue over the past year. Analyze their scale and performance metrics.
| Host Name | Properties | Grossing Revenue | Stay Reviews | Avg Rating |
|---|---|---|---|---|
| Jonny | 9 | $692,632 | 404 | 4.87/5.0 |
| Ashley | 1 | $176,019 | 36 | 4.94/5.0 |
| Diana And William | 4 | $165,741 | 19 | 4.85/5.0 |
| Ashley | 4 | $148,991 | 252 | 4.89/5.0 |
| Don & Dora | 2 | $134,098 | 99 | 4.94/5.0 |
| Liz | 1 | $120,665 | 7 | 5.00/5.0 |
| Premier Management | 5 | $115,579 | 208 | 4.92/5.0 |
| Evolve | 3 | $110,685 | 158 | 4.79/5.0 |
| Austin | 3 | $108,906 | 127 | 4.96/5.0 |
| Elite Stay | 2 | $93,683 | 244 | 4.87/5.0 |
Analyzing the strategies of top hosts, such as their property selection, pricing, and guest communication, can offer valuable lessons for optimizing your own Airbnb operations in Gallatin.
Dive Deeper: Advanced Gallatin STR Market Data (2026)
Ready to unlock more insights? AirROI provides access to advanced metrics and comprehensive Airbnb data for Gallatin. Explore detailed analytics beyond this report to refine your investment strategy, optimize pricing, and maximize your vacation rental profits.
Explore Advanced MetricsGallatin Short-Term Rental Market Composition (2026): Property & Room Types
Room Type Distribution
Property Type Distribution
Market Composition Insights for Gallatin
- The Gallatin Airbnb market composition is heavily skewed towards Entire Home/Apt listings, which make up 96% of the 99 active rentals. This indicates strong guest preference for privacy and space.
- Looking at the property type distribution in Gallatin, House properties are the most common (72.7%), reflecting the local real estate landscape.
- Houses represent a significant 72.7% portion, catering likely to families or larger groups.
- The presence of 5.1% Hotel/Boutique listings indicates integration with traditional hospitality.
- Smaller segments like unique stays (combined 1.0%) offer potential for unique stay experiences.
Gallatin Airbnb Room Capacity Analysis (2026): Bedroom Distribution
Distribution of Listings by Number of Bedrooms
Room Capacity Insights for Gallatin
- The dominant room capacity in Gallatin is 3 bedrooms listings, making up 31.3% of the market. This suggests a strong demand for properties suitable for families or small groups.
- Together, 3 bedrooms and 2 bedrooms properties represent 52.5% of the active Airbnb listings in Gallatin, indicating a high concentration in these sizes.
- A significant 59.6% of listings offer 3+ bedrooms, catering to larger groups and families seeking more space in Gallatin.
Gallatin Vacation Rental Guest Capacity Trends (2026)
Distribution of Listings by Guest Capacity
Guest Capacity Insights for Gallatin
- The most common guest capacity trend in Gallatin vacation rentals is listings accommodating 8+ guests (45.5%). This suggests the primary traveler segment is likely larger groups.
- Properties designed for 8+ guests and 6 guests dominate the Gallatin STR market, accounting for 67.7% of listings.
- 70.7% of properties accommodate 6+ guests, serving the market segment for larger families or group travel in Gallatin.
- On average, properties in Gallatin are equipped to host 6.1 guests.
Gallatin Airbnb Booking Patterns (2026): Available vs. Booked Days
Available Days Distribution
Booked Days Distribution
Booking Pattern Insights for Gallatin
- The most common availability pattern in Gallatin falls within the 181-270 days range, representing 35.4% of listings. This suggests many properties have significant open periods on their calendars.
- Approximately 68.7% of listings show high availability (181+ days open annually), indicating potential for increased bookings or specific owner usage patterns.
- For booked days, the 91-180 days range is most frequent in Gallatin (37.4%), reflecting common guest stay durations or potential owner blocking patterns.
- A notable 32.3% of properties secure long booking periods (181+ days booked per year), highlighting successful long-term rental strategies or significant owner usage.
Gallatin Airbnb Minimum Stay Requirements Analysis
Distribution of Listings by Minimum Night Requirement
1 Night
12 listings
12.1% of total
2 Nights
44 listings
44.4% of total
3 Nights
8 listings
8.1% of total
7-29 Nights
4 listings
4% of total
30+ Nights
31 listings
31.3% of total
Key Insights
- The most prevalent minimum stay requirement in Gallatin is 2 Nights, adopted by 44.4% of listings. This highlights the market's preference for shorter, flexible bookings.
- A significant segment (31.3%) caters to monthly stays (30+ nights) in Gallatin, pointing to opportunities in the extended-stay market.
Recommendations
- Align with the market by considering a 2 Nights minimum stay, as 44.4% of Gallatin hosts use this setting.
- If feasible, allowing 1-night stays, especially midweek or during low season, could capture last-minute bookings, as only 12.1% currently do.
- A 2-night minimum appears standard (44.4%). Consider this for weekends or peak periods.
- Explore offering discounts for stays of 30+ nights to attract the 31.3% of the market seeking extended stays.
- Adjust minimum nights based on seasonality – potentially shorter during low season and longer during peak demand periods in Gallatin.
Gallatin Airbnb Cancellation Policy Trends Analysis (2026)
Super Strict 30 Days
5 listings
5.1% of total
Super Strict 60 Days
3 listings
3% of total
Limited
1 listings
1% of total
Flexible
10 listings
10.1% of total
Moderate
29 listings
29.3% of total
Firm
35 listings
35.4% of total
Strict
16 listings
16.2% of total
Cancellation Policy Insights for Gallatin
- The prevailing Airbnb cancellation policy trend in Gallatin is Firm, used by 35.4% of listings.
- A majority (51.6%) of hosts in Gallatin utilize Firm or Strict policies, indicating a market where hosts prioritize booking security.
Recommendations for Hosts
- Consider adopting a Firm policy to align with the 35.4% market standard in Gallatin.
- Regularly review your cancellation policy against competitors and market demand shifts in Gallatin.
Gallatin STR Booking Lead Time Analysis (2026)
Average Booking Lead Time by Month
Booking Lead Time Insights for Gallatin
- The overall average booking lead time for vacation rentals in Gallatin is 42 days.
- Guests book furthest in advance for stays during July (average 66 days), likely coinciding with peak travel demand or local events.
- The shortest booking windows occur for stays in January (average 21 days), indicating more last-minute travel plans during this time.
- Seasonally, Summer (60 days avg.) sees the longest lead times, while Winter (31 days avg.) has the shortest, reflecting typical travel planning cycles.
Recommendations for Hosts
- Use the overall average lead time (42 days) as a baseline for your pricing and availability strategy in Gallatin.
- For July stays, consider implementing length-of-stay discounts or slightly higher rates for bookings made less than 66 days out to capitalize on advance planning.
- Target marketing efforts for the Summer season well in advance (at least 60 days) to capture early planners.
- Monitor your own booking lead times against these Gallatin averages to identify opportunities for dynamic pricing adjustments.
Popular & Essential Airbnb Amenities in Gallatin (2026)
Amenity Prevalence
Amenity Insights for Gallatin
- Essential amenities in Gallatin that guests expect include: Wifi, TV, Air conditioning, Smoke alarm, Heating, Free parking on premises. Lacking these (any) could significantly impact bookings.
- Popular amenities like Microwave, Kitchen, Hot water are common but not universal. Offering these can provide a competitive edge.
Recommendations for Hosts
- Ensure your listing includes all essential amenities for Gallatin: Wifi, TV, Air conditioning, Smoke alarm, Heating, Free parking on premises.
- Prioritize adding missing essentials: Smoke alarm, Heating, Free parking on premises.
- Consider adding popular differentiators like Microwave or Kitchen to increase appeal.
- Highlight unique or less common amenities you offer (e.g., hot tub, dedicated workspace, EV charger) in your listing description and photos.
- Regularly check competitor amenities in Gallatin to stay competitive.
Gallatin Airbnb Guest Demographics & Profile Analysis (2026)
Guest Profile Summary for Gallatin
- The typical guest profile for Airbnb in Gallatin consists of primarily domestic travelers (98%), often arriving from nearby Nashville, typically belonging to the Post-2000s (Gen Z/Alpha) group (50%), primarily speaking English or Spanish.
- Domestic travelers account for 97.6% of guests.
- Key international markets include United States (97.6%) and DC (0.6%).
- Top languages spoken are English (84.6%) followed by Spanish (7.5%).
- A significant demographic segment is the Post-2000s (Gen Z/Alpha) group, representing 50% of guests.
Recommendations for Hosts
- Target domestic marketing efforts towards travelers from Nashville and Gallatin.
- Tailor amenities and listing descriptions to appeal to the dominant Post-2000s (Gen Z/Alpha) demographic (e.g., highlight fast WiFi, smart home features, local guides).
- Highlight unique local experiences or amenities relevant to the primary guest profile.
- Consider seasonal promotions aligned with peak travel times for key origin markets.
Nearby Short-Term Rental Market Comparison
How does the Gallatin Airbnb market stack up against its neighbors? Compare key performance metrics like average monthly revenue, ADR, and occupancy rates in surrounding areas to understand the broader regional STR landscape.
| Market | Active Properties | Monthly Revenue | Daily Rate | Avg. Occupancy |
|---|---|---|---|---|
| Brentwood | 14 | $4,937 | $601.43 | 47% |
| Berry Hill | 136 | $4,232 | $323.78 | 44% |
| Coxs Creek | 12 | $3,872 | $415.38 | 40% |
| Coalmont | 13 | $3,864 | $240.00 | 52% |
| Bee Spring | 12 | $3,834 | $471.34 | 41% |
| Nashville-Davidson | 6,085 | $3,810 | $321.42 | 45% |
| Franklin | 409 | $3,777 | $297.07 | 48% |
| Bloomfield | 11 | $3,611 | $420.13 | 34% |
| Mt. Juliet | 54 | $3,588 | $312.34 | 44% |
| Cub Run | 26 | $3,555 | $291.16 | 46% |