Franklin Airbnb Market Analysis 2026: Short Term Rental Data & Vacation Rental Statistics in Tennessee, United States
Is Airbnb profitable in Franklin in 2026? Explore comprehensive Airbnb analytics for Franklin, Tennessee, United States to uncover income potential. This 2026 STR market report for Franklin, based on AirROI data from February 2025 to January 2026, reveals key trends in the market of 409 active listings.
Whether you're considering an Airbnb investment in Franklin, optimizing your existing vacation rental, or exploring rental arbitrage opportunities, understanding the Franklin Airbnb data is crucial. Leveraging the low regulation environment is key to maximizing your short term rental income potential. Let's dive into the specifics.
Key Franklin Airbnb Performance Metrics Overview
Monthly Airbnb Revenue Variations & Income Potential in Franklin (2026)
Understanding the monthly revenue variations for Airbnb listings in Franklin is key to maximizing your short term rental income potential. Seasonality significantly impacts earnings. Our analysis, based on data from the past 12 months, shows that the peak revenue month for STRs in Franklin is typically October, while February often presents the lowest earnings, highlighting opportunities for strategic pricing adjustments during shoulder and low seasons. Explore the typical Airbnb income in Franklin across different performance tiers:
- Best-in-class properties (Top 10%) achieve $8,517+ monthly, often utilizing dynamic pricing and superior guest experiences.
- Strong performing properties (Top 25%) earn $5,946 or more, indicating effective management and desirable locations/amenities.
- Typical properties (Median) generate around $3,706 per month, representing the average market performance.
- Entry-level properties (Bottom 25%) see earnings around $2,141, often with potential for optimization.
Average Monthly Airbnb Earnings Trend in Franklin
Franklin Airbnb Occupancy Rate Trends (2026)
Maximize your bookings by understanding the Franklin STR occupancy trends. Seasonal demand shifts significantly influence how often properties are booked. Typically, Octobersees the highest demand (peak season occupancy), while January experiences the lowest (low season). Effective strategies, like adjusting minimum stays or offering promotions, can boost occupancy during slower periods. Here's how different property tiers perform in Franklin:
- Best-in-class properties (Top 10%) achieve 84%+ occupancy, indicating high desirability and potentially optimized availability.
- Strong performing properties (Top 25%) maintain 72% or higher occupancy, suggesting good market fit and guest satisfaction.
- Typical properties (Median) have an occupancy rate around 54%.
- Entry-level properties (Bottom 25%) average 33% occupancy, potentially facing higher vacancy.
Average Monthly Occupancy Rate Trend in Franklin
Average Daily Rate (ADR) Airbnb Trends in Franklin (2026)
Effective short term rental pricing strategy in Franklin involves understanding monthly ADR fluctuations. The Average Daily Rate (ADR) for Airbnb in Franklin typically peaks in December and dips lowest during February. Leveraging Airbnb dynamic pricing tools or strategies based on this seasonality can significantly boost revenue. Here's a look at the typical nightly rates achieved:
- Best-in-class properties (Top 10%) command rates of $478+ per night, often due to premium features or locations.
- Strong performing properties (Top 25%) achieve nightly rates of $326 or more.
- Typical properties (Median) charge around $220 per night.
- Entry-level properties (Bottom 25%) earn around $146 per night.
Average Daily Rate (ADR) Trend by Month in Franklin
Get Live Franklin Market Intelligence 👇

Explore Real-time Analytics
Airbnb Seasonality Analysis & Trends in Franklin (2026)
Peak Season (October, September, November)
- Revenue averages $5,577 per month
- Occupancy rates average 56.7%
- Daily rates average $304
Shoulder Season
- Revenue averages $4,892 per month
- Occupancy maintains around 52.8%
- Daily rates hold near $283
Low Season (January, February, March)
- Revenue drops to average $3,546 per month
- Occupancy decreases to average 44.4%
- Daily rates adjust to average $270
Seasonality Insights for Franklin
- The Airbnb seasonality in Franklin shows moderate seasonality with distinct peak and low periods. While the sections above show seasonal averages, it's also insightful to look at the extremes:
- During the high season, the absolute peak month showcases Franklin's highest earning potential, with monthly revenues capable of climbing to $5,995, occupancy reaching a high of 60.5%, and ADRs peaking at $308.
- Conversely, the slowest single month of the year, typically falling within the low season, marks the market's lowest point. In this month, revenue might dip to $3,131, occupancy could drop to 36.6%, and ADRs may adjust down to $256.
- Understanding both the seasonal averages and these monthly peaks and troughs in revenue, occupancy, and ADR is crucial for maximizing your Airbnb profit potential in Franklin.
Seasonal Strategies for Maximizing Profit
- Peak Season: Maximize revenue through premium pricing and potentially longer minimum stays. Ensure high availability.
- Low Season: Offer competitive pricing, special promotions (e.g., extended stay discounts), and flexible cancellation policies. Target off-season travelers like remote workers or budget-conscious guests.
- Shoulder Seasons: Implement dynamic pricing that balances peak and low rates. Target weekend travelers or specific events. Offer slightly more flexible terms than peak season.
- Regularly analyze your own performance against these Franklin seasonality benchmarks and adjust your pricing and availability strategy accordingly.
Best Areas for Airbnb Investment in Franklin (2026)
Exploring the top neighborhoods for short-term rentals in Franklin? This section highlights key areas, outlining why they are attractive for hosts and guests, along with notable local attractions. Consider these locations based on your target guest profile and investment strategy.
| Neighborhood / Area | Why Host Here? (Target Guests & Appeal) | Key Attractions & Landmarks |
|---|---|---|
| Downtown Franklin | Historic district filled with charming shops, restaurants, and entertainment venues. Ideal for tourists wanting to explore local culture and history. | Carnton Plantation, Franklin Theatre, Main Street shops, Carter House, Franklin Farmers Market |
| Battle Ground Academy Area | Family-friendly neighborhood with easy access to parks and schools. Attracts visitors seeking a quiet, residential experience with amenities nearby. | Battle Ground Academy, Pinkerton Park, Fieldstone Park |
| The Factory at Franklin | Unique venue featuring local shops, restaurants, and events. Great for guests wanting to experience local art and culture in a historic setting. | The Factory shops, Food trucks, Live music events, Farmers market |
| Nolensville Pike Area | Growing area with diverse dining options and close proximity to Nashville's attractions. Popular with visitors exploring both Franklin and Nashville. | The Nolensville Feed Mill, Nolensville Park, Local eateries, Community events |
| Westhaven | Planned community with a charming town center, parks, and beautiful homes. Appeals to families and travelers seeking a suburban experience. | Westhaven Golf Club, Westhaven Town Center, Parks and playgrounds |
| Cool Springs | Commercial hub with shopping and dining. Attracts business travelers and shoppers looking for convenience and modern amenities. | CoolSprings Galleria, Restaurants and cafes, Business centers |
| Leipers Fork | Quaint village known for its artistic community and scenic views. Great for travelers looking for rustic charm and a slower pace. | Leipers Fork Historic District, Music venues, Art galleries, Scenic driving routes |
| Carriage Hill Neighborhood | Residential area with parks and proximity to local schools. Good for families and those wanting a community feel while visiting. | Local parks, Community events, Family-friendly activity spots |
Understanding Airbnb License Requirements & STR Laws in Franklin (2026)
While Franklin, Tennessee, United States currently shows low STR regulations, specific Airbnb license requirements might still exist or change. Always verify the latest short term rental regulations and Airbnb license requirements directly with local government authorities for Franklin to ensure full compliance before hosting.
(Source: AirROI data, 2026, finding no licensed listings among those analyzed)
Top Performing Airbnb Properties in Franklin (2026)
Benchmark your potential! Explore examples of top-performing Airbnb properties in Franklinbased on Trailing Twelve Month (TTM) revenue. Analyze their characteristics, revenue, occupancy rate, and ADR to understand what drives success in this market.
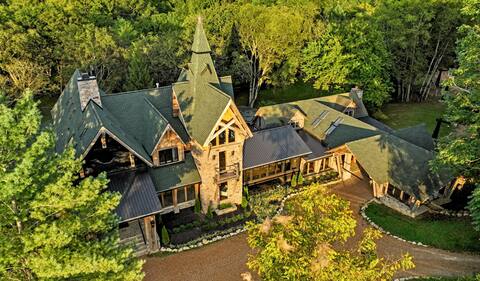
Extraordinary Manor at Dark Horse Estate
Entire Place • 7 bedrooms
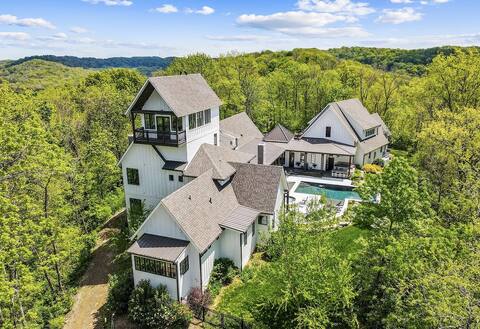
Above Nashville Eagle's View | Pool&Spa I Sauna&Co
Entire Place • 6 bedrooms

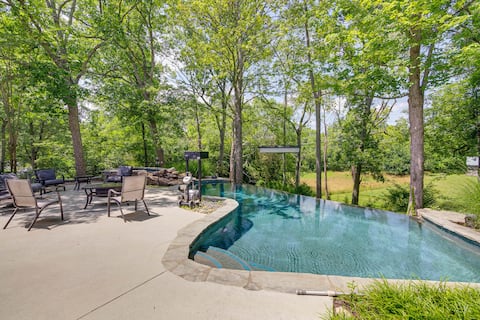
Stunning Estate Leiper's Fork Pool, Hot Tub, Sauna
Entire Place • 7 bedrooms

18-Acre Hideaway: Hot Tub
Entire Place • 5 bedrooms
Pool, Hot Tub & Outdoor Theater: Franklin Retreat
Entire Place • 6 bedrooms

Luxury Franklin Farmhouse
Entire Place • 4 bedrooms
Note: Performance varies based on location, size, amenities, seasonality, and management quality. Data reflects the past 12 months.
Top Performing Airbnb Hosts in Franklin (2026)
Learn from the best! This table showcases top-performing Airbnb hosts in Franklin based on the number of properties managed and estimated total revenue over the past year. Analyze their scale and performance metrics.
| Host Name | Properties | Grossing Revenue | Stay Reviews | Avg Rating |
|---|---|---|---|---|
| Gretchen | 15 | $942,135 | 2068 | 4.92/5.0 |
| Robin | 3 | $774,586 | 330 | 4.97/5.0 |
| Host Extraordinaires | 12 | $769,892 | 1441 | 4.75/5.0 |
| Jason And DeMarco | 11 | $712,893 | 893 | 4.90/5.0 |
| Karen | 7 | $670,213 | 1231 | 4.94/5.0 |
| Liz | 12 | $551,833 | 1505 | 4.95/5.0 |
| Above Vacation | 1 | $429,023 | 2 | Not Rated |
| Sarah | 6 | $308,561 | 79 | 4.97/5.0 |
| Amy | 1 | $265,994 | 35 | 4.91/5.0 |
| Steph | 1 | $253,087 | 231 | 4.87/5.0 |
Analyzing the strategies of top hosts, such as their property selection, pricing, and guest communication, can offer valuable lessons for optimizing your own Airbnb operations in Franklin.
Dive Deeper: Advanced Franklin STR Market Data (2026)
Ready to unlock more insights? AirROI provides access to advanced metrics and comprehensive Airbnb data for Franklin. Explore detailed analytics beyond this report to refine your investment strategy, optimize pricing, and maximize your vacation rental profits.
Explore Advanced MetricsFranklin Short-Term Rental Market Composition (2026): Property & Room Types
Room Type Distribution
Property Type Distribution
Market Composition Insights for Franklin
- The Franklin Airbnb market composition is heavily skewed towards Entire Home/Apt listings, which make up 88.5% of the 409 active rentals. This indicates strong guest preference for privacy and space.
- Looking at the property type distribution in Franklin, House properties are the most common (68.5%), reflecting the local real estate landscape.
- Houses represent a significant 68.5% portion, catering likely to families or larger groups.
- The presence of 5.6% Hotel/Boutique listings indicates integration with traditional hospitality.
- Smaller segments like others, unique stays (combined 4.7%) offer potential for unique stay experiences.
Franklin Airbnb Room Capacity Analysis (2026): Bedroom Distribution
Distribution of Listings by Number of Bedrooms
Room Capacity Insights for Franklin
- The dominant room capacity in Franklin is 3 bedrooms listings, making up 27.1% of the market. This suggests a strong demand for properties suitable for families or small groups.
- Together, 3 bedrooms and 2 bedrooms properties represent 52.5% of the active Airbnb listings in Franklin, indicating a high concentration in these sizes.
- A significant 43.8% of listings offer 3+ bedrooms, catering to larger groups and families seeking more space in Franklin.
Franklin Vacation Rental Guest Capacity Trends (2026)
Distribution of Listings by Guest Capacity
Guest Capacity Insights for Franklin
- The most common guest capacity trend in Franklin vacation rentals is listings accommodating 8+ guests (24.7%). This suggests the primary traveler segment is likely larger groups.
- Properties designed for 8+ guests and 6 guests dominate the Franklin STR market, accounting for 47.2% of listings.
- 48.7% of properties accommodate 6+ guests, serving the market segment for larger families or group travel in Franklin.
- On average, properties in Franklin are equipped to host 4.9 guests.
Franklin Airbnb Booking Patterns (2026): Available vs. Booked Days
Available Days Distribution
Booked Days Distribution
Booking Pattern Insights for Franklin
- The most common availability pattern in Franklin falls within the 91-180 days range, representing 33.7% of listings. This suggests many properties have significant open periods on their calendars.
- Approximately 57.0% of listings show high availability (181+ days open annually), indicating potential for increased bookings or specific owner usage patterns.
- For booked days, the 181-270 days range is most frequent in Franklin (33.7%), reflecting common guest stay durations or potential owner blocking patterns.
- A notable 43.7% of properties secure long booking periods (181+ days booked per year), highlighting successful long-term rental strategies or significant owner usage.
Franklin Airbnb Minimum Stay Requirements Analysis
Distribution of Listings by Minimum Night Requirement
1 Night
76 listings
18.6% of total
2 Nights
177 listings
43.3% of total
3 Nights
13 listings
3.2% of total
4-6 Nights
3 listings
0.7% of total
7-29 Nights
27 listings
6.6% of total
30+ Nights
113 listings
27.6% of total
Key Insights
- The most prevalent minimum stay requirement in Franklin is 2 Nights, adopted by 43.3% of listings. This highlights the market's preference for shorter, flexible bookings.
- A strong majority (61.9%) of the Franklin Airbnb data shows acceptance of very short stays (1-2 nights), indicating a dynamic, high-turnover market.
- A significant segment (27.6%) caters to monthly stays (30+ nights) in Franklin, pointing to opportunities in the extended-stay market.
Recommendations
- Align with the market by considering a 2 Nights minimum stay, as 43.3% of Franklin hosts use this setting.
- If feasible, allowing 1-night stays, especially midweek or during low season, could capture last-minute bookings, as only 18.6% currently do.
- A 2-night minimum appears standard (43.3%). Consider this for weekends or peak periods.
- Explore offering discounts for stays of 30+ nights to attract the 27.6% of the market seeking extended stays.
- Adjust minimum nights based on seasonality – potentially shorter during low season and longer during peak demand periods in Franklin.
Franklin Airbnb Cancellation Policy Trends Analysis (2026)
Super Strict 30 Days
17 listings
4.2% of total
Limited
6 listings
1.5% of total
Super Strict 60 Days
1 listings
0.2% of total
Flexible
55 listings
13.4% of total
Moderate
102 listings
24.9% of total
Firm
160 listings
39.1% of total
Strict
68 listings
16.6% of total
Cancellation Policy Insights for Franklin
- The prevailing Airbnb cancellation policy trend in Franklin is Firm, used by 39.1% of listings.
- A majority (55.7%) of hosts in Franklin utilize Firm or Strict policies, indicating a market where hosts prioritize booking security.
Recommendations for Hosts
- Consider adopting a Firm policy to align with the 39.1% market standard in Franklin.
- Regularly review your cancellation policy against competitors and market demand shifts in Franklin.
Franklin STR Booking Lead Time Analysis (2026)
Average Booking Lead Time by Month
Booking Lead Time Insights for Franklin
- The overall average booking lead time for vacation rentals in Franklin is 46 days.
- Guests book furthest in advance for stays during October (average 67 days), likely coinciding with peak travel demand or local events.
- The shortest booking windows occur for stays in January (average 27 days), indicating more last-minute travel plans during this time.
- Seasonally, Fall (61 days avg.) sees the longest lead times, while Winter (35 days avg.) has the shortest, reflecting typical travel planning cycles.
Recommendations for Hosts
- Use the overall average lead time (46 days) as a baseline for your pricing and availability strategy in Franklin.
- For October stays, consider implementing length-of-stay discounts or slightly higher rates for bookings made less than 67 days out to capitalize on advance planning.
- Target marketing efforts for the Fall season well in advance (at least 61 days) to capture early planners.
- Monitor your own booking lead times against these Franklin averages to identify opportunities for dynamic pricing adjustments.
Popular & Essential Airbnb Amenities in Franklin (2026)
Amenity Prevalence
Amenity Insights for Franklin
- Essential amenities in Franklin that guests expect include: Wifi, Air conditioning, Free parking on premises, Smoke alarm, Heating, TV, Hot water. Lacking these (any) could significantly impact bookings.
- Popular amenities like Hair dryer, Coffee maker, Dishes and silverware are common but not universal. Offering these can provide a competitive edge.
Recommendations for Hosts
- Ensure your listing includes all essential amenities for Franklin: Wifi, Air conditioning, Free parking on premises, Smoke alarm, Heating, TV, Hot water.
- Prioritize adding missing essentials: Air conditioning, Free parking on premises, Smoke alarm, Heating, TV, Hot water.
- Consider adding popular differentiators like Hair dryer or Coffee maker to increase appeal.
- Highlight unique or less common amenities you offer (e.g., hot tub, dedicated workspace, EV charger) in your listing description and photos.
- Regularly check competitor amenities in Franklin to stay competitive.
Franklin Airbnb Guest Demographics & Profile Analysis (2026)
Guest Profile Summary for Franklin
- The typical guest profile for Airbnb in Franklin consists of primarily domestic travelers (97%), often arriving from nearby Nashville, typically belonging to the Post-2000s (Gen Z/Alpha) group (50%), primarily speaking English or Spanish.
- Domestic travelers account for 96.9% of guests.
- Key international markets include United States (96.9%) and United Kingdom (0.9%).
- Top languages spoken are English (83.1%) followed by Spanish (8.1%).
- A significant demographic segment is the Post-2000s (Gen Z/Alpha) group, representing 50% of guests.
Recommendations for Hosts
- Target domestic marketing efforts towards travelers from Nashville and Franklin.
- Tailor amenities and listing descriptions to appeal to the dominant Post-2000s (Gen Z/Alpha) demographic (e.g., highlight fast WiFi, smart home features, local guides).
- Highlight unique local experiences or amenities relevant to the primary guest profile.
- Consider seasonal promotions aligned with peak travel times for key origin markets.
Nearby Short-Term Rental Market Comparison
How does the Franklin Airbnb market stack up against its neighbors? Compare key performance metrics like average monthly revenue, ADR, and occupancy rates in surrounding areas to understand the broader regional STR landscape.
| Market | Active Properties | Monthly Revenue | Daily Rate | Avg. Occupancy |
|---|---|---|---|---|
| Brentwood | 14 | $4,937 | $601.43 | 47% |
| Bremen | 23 | $4,914 | $603.74 | 33% |
| Arley | 47 | $4,531 | $525.71 | 35% |
| Berry Hill | 136 | $4,232 | $323.78 | 44% |
| Coalmont | 13 | $3,864 | $240.00 | 52% |
| Nashville-Davidson | 6,085 | $3,810 | $321.42 | 45% |
| Cedar Bluff | 37 | $3,805 | $390.28 | 36% |
| Mt. Juliet | 54 | $3,588 | $312.34 | 44% |
| Lookout Mountain | 82 | $3,569 | $311.06 | 47% |
| Pegram | 19 | $3,535 | $254.12 | 45% |