Clarksville Airbnb Market Analysis 2026: Short Term Rental Data & Vacation Rental Statistics in Tennessee, United States
Is Airbnb profitable in Clarksville in 2026? Explore comprehensive Airbnb analytics for Clarksville, Tennessee, United States to uncover income potential. This 2026 STR market report for Clarksville, based on AirROI data from February 2025 to January 2026, reveals key trends in the market of 442 active listings.
Whether you're considering an Airbnb investment in Clarksville, optimizing your existing vacation rental, or exploring rental arbitrage opportunities, understanding the Clarksville Airbnb data is crucial. Leveraging the low regulation environment is key to maximizing your short term rental income potential. Let's dive into the specifics.
Key Clarksville Airbnb Performance Metrics Overview
Monthly Airbnb Revenue Variations & Income Potential in Clarksville (2026)
Understanding the monthly revenue variations for Airbnb listings in Clarksville is key to maximizing your short term rental income potential. Seasonality significantly impacts earnings. Our analysis, based on data from the past 12 months, shows that the peak revenue month for STRs in Clarksville is typically October, while February often presents the lowest earnings, highlighting opportunities for strategic pricing adjustments during shoulder and low seasons. Explore the typical Airbnb income in Clarksville across different performance tiers:
- Best-in-class properties (Top 10%) achieve $4,842+ monthly, often utilizing dynamic pricing and superior guest experiences.
- Strong performing properties (Top 25%) earn $3,241 or more, indicating effective management and desirable locations/amenities.
- Typical properties (Median) generate around $2,084 per month, representing the average market performance.
- Entry-level properties (Bottom 25%) see earnings around $1,100, often with potential for optimization.
Average Monthly Airbnb Earnings Trend in Clarksville
Clarksville Airbnb Occupancy Rate Trends (2026)
Maximize your bookings by understanding the Clarksville STR occupancy trends. Seasonal demand shifts significantly influence how often properties are booked. Typically, Marchsees the highest demand (peak season occupancy), while January experiences the lowest (low season). Effective strategies, like adjusting minimum stays or offering promotions, can boost occupancy during slower periods. Here's how different property tiers perform in Clarksville:
- Best-in-class properties (Top 10%) achieve 83%+ occupancy, indicating high desirability and potentially optimized availability.
- Strong performing properties (Top 25%) maintain 69% or higher occupancy, suggesting good market fit and guest satisfaction.
- Typical properties (Median) have an occupancy rate around 48%.
- Entry-level properties (Bottom 25%) average 27% occupancy, potentially facing higher vacancy.
Average Monthly Occupancy Rate Trend in Clarksville
Average Daily Rate (ADR) Airbnb Trends in Clarksville (2026)
Effective short term rental pricing strategy in Clarksville involves understanding monthly ADR fluctuations. The Average Daily Rate (ADR) for Airbnb in Clarksville typically peaks in October and dips lowest during February. Leveraging Airbnb dynamic pricing tools or strategies based on this seasonality can significantly boost revenue. Here's a look at the typical nightly rates achieved:
- Best-in-class properties (Top 10%) command rates of $266+ per night, often due to premium features or locations.
- Strong performing properties (Top 25%) achieve nightly rates of $175 or more.
- Typical properties (Median) charge around $130 per night.
- Entry-level properties (Bottom 25%) earn around $96 per night.
Average Daily Rate (ADR) Trend by Month in Clarksville
Get Live Clarksville Market Intelligence 👇

Explore Real-time Analytics
Airbnb Seasonality Analysis & Trends in Clarksville (2026)
Peak Season (October, June, May)
- Revenue averages $3,237 per month
- Occupancy rates average 51.4%
- Daily rates average $169
Shoulder Season
- Revenue averages $2,810 per month
- Occupancy maintains around 48.9%
- Daily rates hold near $163
Low Season (January, February, April)
- Revenue drops to average $2,010 per month
- Occupancy decreases to average 44.3%
- Daily rates adjust to average $147
Seasonality Insights for Clarksville
- The Airbnb seasonality in Clarksville shows moderate seasonality with distinct peak and low periods. While the sections above show seasonal averages, it's also insightful to look at the extremes:
- During the high season, the absolute peak month showcases Clarksville's highest earning potential, with monthly revenues capable of climbing to $3,462, occupancy reaching a high of 55.3%, and ADRs peaking at $182.
- Conversely, the slowest single month of the year, typically falling within the low season, marks the market's lowest point. In this month, revenue might dip to $1,794, occupancy could drop to 33.7%, and ADRs may adjust down to $132.
- Understanding both the seasonal averages and these monthly peaks and troughs in revenue, occupancy, and ADR is crucial for maximizing your Airbnb profit potential in Clarksville.
Seasonal Strategies for Maximizing Profit
- Peak Season: Maximize revenue through premium pricing and potentially longer minimum stays. Ensure high availability.
- Low Season: Offer competitive pricing, special promotions (e.g., extended stay discounts), and flexible cancellation policies. Target off-season travelers like remote workers or budget-conscious guests.
- Shoulder Seasons: Implement dynamic pricing that balances peak and low rates. Target weekend travelers or specific events. Offer slightly more flexible terms than peak season.
- Regularly analyze your own performance against these Clarksville seasonality benchmarks and adjust your pricing and availability strategy accordingly.
Best Areas for Airbnb Investment in Clarksville (2026)
Exploring the top neighborhoods for short-term rentals in Clarksville? This section highlights key areas, outlining why they are attractive for hosts and guests, along with notable local attractions. Consider these locations based on your target guest profile and investment strategy.
| Neighborhood / Area | Why Host Here? (Target Guests & Appeal) | Key Attractions & Landmarks |
|---|---|---|
| Downtown Clarksville | The heart of Clarksville with a vibrant atmosphere, perfect for travelers looking for dining, shopping, and nightlife options. Close to all major attractions and events. | Customs House Museum, Clarksville Riverwalk, Downtown Commons, Liberty Park, Vanderbilt Park |
| Sango | A suburban area that combines relaxing residential neighborhoods with easy access to shopping and dining. Ideal for families and visitors looking for a quieter stay while still being close to the city. | Sango Park, Local restaurants and shops, Dunbar Cave State Park, Port Royal State Park |
| Ashland City Highway | A busy thoroughfare that connects to both Clarksville and Nashville, making it an attractive location for short-term rentals catering to those exploring both cities. | Nashville nearby attractions, Shopping centers, Riverside Park, Parks and green spaces |
| Kirkwood | A residential neighborhood that's gaining popularity due to its proximity to many schools and parks, appealing to families and longer-term stay guests. | Kirkwood Park, Schools, Walking and biking trails, Grocery stores and amenities |
| Oak Grove | Just outside Clarksville, this area offers peaceful surroundings and is known for its hospitality, attracting travelers heading to Fort Campbell and the surrounding natural attractions. | Fort Campbell, Local dining options, Golf courses, Recreational parks |
| River District | Located along the Cumberland River, offering beautiful views and recreational activities. A growing spot for travelers interested in outdoor experiences and local culture. | Cumberland River, Riverfront parks, Boating and fishing spots, Picnic areas |
| St. Bethlehem | A diverse area that offers a range of dining and shopping options, popular among visitors who appreciate convenience and variety in their stay. | Dining and entertainment options, Local shops, Community events |
| Wilma Rudolph Boulevard | This main commercial corridor provides access to hotels, businesses, and entertainment, making it a prime area for short-term rentals catering to busy travelers. | Shopping centers, Restaurants, Entertainment facilities, Sports complexes |
Understanding Airbnb License Requirements & STR Laws in Clarksville (2026)
While Clarksville, Tennessee, United States currently shows low STR regulations, specific Airbnb license requirements might still exist or change. Always verify the latest short term rental regulations and Airbnb license requirements directly with local government authorities for Clarksville to ensure full compliance before hosting.
(Source: AirROI data, 2026, based on 2% licensed listings)
Top Performing Airbnb Properties in Clarksville (2026)
Benchmark your potential! Explore examples of top-performing Airbnb properties in Clarksvillebased on Trailing Twelve Month (TTM) revenue. Analyze their characteristics, revenue, occupancy rate, and ADR to understand what drives success in this market.
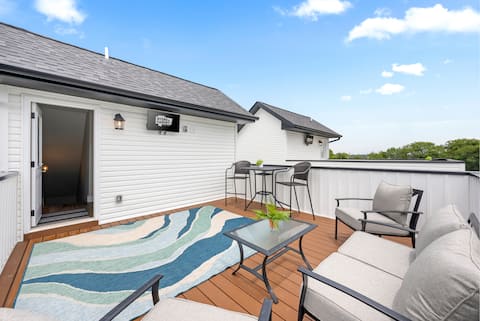
Adam's Downtown Retreat with 2 Rooftop Patios
Entire Place • 8 bedrooms

The Gathering Place at Hilltop Acres
Entire Place • 7 bedrooms

Memories on Madison | Game Room & Outdoor Fire Pit
Entire Place • 4 bedrooms
Downtown Duo on Franklin (1010 Franklin St)
Entire Place • 8 bedrooms

The Clubhouse on Colston (2296 Colston Dr)
Entire Place • 4 bedrooms

Peachers Place Townhomes (1000 Henry Place, #801)
Entire Place • 3 bedrooms
Note: Performance varies based on location, size, amenities, seasonality, and management quality. Data reflects the past 12 months.
Top Performing Airbnb Hosts in Clarksville (2026)
Learn from the best! This table showcases top-performing Airbnb hosts in Clarksville based on the number of properties managed and estimated total revenue over the past year. Analyze their scale and performance metrics.
| Host Name | Properties | Grossing Revenue | Stay Reviews | Avg Rating |
|---|---|---|---|---|
| Julian | 48 | $3,229,768 | 1798 | 4.86/5.0 |
| VictoriAnn | 8 | $237,759 | 389 | 4.84/5.0 |
| Evans And Judy | 8 | $233,933 | 337 | 4.84/5.0 |
| Properties By Preston | 20 | $164,279 | 55 | 4.83/5.0 |
| XL Holdings | 5 | $150,927 | 273 | 4.93/5.0 |
| Gary & Alela | 5 | $143,487 | 254 | 4.90/5.0 |
| Evie & Joey | 4 | $115,474 | 1136 | 4.96/5.0 |
| Evolve | 6 | $107,792 | 97 | 4.48/5.0 |
| Natasha And Joshua | 9 | $106,441 | 196 | 4.81/5.0 |
| Laquvia | 6 | $102,666 | 169 | 4.77/5.0 |
Analyzing the strategies of top hosts, such as their property selection, pricing, and guest communication, can offer valuable lessons for optimizing your own Airbnb operations in Clarksville.
Dive Deeper: Advanced Clarksville STR Market Data (2026)
Ready to unlock more insights? AirROI provides access to advanced metrics and comprehensive Airbnb data for Clarksville. Explore detailed analytics beyond this report to refine your investment strategy, optimize pricing, and maximize your vacation rental profits.
Explore Advanced MetricsClarksville Short-Term Rental Market Composition (2026): Property & Room Types
Room Type Distribution
Property Type Distribution
Market Composition Insights for Clarksville
- The Clarksville Airbnb market composition is heavily skewed towards Entire Home/Apt listings, which make up 90.7% of the 442 active rentals. This indicates strong guest preference for privacy and space.
- Looking at the property type distribution in Clarksville, House properties are the most common (69.7%), reflecting the local real estate landscape.
- Houses represent a significant 69.7% portion, catering likely to families or larger groups.
- Smaller segments like others, unique stays, outdoor/unique, hotel/boutique (combined 2.6%) offer potential for unique stay experiences.
Clarksville Airbnb Room Capacity Analysis (2026): Bedroom Distribution
Distribution of Listings by Number of Bedrooms
Room Capacity Insights for Clarksville
- The dominant room capacity in Clarksville is 2 bedrooms listings, making up 32.6% of the market. This suggests a strong demand for properties suitable for couples or solo travelers.
- Together, 2 bedrooms and 3 bedrooms properties represent 65.0% of the active Airbnb listings in Clarksville, indicating a high concentration in these sizes.
- A significant 45.1% of listings offer 3+ bedrooms, catering to larger groups and families seeking more space in Clarksville.
Clarksville Vacation Rental Guest Capacity Trends (2026)
Distribution of Listings by Guest Capacity
Guest Capacity Insights for Clarksville
- The most common guest capacity trend in Clarksville vacation rentals is listings accommodating 6 guests (26.7%). This suggests the primary traveler segment is likely larger groups.
- Properties designed for 6 guests and 4 guests dominate the Clarksville STR market, accounting for 49.1% of listings.
- 52.9% of properties accommodate 6+ guests, serving the market segment for larger families or group travel in Clarksville.
- On average, properties in Clarksville are equipped to host 5.1 guests.
Clarksville Airbnb Booking Patterns (2026): Available vs. Booked Days
Available Days Distribution
Booked Days Distribution
Booking Pattern Insights for Clarksville
- The most common availability pattern in Clarksville falls within the 271-366 days range, representing 40.3% of listings. This suggests many properties have significant open periods on their calendars.
- Approximately 74.2% of listings show high availability (181+ days open annually), indicating potential for increased bookings or specific owner usage patterns.
- For booked days, the 91-180 days range is most frequent in Clarksville (34.8%), reflecting common guest stay durations or potential owner blocking patterns.
- A notable 26.7% of properties secure long booking periods (181+ days booked per year), highlighting successful long-term rental strategies or significant owner usage.
Clarksville Airbnb Minimum Stay Requirements Analysis
Distribution of Listings by Minimum Night Requirement
1 Night
169 listings
38.2% of total
2 Nights
104 listings
23.5% of total
3 Nights
14 listings
3.2% of total
4-6 Nights
10 listings
2.3% of total
7-29 Nights
23 listings
5.2% of total
30+ Nights
122 listings
27.6% of total
Key Insights
- The most prevalent minimum stay requirement in Clarksville is 1 Night, adopted by 38.2% of listings. This highlights the market's preference for shorter, flexible bookings.
- A strong majority (61.7%) of the Clarksville Airbnb data shows acceptance of very short stays (1-2 nights), indicating a dynamic, high-turnover market.
- A significant segment (27.6%) caters to monthly stays (30+ nights) in Clarksville, pointing to opportunities in the extended-stay market.
Recommendations
- Align with the market by considering a 1 Night minimum stay, as 38.2% of Clarksville hosts use this setting.
- Explore offering discounts for stays of 30+ nights to attract the 27.6% of the market seeking extended stays.
- Adjust minimum nights based on seasonality – potentially shorter during low season and longer during peak demand periods in Clarksville.
Clarksville Airbnb Cancellation Policy Trends Analysis (2026)
Super Strict 60 Days
20 listings
4.5% of total
Limited
5 listings
1.1% of total
Flexible
142 listings
32.1% of total
Moderate
110 listings
24.9% of total
Firm
126 listings
28.5% of total
Strict
39 listings
8.8% of total
Cancellation Policy Insights for Clarksville
- The prevailing Airbnb cancellation policy trend in Clarksville is Flexible, used by 32.1% of listings.
- There's a relatively balanced mix between guest-friendly (57.0%) and stricter (37.3%) policies, offering choices for different guest needs.
- Strict cancellation policies are quite rare (8.8%), potentially making listings with this policy less competitive unless justified by high demand or property type.
Recommendations for Hosts
- Consider adopting a Flexible policy to align with the 32.1% market standard in Clarksville.
- Using a Strict policy might deter some guests, as only 8.8% of listings use it. Evaluate if potential revenue protection outweighs possible lower booking rates.
- Regularly review your cancellation policy against competitors and market demand shifts in Clarksville.
Clarksville STR Booking Lead Time Analysis (2026)
Average Booking Lead Time by Month
Booking Lead Time Insights for Clarksville
- The overall average booking lead time for vacation rentals in Clarksville is 25 days.
- Guests book furthest in advance for stays during November (average 41 days), likely coinciding with peak travel demand or local events.
- The shortest booking windows occur for stays in February (average 13 days), indicating more last-minute travel plans during this time.
- Seasonally, Fall (33 days avg.) sees the longest lead times, while Winter (19 days avg.) has the shortest, reflecting typical travel planning cycles.
Recommendations for Hosts
- Use the overall average lead time (25 days) as a baseline for your pricing and availability strategy in Clarksville.
- For November stays, consider implementing length-of-stay discounts or slightly higher rates for bookings made less than 41 days out to capitalize on advance planning.
- During February, focus on last-minute booking availability and promotions, as guests book with very short notice (13 days avg.).
- Target marketing efforts for the Fall season well in advance (at least 33 days) to capture early planners.
- Monitor your own booking lead times against these Clarksville averages to identify opportunities for dynamic pricing adjustments.
Popular & Essential Airbnb Amenities in Clarksville (2026)
Amenity Prevalence
Amenity Insights for Clarksville
- Essential amenities in Clarksville that guests expect include: Wifi, Air conditioning, TV, Smoke alarm, Free parking on premises, Heating, Kitchen. Lacking these (any) could significantly impact bookings.
- Popular amenities like Hot water, Washer, Microwave are common but not universal. Offering these can provide a competitive edge.
Recommendations for Hosts
- Ensure your listing includes all essential amenities for Clarksville: Wifi, Air conditioning, TV, Smoke alarm, Free parking on premises, Heating, Kitchen.
- Prioritize adding missing essentials: Wifi, Air conditioning, TV, Smoke alarm, Free parking on premises, Heating, Kitchen.
- Consider adding popular differentiators like Hot water or Washer to increase appeal.
- Highlight unique or less common amenities you offer (e.g., hot tub, dedicated workspace, EV charger) in your listing description and photos.
- Regularly check competitor amenities in Clarksville to stay competitive.
Clarksville Airbnb Guest Demographics & Profile Analysis (2026)
Guest Profile Summary for Clarksville
- The typical guest profile for Airbnb in Clarksville consists of primarily domestic travelers (98%), often arriving from nearby Clarksville, typically belonging to the Post-2000s (Gen Z/Alpha) group (50%), primarily speaking English or Spanish.
- Domestic travelers account for 97.5% of guests.
- Key international markets include United States (97.5%) and Canada (0.3%).
- Top languages spoken are English (81.2%) followed by Spanish (11.1%).
- A significant demographic segment is the Post-2000s (Gen Z/Alpha) group, representing 50% of guests.
Recommendations for Hosts
- Target domestic marketing efforts towards travelers from Clarksville and Nashville.
- Tailor amenities and listing descriptions to appeal to the dominant Post-2000s (Gen Z/Alpha) demographic (e.g., highlight fast WiFi, smart home features, local guides).
- Highlight unique local experiences or amenities relevant to the primary guest profile.
- Consider seasonal promotions aligned with peak travel times for key origin markets.
Nearby Short-Term Rental Market Comparison
How does the Clarksville Airbnb market stack up against its neighbors? Compare key performance metrics like average monthly revenue, ADR, and occupancy rates in surrounding areas to understand the broader regional STR landscape.
| Market | Active Properties | Monthly Revenue | Daily Rate | Avg. Occupancy |
|---|---|---|---|---|
| Brentwood | 14 | $4,937 | $601.43 | 47% |
| Berry Hill | 136 | $4,232 | $323.78 | 44% |
| Bee Spring | 12 | $3,834 | $471.34 | 41% |
| Nashville-Davidson | 6,085 | $3,810 | $321.42 | 45% |
| Franklin | 409 | $3,777 | $297.07 | 48% |
| Mt. Juliet | 54 | $3,588 | $312.34 | 44% |
| Cub Run | 26 | $3,555 | $291.16 | 46% |
| Pegram | 19 | $3,535 | $254.12 | 45% |
| Thompson's Station | 36 | $3,487 | $314.31 | 42% |
| Pleasant View | 16 | $3,414 | $338.69 | 38% |