Altamont Airbnb Market Analysis 2026: Short Term Rental Data & Vacation Rental Statistics in Tennessee, United States
Is Airbnb profitable in Altamont in 2026? Explore comprehensive Airbnb analytics for Altamont, Tennessee, United States to uncover income potential. This 2026 STR market report for Altamont, based on AirROI data from February 2025 to January 2026, reveals key trends in the niche market of 37 active listings.
Whether you're considering an Airbnb investment in Altamont, optimizing your existing vacation rental, or exploring rental arbitrage opportunities, understanding the Altamont Airbnb data is crucial. Leveraging the low regulation environment is key to maximizing your short term rental income potential. Let's dive into the specifics.
Key Altamont Airbnb Performance Metrics Overview
Monthly Airbnb Revenue Variations & Income Potential in Altamont (2026)
Understanding the monthly revenue variations for Airbnb listings in Altamont is key to maximizing your short term rental income potential. Seasonality significantly impacts earnings. Our analysis, based on data from the past 12 months, shows that the peak revenue month for STRs in Altamont is typically October, while February often presents the lowest earnings, highlighting opportunities for strategic pricing adjustments during shoulder and low seasons. Explore the typical Airbnb income in Altamont across different performance tiers:
- Best-in-class properties (Top 10%) achieve $6,389+ monthly, often utilizing dynamic pricing and superior guest experiences.
- Strong performing properties (Top 25%) earn $4,766 or more, indicating effective management and desirable locations/amenities.
- Typical properties (Median) generate around $2,107 per month, representing the average market performance.
- Entry-level properties (Bottom 25%) see earnings around $890, often with potential for optimization.
Average Monthly Airbnb Earnings Trend in Altamont
Altamont Airbnb Occupancy Rate Trends (2026)
Maximize your bookings by understanding the Altamont STR occupancy trends. Seasonal demand shifts significantly influence how often properties are booked. Typically, Octobersees the highest demand (peak season occupancy), while January experiences the lowest (low season). Effective strategies, like adjusting minimum stays or offering promotions, can boost occupancy during slower periods. Here's how different property tiers perform in Altamont:
- Best-in-class properties (Top 10%) achieve 74%+ occupancy, indicating high desirability and potentially optimized availability.
- Strong performing properties (Top 25%) maintain 61% or higher occupancy, suggesting good market fit and guest satisfaction.
- Typical properties (Median) have an occupancy rate around 34%.
- Entry-level properties (Bottom 25%) average 18% occupancy, potentially facing higher vacancy.
Average Monthly Occupancy Rate Trend in Altamont
Average Daily Rate (ADR) Airbnb Trends in Altamont (2026)
Effective short term rental pricing strategy in Altamont involves understanding monthly ADR fluctuations. The Average Daily Rate (ADR) for Airbnb in Altamont typically peaks in December and dips lowest during April. Leveraging Airbnb dynamic pricing tools or strategies based on this seasonality can significantly boost revenue. Here's a look at the typical nightly rates achieved:
- Best-in-class properties (Top 10%) command rates of $342+ per night, often due to premium features or locations.
- Strong performing properties (Top 25%) achieve nightly rates of $270 or more.
- Typical properties (Median) charge around $199 per night.
- Entry-level properties (Bottom 25%) earn around $144 per night.
Average Daily Rate (ADR) Trend by Month in Altamont
Get Live Altamont Market Intelligence 👇

Explore Real-time Analytics
Airbnb Seasonality Analysis & Trends in Altamont (2026)
Peak Season (October, March, November)
- Revenue averages $3,909 per month
- Occupancy rates average 49.1%
- Daily rates average $220
Shoulder Season
- Revenue averages $2,883 per month
- Occupancy maintains around 36.0%
- Daily rates hold near $217
Low Season (February, April, August)
- Revenue drops to average $2,494 per month
- Occupancy decreases to average 34.7%
- Daily rates adjust to average $203
Seasonality Insights for Altamont
- The Airbnb seasonality in Altamont shows moderate seasonality with distinct peak and low periods. While the sections above show seasonal averages, it's also insightful to look at the extremes:
- During the high season, the absolute peak month showcases Altamont's highest earning potential, with monthly revenues capable of climbing to $4,321, occupancy reaching a high of 51.8%, and ADRs peaking at $232.
- Conversely, the slowest single month of the year, typically falling within the low season, marks the market's lowest point. In this month, revenue might dip to $2,402, occupancy could drop to 30.5%, and ADRs may adjust down to $199.
- Understanding both the seasonal averages and these monthly peaks and troughs in revenue, occupancy, and ADR is crucial for maximizing your Airbnb profit potential in Altamont.
Seasonal Strategies for Maximizing Profit
- Peak Season: Maximize revenue through premium pricing and potentially longer minimum stays. Ensure high availability.
- Low Season: Offer competitive pricing, special promotions (e.g., extended stay discounts), and flexible cancellation policies. Target off-season travelers like remote workers or budget-conscious guests.
- Shoulder Seasons: Implement dynamic pricing that balances peak and low rates. Target weekend travelers or specific events. Offer slightly more flexible terms than peak season.
- Regularly analyze your own performance against these Altamont seasonality benchmarks and adjust your pricing and availability strategy accordingly.
Best Areas for Airbnb Investment in Altamont (2026)
Exploring the top neighborhoods for short-term rentals in Altamont? This section highlights key areas, outlining why they are attractive for hosts and guests, along with notable local attractions. Consider these locations based on your target guest profile and investment strategy.
| Neighborhood / Area | Why Host Here? (Target Guests & Appeal) | Key Attractions & Landmarks |
|---|---|---|
| Altamont Downtown | The heart of Altamont with charming local shops and easy access to community events. A great spot for visitors to experience local culture and hospitality. | Altamont Town Hall, Restaurants and Cafes, Local Artisan Shops, Altamont Public Library |
| Piney Creek | A beautiful natural area perfect for outdoor enthusiasts. Offers hiking, fishing, and a getaway from the city buzz. | Piney Creek Falls, Hiking Trails, Fishing Spots, Campgrounds |
| Grundy County Park | A peaceful region ideal for families and nature lovers, providing space for picnics and outdoor activities. | Picnic Areas, Playgrounds, Scenic Walks, Wildlife Watching |
| Monteagle | A nearby small town known for its historic sites and proximity to the Monteagle Lookout. Great for those exploring the wider area. | University of the South, Monteagle Lookout, Shops and Restaurants, Local Festivals |
| Savage Gulf State Natural Area | A stunning natural preserve with breathtaking landscapes, ideal for eco-tourism and nature enthusiasts. | Hiking Routes, Caves, Waterfalls, Scenic Views |
| Coalmont | A quaint village nearby with a cozy small-town feel, inviting nature walks and relaxation. | Coalmont City Park, Local Diner, Artisan Crafts, Historic Sites |
| Tracy City | Known for its rich history and community events, Tracy City offers a friendly atmosphere and local attractions. | Tracy City Museum, Historic Homes, Community Events, Local Restaurants |
| Fiery Gizzard Trailhead | A famous hiking trail leading through stunning natural beauty, drawing outdoor lovers and adventure seekers. | Hiking the Fiery Gizzard Trail, Scenic Overlooks, Nature Photography, Wildlife Watching |
Understanding Airbnb License Requirements & STR Laws in Altamont (2026)
While Altamont, Tennessee, United States currently shows low STR regulations, specific Airbnb license requirements might still exist or change. Always verify the latest short term rental regulations and Airbnb license requirements directly with local government authorities for Altamont to ensure full compliance before hosting.
(Source: AirROI data, 2026, finding no licensed listings among those analyzed)
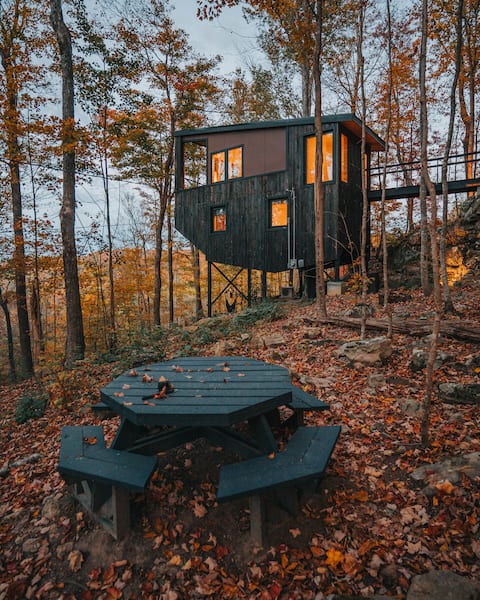
Top Performing Airbnb Properties in Altamont (2026)
Benchmark your potential! Explore examples of top-performing Airbnb properties in Altamontbased on Trailing Twelve Month (TTM) revenue. Analyze their characteristics, revenue, occupancy rate, and ADR to understand what drives success in this market.

Views, InstaFamous, 5min 2 Hikes, Dogs, HotTub
Entire Place • 4 bedrooms
Views l DogsOk l InstaFamous l Close to Hikes
Entire Place • 2 bedrooms

Views, Hot Tub, PictureFrame Windows, DogsOK
Entire Place • 2 bedrooms

Mossy Falls Cabin | Outdoor Hot Tub & Fire Pit!
Entire Place • 3 bedrooms

Views, HotTub, DogsOk, Close2Hikes, Firepit
Entire Place • 3 bedrooms
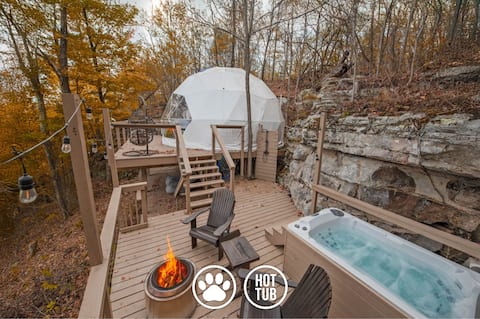
Ravens Point Luxury Glamping Dome w/ private spa
Entire Place • 1 bedroom
Note: Performance varies based on location, size, amenities, seasonality, and management quality. Data reflects the past 12 months.
Top Performing Airbnb Hosts in Altamont (2026)
Learn from the best! This table showcases top-performing Airbnb hosts in Altamont based on the number of properties managed and estimated total revenue over the past year. Analyze their scale and performance metrics.
| Host Name | Properties | Grossing Revenue | Stay Reviews | Avg Rating |
|---|---|---|---|---|
| Cullen | 4 | $376,044 | 426 | 4.89/5.0 |
| Timberroot Rustic Retreats | 4 | $174,043 | 53 | 4.88/5.0 |
| Jordan | 2 | $114,578 | 335 | 5.00/5.0 |
| Shelia | 17 | $111,661 | 161 | 4.92/5.0 |
| South Cumberland Getaways | 4 | $103,525 | 304 | 4.92/5.0 |
| Charles | 3 | $71,969 | 1018 | 4.97/5.0 |
| Leavetown Vacations | 1 | $69,762 | 37 | 4.92/5.0 |
| Dustin | 1 | $30,825 | 56 | 4.96/5.0 |
| Robert | 1 | $928 | 4 | 5.00/5.0 |
Analyzing the strategies of top hosts, such as their property selection, pricing, and guest communication, can offer valuable lessons for optimizing your own Airbnb operations in Altamont.
Dive Deeper: Advanced Altamont STR Market Data (2026)
Ready to unlock more insights? AirROI provides access to advanced metrics and comprehensive Airbnb data for Altamont. Explore detailed analytics beyond this report to refine your investment strategy, optimize pricing, and maximize your vacation rental profits.
Explore Advanced MetricsAltamont Short-Term Rental Market Composition (2026): Property & Room Types
Room Type Distribution
Property Type Distribution
Market Composition Insights for Altamont
- The Altamont Airbnb market composition is heavily skewed towards Entire Home/Apt listings, which make up 97.3% of the 37 active rentals. This indicates strong guest preference for privacy and space.
- Looking at the property type distribution in Altamont, Outdoor/Unique properties are the most common (48.6%), reflecting the local real estate landscape.
- Houses represent a significant 24.3% portion, catering likely to families or larger groups.
- Smaller segments like unique stays (combined 2.7%) offer potential for unique stay experiences.
Altamont Airbnb Room Capacity Analysis (2026): Bedroom Distribution
Distribution of Listings by Number of Bedrooms
Room Capacity Insights for Altamont
- The dominant room capacity in Altamont is 1 bedroom listings, making up 35.1% of the market. This suggests a strong demand for properties suitable for couples or solo travelers.
- Together, 1 bedroom and 2 bedrooms properties represent 67.5% of the active Airbnb listings in Altamont, indicating a high concentration in these sizes.
- A significant 27.0% of listings offer 3+ bedrooms, catering to larger groups and families seeking more space in Altamont.
Altamont Vacation Rental Guest Capacity Trends (2026)
Distribution of Listings by Guest Capacity
Guest Capacity Insights for Altamont
- The most common guest capacity trend in Altamont vacation rentals is listings accommodating 4 guests (29.7%). This suggests the primary traveler segment is likely small families or groups.
- Properties designed for 4 guests and 8+ guests dominate the Altamont STR market, accounting for 48.6% of listings.
- 29.7% of properties accommodate 6+ guests, serving the market segment for larger families or group travel in Altamont.
- On average, properties in Altamont are equipped to host 4.5 guests.
Altamont Airbnb Booking Patterns (2026): Available vs. Booked Days
Available Days Distribution
Booked Days Distribution
Booking Pattern Insights for Altamont
- The most common availability pattern in Altamont falls within the 271-366 days range, representing 43.2% of listings. This suggests many properties have significant open periods on their calendars.
- Approximately 75.6% of listings show high availability (181+ days open annually), indicating potential for increased bookings or specific owner usage patterns.
- For booked days, the 91-180 days range is most frequent in Altamont (32.4%), reflecting common guest stay durations or potential owner blocking patterns.
- A notable 24.3% of properties secure long booking periods (181+ days booked per year), highlighting successful long-term rental strategies or significant owner usage.
Altamont Airbnb Minimum Stay Requirements Analysis
Distribution of Listings by Minimum Night Requirement
1 Night
27 listings
73% of total
2 Nights
2 listings
5.4% of total
30+ Nights
8 listings
21.6% of total
Key Insights
- The most prevalent minimum stay requirement in Altamont is 1 Night, adopted by 73% of listings. This highlights the market's preference for shorter, flexible bookings.
- A strong majority (78.4%) of the Altamont Airbnb data shows acceptance of very short stays (1-2 nights), indicating a dynamic, high-turnover market.
- A significant segment (21.6%) caters to monthly stays (30+ nights) in Altamont, pointing to opportunities in the extended-stay market.
Recommendations
- Align with the market by considering a 1 Night minimum stay, as 73% of Altamont hosts use this setting.
- Explore offering discounts for stays of 30+ nights to attract the 21.6% of the market seeking extended stays.
- Adjust minimum nights based on seasonality – potentially shorter during low season and longer during peak demand periods in Altamont.
Altamont Airbnb Cancellation Policy Trends Analysis (2026)
Flexible
7 listings
18.9% of total
Moderate
19 listings
51.4% of total
Firm
8 listings
21.6% of total
Strict
3 listings
8.1% of total
Cancellation Policy Insights for Altamont
- The prevailing Airbnb cancellation policy trend in Altamont is Moderate, used by 51.4% of listings.
- The market strongly favors guest-friendly terms, with 70.3% of listings offering Flexible or Moderate policies. This suggests guests in Altamont may expect booking flexibility.
- Strict cancellation policies are quite rare (8.1%), potentially making listings with this policy less competitive unless justified by high demand or property type.
Recommendations for Hosts
- Consider adopting a Moderate policy to align with the 51.4% market standard in Altamont.
- Using a Strict policy might deter some guests, as only 8.1% of listings use it. Evaluate if potential revenue protection outweighs possible lower booking rates.
- Regularly review your cancellation policy against competitors and market demand shifts in Altamont.
Altamont STR Booking Lead Time Analysis (2026)
Average Booking Lead Time by Month
Booking Lead Time Insights for Altamont
- The overall average booking lead time for vacation rentals in Altamont is 34 days.
- Guests book furthest in advance for stays during November (average 53 days), likely coinciding with peak travel demand or local events.
- The shortest booking windows occur for stays in January (average 23 days), indicating more last-minute travel plans during this time.
- Seasonally, Fall (44 days avg.) sees the longest lead times, while Spring (30 days avg.) has the shortest, reflecting typical travel planning cycles.
Recommendations for Hosts
- Use the overall average lead time (34 days) as a baseline for your pricing and availability strategy in Altamont.
- For November stays, consider implementing length-of-stay discounts or slightly higher rates for bookings made less than 53 days out to capitalize on advance planning.
- Target marketing efforts for the Fall season well in advance (at least 44 days) to capture early planners.
- Monitor your own booking lead times against these Altamont averages to identify opportunities for dynamic pricing adjustments.
Popular & Essential Airbnb Amenities in Altamont (2026)
Amenity Prevalence
Amenity Insights for Altamont
- Essential amenities in Altamont that guests expect include: Free parking on premises, Wifi, Heating, Microwave. Lacking these (any) could significantly impact bookings.
- Popular amenities like Body soap, Coffee maker, Fire pit are common but not universal. Offering these can provide a competitive edge.
Recommendations for Hosts
- Ensure your listing includes all essential amenities for Altamont: Free parking on premises, Wifi, Heating, Microwave.
- Prioritize adding missing essentials: Heating, Microwave.
- Consider adding popular differentiators like Body soap or Coffee maker to increase appeal.
- Highlight unique or less common amenities you offer (e.g., hot tub, dedicated workspace, EV charger) in your listing description and photos.
- Regularly check competitor amenities in Altamont to stay competitive.
Altamont Airbnb Guest Demographics & Profile Analysis (2026)
Guest Profile Summary for Altamont
- The typical guest profile for Airbnb in Altamont consists of primarily domestic travelers (98%), often arriving from nearby Nashville, typically belonging to the Post-2000s (Gen Z/Alpha) group (50%), primarily speaking English or Spanish.
- Domestic travelers account for 97.8% of guests.
- Key international markets include United States (97.8%) and Canada (1.1%).
- Top languages spoken are English (77.8%) followed by Spanish (10.1%).
- A significant demographic segment is the Post-2000s (Gen Z/Alpha) group, representing 50% of guests.
Recommendations for Hosts
- Target domestic marketing efforts towards travelers from Nashville and Atlanta.
- Tailor amenities and listing descriptions to appeal to the dominant Post-2000s (Gen Z/Alpha) demographic (e.g., highlight fast WiFi, smart home features, local guides).
- Highlight unique local experiences or amenities relevant to the primary guest profile.
- Consider seasonal promotions aligned with peak travel times for key origin markets.
Nearby Short-Term Rental Market Comparison
How does the Altamont Airbnb market stack up against its neighbors? Compare key performance metrics like average monthly revenue, ADR, and occupancy rates in surrounding areas to understand the broader regional STR landscape.
| Market | Active Properties | Monthly Revenue | Daily Rate | Avg. Occupancy |
|---|---|---|---|---|
| Gilmer County | 26 | $5,298 | $459.59 | 40% |
| Brentwood | 14 | $4,937 | $601.43 | 47% |
| Fannin County | 42 | $4,574 | $435.93 | 38% |
| East Ellijay | 15 | $4,415 | $368.05 | 41% |
| Epworth | 79 | $4,411 | $406.97 | 40% |
| Berry Hill | 136 | $4,232 | $323.78 | 44% |
| Waleska | 45 | $4,041 | $373.64 | 42% |
| Coalmont | 13 | $3,864 | $240.00 | 52% |
| Blue Ridge | 1,346 | $3,859 | $347.45 | 41% |
| Loudon | 15 | $3,820 | $256.14 | 54% |