York Airbnb Market Analysis 2026: Short Term Rental Data & Vacation Rental Statistics in South Carolina, United States
Is Airbnb profitable in York in 2026? Explore comprehensive Airbnb analytics for York, South Carolina, United States to uncover income potential. This 2026 STR market report for York, based on AirROI data from February 2025 to January 2026, reveals key trends in the niche market of 20 active listings.
Whether you're considering an Airbnb investment in York, optimizing your existing vacation rental, or exploring rental arbitrage opportunities, understanding the York Airbnb data is crucial. Leveraging the low regulation environment is key to maximizing your short term rental income potential. Let's dive into the specifics.
Key York Airbnb Performance Metrics Overview
Monthly Airbnb Revenue Variations & Income Potential in York (2026)
Understanding the monthly revenue variations for Airbnb listings in York is key to maximizing your short term rental income potential. Seasonality significantly impacts earnings. Our analysis, based on data from the past 12 months, shows that the peak revenue month for STRs in York is typically July, while January often presents the lowest earnings, highlighting opportunities for strategic pricing adjustments during shoulder and low seasons. Explore the typical Airbnb income in York across different performance tiers:
- Best-in-class properties (Top 10%) achieve $9,789+ monthly, often utilizing dynamic pricing and superior guest experiences.
- Strong performing properties (Top 25%) earn $5,034 or more, indicating effective management and desirable locations/amenities.
- Typical properties (Median) generate around $2,331 per month, representing the average market performance.
- Entry-level properties (Bottom 25%) see earnings around $1,166, often with potential for optimization.
Average Monthly Airbnb Earnings Trend in York
York Airbnb Occupancy Rate Trends (2026)
Maximize your bookings by understanding the York STR occupancy trends. Seasonal demand shifts significantly influence how often properties are booked. Typically, Maysees the highest demand (peak season occupancy), while January experiences the lowest (low season). Effective strategies, like adjusting minimum stays or offering promotions, can boost occupancy during slower periods. Here's how different property tiers perform in York:
- Best-in-class properties (Top 10%) achieve 73%+ occupancy, indicating high desirability and potentially optimized availability.
- Strong performing properties (Top 25%) maintain 60% or higher occupancy, suggesting good market fit and guest satisfaction.
- Typical properties (Median) have an occupancy rate around 38%.
- Entry-level properties (Bottom 25%) average 22% occupancy, potentially facing higher vacancy.
Average Monthly Occupancy Rate Trend in York
Average Daily Rate (ADR) Airbnb Trends in York (2026)
Effective short term rental pricing strategy in York involves understanding monthly ADR fluctuations. The Average Daily Rate (ADR) for Airbnb in York typically peaks in September and dips lowest during January. Leveraging Airbnb dynamic pricing tools or strategies based on this seasonality can significantly boost revenue. Here's a look at the typical nightly rates achieved:
- Best-in-class properties (Top 10%) command rates of $760+ per night, often due to premium features or locations.
- Strong performing properties (Top 25%) achieve nightly rates of $537 or more.
- Typical properties (Median) charge around $181 per night.
- Entry-level properties (Bottom 25%) earn around $95 per night.
Average Daily Rate (ADR) Trend by Month in York
Get Live York Market Intelligence 👇

Explore Real-time Analytics
Airbnb Seasonality Analysis & Trends in York (2026)
Peak Season (July, June, August)
- Revenue averages $5,381 per month
- Occupancy rates average 44.6%
- Daily rates average $327
Shoulder Season
- Revenue averages $3,796 per month
- Occupancy maintains around 41.6%
- Daily rates hold near $316
Low Season (January, February, March)
- Revenue drops to average $2,074 per month
- Occupancy decreases to average 38.4%
- Daily rates adjust to average $293
Seasonality Insights for York
- The Airbnb seasonality in York shows highly seasonal trends requiring careful strategy. While the sections above show seasonal averages, it's also insightful to look at the extremes:
- During the high season, the absolute peak month showcases York's highest earning potential, with monthly revenues capable of climbing to $6,025, occupancy reaching a high of 56.0%, and ADRs peaking at $354.
- Conversely, the slowest single month of the year, typically falling within the low season, marks the market's lowest point. In this month, revenue might dip to $1,804, occupancy could drop to 25.5%, and ADRs may adjust down to $285.
- Understanding both the seasonal averages and these monthly peaks and troughs in revenue, occupancy, and ADR is crucial for maximizing your Airbnb profit potential in York.
Seasonal Strategies for Maximizing Profit
- Peak Season: Maximize revenue through premium pricing and potentially longer minimum stays. Ensure high availability.
- Low Season: Offer competitive pricing, special promotions (e.g., extended stay discounts), and flexible cancellation policies. Target off-season travelers like remote workers or budget-conscious guests.
- Shoulder Seasons: Implement dynamic pricing that balances peak and low rates. Target weekend travelers or specific events. Offer slightly more flexible terms than peak season.
- Regularly analyze your own performance against these York seasonality benchmarks and adjust your pricing and availability strategy accordingly.
Best Areas for Airbnb Investment in York (2026)
Exploring the top neighborhoods for short-term rentals in York? This section highlights key areas, outlining why they are attractive for hosts and guests, along with notable local attractions. Consider these locations based on your target guest profile and investment strategy.
| Neighborhood / Area | Why Host Here? (Target Guests & Appeal) | Key Attractions & Landmarks |
|---|---|---|
| Historic District | Charming area with preserved 19th-century architecture and rich history. Perfect for tourists interested in heritage, culture, and Southern hospitality. | York County Courthouse, The Guest House, York Historic Cemetery, Historic York, York Community Theater |
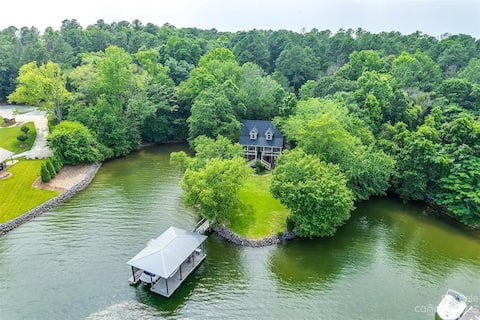
| Lake Wylie | Scenic lakeside area ideal for outdoor activities such as fishing and boating. Popular among families looking for a relaxing getaway. | Lake Wylie, Buster Boyd Bridge, Lake Wylie Marina, McDowell Nature Center, Windjammer Park |
| Downtown York | Vibrant downtown with shops, restaurants, and local events. Attractive for visitors wanting to experience the local lifestyle and community. | York Farmers Market, Main Street shops, Local restaurants, York County Library, Mason-Dixon Park |
| Clover | Nearby town that offers a quaint and relaxing environment with small-town charm. Great for visitors looking for a peaceful retreat. | Clover Community Park, Historic Clover, Lake Wylie Nature Trail, Clover Museum |
| Fort Mill | Growing and popular town with shopping and attractions nearby. Appeals to visitors seeking modern conveniences and family-friendly activities. | Carowinds Amusement Park, Old Town Fort Mill, Anne Springs Close Greenway, Fort Mill History Museum |
| Tega Cay | Lakeside community offering outdoor recreational activities and beautiful views. Attracts nature lovers and families during the summer months. | Tega Cay Golf Club, Windjammer Park, Lake Tega Cay, Tega Cay Beach |
| Rock Hill | Larger nearby city with a variety of attractions and amenities. Suitable for those looking to access a wider range of activities and nightlife. | Winthrop University, Old Town Rock Hill, Riverwalk, Catawba River, Rock Hill Sports and Events Center |
| Kings Mountain | Historic area with parks and outdoor activities. Great for visitors who enjoy hiking and history. | Kings Mountain National Military Park, Kings Mountain State Park, The Joy Performance Center |
Understanding Airbnb License Requirements & STR Laws in York (2026)
While York, South Carolina, United States currently shows low STR regulations, specific Airbnb license requirements might still exist or change. Always verify the latest short term rental regulations and Airbnb license requirements directly with local government authorities for York to ensure full compliance before hosting.
(Source: AirROI data, 2026, finding no licensed listings among those analyzed)
Top Performing Airbnb Properties in York (2026)
Benchmark your potential! Explore examples of top-performing Airbnb properties in Yorkbased on Trailing Twelve Month (TTM) revenue. Analyze their characteristics, revenue, occupancy rate, and ADR to understand what drives success in this market.

5BR Farmhouse Lake Retreat—Hot Tub—Theater—Firepit
Entire Place • 5 bedrooms
Secluded Lake Point, Quiet Cove with Game Room
Entire Place • 3 bedrooms

Dock & Home Theater: Pet-Friendly Lake Wylie Home
Entire Place • 5 bedrooms
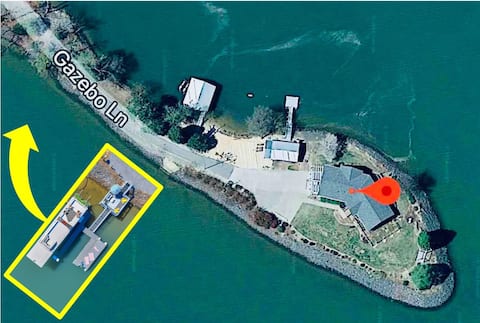
7 Bedroom Private Peninsula with Houseboat -Moored
Entire Place • 7 bedrooms
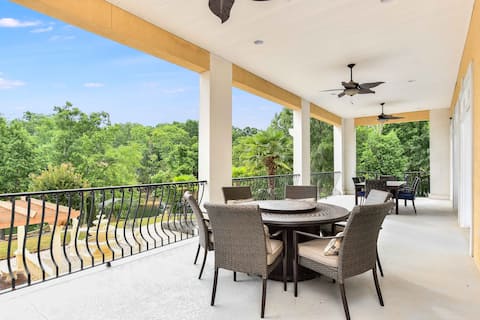
Majestic Lakeview Estate + Outdoor Fireplace, Dock
Entire Place • 5 bedrooms
Bottle Tree @ Quiet Cove-Lake Wylie
Entire Place • 2 bedrooms
Note: Performance varies based on location, size, amenities, seasonality, and management quality. Data reflects the past 12 months.
Top Performing Airbnb Hosts in York (2026)
Learn from the best! This table showcases top-performing Airbnb hosts in York based on the number of properties managed and estimated total revenue over the past year. Analyze their scale and performance metrics.
| Host Name | Properties | Grossing Revenue | Stay Reviews | Avg Rating |
|---|---|---|---|---|
| EVERLONG Residential | 1 | $118,561 | 44 | 4.91/5.0 |
| Evolve | 2 | $102,785 | 43 | 4.96/5.0 |
| Chris | 1 | $97,553 | 55 | 4.96/5.0 |
| Rick | 3 | $86,738 | 35 | 4.82/5.0 |
| Lakelyne | 1 | $47,677 | 10 | 5.00/5.0 |
| Derek | 1 | $44,746 | 91 | 5.00/5.0 |
| Justin | 1 | $41,089 | 36 | 4.97/5.0 |
| Meg | 1 | $24,029 | 48 | 5.00/5.0 |
| Elissa | 1 | $22,632 | 210 | 4.95/5.0 |
| Devin | 1 | $21,206 | 125 | 4.90/5.0 |
Analyzing the strategies of top hosts, such as their property selection, pricing, and guest communication, can offer valuable lessons for optimizing your own Airbnb operations in York.
Dive Deeper: Advanced York STR Market Data (2026)
Ready to unlock more insights? AirROI provides access to advanced metrics and comprehensive Airbnb data for York. Explore detailed analytics beyond this report to refine your investment strategy, optimize pricing, and maximize your vacation rental profits.
Explore Advanced MetricsYork Short-Term Rental Market Composition (2026): Property & Room Types
Room Type Distribution
Property Type Distribution
Market Composition Insights for York
- The York Airbnb market composition is heavily skewed towards Entire Home/Apt listings, which make up 85% of the 20 active rentals. This indicates strong guest preference for privacy and space.
- Looking at the property type distribution in York, House properties are the most common (80%), reflecting the local real estate landscape.
- Houses represent a significant 80% portion, catering likely to families or larger groups.
York Airbnb Room Capacity Analysis (2026): Bedroom Distribution
Distribution of Listings by Number of Bedrooms
Room Capacity Insights for York
- The dominant room capacity in York is 5+ bedrooms listings, making up 25% of the market. This suggests a strong demand for properties suitable for families or small groups.
- Together, 5+ bedrooms and 1 bedroom properties represent 50.0% of the active Airbnb listings in York, indicating a high concentration in these sizes.
- A significant 45.0% of listings offer 3+ bedrooms, catering to larger groups and families seeking more space in York.
York Vacation Rental Guest Capacity Trends (2026)
Distribution of Listings by Guest Capacity
Guest Capacity Insights for York
- The most common guest capacity trend in York vacation rentals is listings accommodating 8+ guests (35%). This suggests the primary traveler segment is likely larger groups.
- Properties designed for 8+ guests and 4 guests dominate the York STR market, accounting for 60.0% of listings.
- 45.0% of properties accommodate 6+ guests, serving the market segment for larger families or group travel in York.
- On average, properties in York are equipped to host 5.0 guests.
York Airbnb Booking Patterns (2026): Available vs. Booked Days
Available Days Distribution
Booked Days Distribution
Booking Pattern Insights for York
- The most common availability pattern in York falls within the 181-270 days range, representing 45% of listings. This suggests many properties have significant open periods on their calendars.
- Approximately 85.0% of listings show high availability (181+ days open annually), indicating potential for increased bookings or specific owner usage patterns.
- For booked days, the 91-180 days range is most frequent in York (45%), reflecting common guest stay durations or potential owner blocking patterns.
- A notable 15.0% of properties secure long booking periods (181+ days booked per year), highlighting successful long-term rental strategies or significant owner usage.
York Airbnb Minimum Stay Requirements Analysis
Distribution of Listings by Minimum Night Requirement
1 Night
6 listings
30% of total
2 Nights
3 listings
15% of total
3 Nights
1 listings
5% of total
7-29 Nights
2 listings
10% of total
30+ Nights
8 listings
40% of total
Key Insights
- The most prevalent minimum stay requirement in York is 30+ Nights, adopted by 40% of listings. This highlights the market's preference for longer commitments.
- A significant segment (40%) caters to monthly stays (30+ nights) in York, pointing to opportunities in the extended-stay market.
Recommendations
- Align with the market by considering a 30+ Nights minimum stay, as 40% of York hosts use this setting.
- Explore offering discounts for stays of 30+ nights to attract the 40% of the market seeking extended stays.
- Adjust minimum nights based on seasonality – potentially shorter during low season and longer during peak demand periods in York.
York Airbnb Cancellation Policy Trends Analysis (2026)
Flexible
5 listings
25% of total
Moderate
7 listings
35% of total
Firm
4 listings
20% of total
Strict
4 listings
20% of total
Cancellation Policy Insights for York
- The prevailing Airbnb cancellation policy trend in York is Moderate, used by 35% of listings.
- There's a relatively balanced mix between guest-friendly (60.0%) and stricter (40.0%) policies, offering choices for different guest needs.
Recommendations for Hosts
- Consider adopting a Moderate policy to align with the 35% market standard in York.
- Regularly review your cancellation policy against competitors and market demand shifts in York.
York STR Booking Lead Time Analysis (2026)
Average Booking Lead Time by Month
Booking Lead Time Insights for York
- The overall average booking lead time for vacation rentals in York is 47 days.
- Guests book furthest in advance for stays during November (average 60 days), likely coinciding with peak travel demand or local events.
- The shortest booking windows occur for stays in January (average 16 days), indicating more last-minute travel plans during this time.
- Seasonally, Spring (48 days avg.) sees the longest lead times, while Winter (20 days avg.) has the shortest, reflecting typical travel planning cycles.
Recommendations for Hosts
- Use the overall average lead time (47 days) as a baseline for your pricing and availability strategy in York.
- For November stays, consider implementing length-of-stay discounts or slightly higher rates for bookings made less than 60 days out to capitalize on advance planning.
- Target marketing efforts for the Spring season well in advance (at least 48 days) to capture early planners.
- Monitor your own booking lead times against these York averages to identify opportunities for dynamic pricing adjustments.
Popular & Essential Airbnb Amenities in York (2026)
Amenity Prevalence
Amenity Insights for York
- Essential amenities in York that guests expect include: Coffee maker, Smoke alarm, TV, Carbon monoxide alarm, Microwave, Air conditioning, Free parking on premises, Dishes and silverware, Wifi, Kitchen. Lacking these (any) could significantly impact bookings.
Recommendations for Hosts
- Ensure your listing includes all essential amenities for York: Coffee maker, Smoke alarm, TV, Carbon monoxide alarm, Microwave, Air conditioning, Free parking on premises, Dishes and silverware, Wifi, Kitchen.
- Prioritize adding missing essentials: Dishes and silverware, Wifi, Kitchen.
- Highlight unique or less common amenities you offer (e.g., hot tub, dedicated workspace, EV charger) in your listing description and photos.
- Regularly check competitor amenities in York to stay competitive.
York Airbnb Guest Demographics & Profile Analysis (2026)
Guest Profile Summary for York
- The typical guest profile for Airbnb in York consists of primarily domestic travelers (97%), often arriving from nearby Charlotte, typically belonging to the Post-2000s (Gen Z/Alpha) group (50%), primarily speaking English or Spanish.
- Domestic travelers account for 96.6% of guests.
- Key international markets include United States (96.6%) and DC (2.6%).
- Top languages spoken are English (73.3%) followed by Spanish (8.9%).
- A significant demographic segment is the Post-2000s (Gen Z/Alpha) group, representing 50% of guests.
Recommendations for Hosts
- Target domestic marketing efforts towards travelers from Charlotte and Jacksonville.
- Tailor amenities and listing descriptions to appeal to the dominant Post-2000s (Gen Z/Alpha) demographic (e.g., highlight fast WiFi, smart home features, local guides).
- Highlight unique local experiences or amenities relevant to the primary guest profile.
- Consider seasonal promotions aligned with peak travel times for key origin markets.
Nearby Short-Term Rental Market Comparison
How does the York Airbnb market stack up against its neighbors? Compare key performance metrics like average monthly revenue, ADR, and occupancy rates in surrounding areas to understand the broader regional STR landscape.
| Market | Active Properties | Monthly Revenue | Daily Rate | Avg. Occupancy |
|---|---|---|---|---|
| Denver | 109 | $6,309 | $590.96 | 45% |
| Catawba | 16 | $6,093 | $582.49 | 38% |
| Mooresville | 369 | $5,702 | $559.93 | 42% |
| Sherrills Ford | 107 | $5,615 | $547.26 | 41% |
| Troutman | 49 | $5,587 | $467.90 | 42% |
| Lake Norman of Catawba | 51 | $4,972 | $513.30 | 43% |
| Union Mills | 15 | $4,938 | $442.76 | 41% |
| Six Mile | 57 | $4,396 | $449.78 | 42% |
| West Union | 30 | $4,126 | $564.92 | 32% |
| Chapin | 93 | $3,971 | $386.37 | 43% |