Simpsonville Airbnb Market Analysis 2026: Short Term Rental Data & Vacation Rental Statistics in South Carolina, United States
Is Airbnb profitable in Simpsonville in 2026? Explore comprehensive Airbnb analytics for Simpsonville, South Carolina, United States to uncover income potential. This 2026 STR market report for Simpsonville, based on AirROI data from February 2025 to January 2026, reveals key trends in the niche market of 99 active listings.
Whether you're considering an Airbnb investment in Simpsonville, optimizing your existing vacation rental, or exploring rental arbitrage opportunities, understanding the Simpsonville Airbnb data is crucial. Leveraging the low regulation environment is key to maximizing your short term rental income potential. Let's dive into the specifics.
Key Simpsonville Airbnb Performance Metrics Overview
Monthly Airbnb Revenue Variations & Income Potential in Simpsonville (2026)
Understanding the monthly revenue variations for Airbnb listings in Simpsonville is key to maximizing your short term rental income potential. Seasonality significantly impacts earnings. Our analysis, based on data from the past 12 months, shows that the peak revenue month for STRs in Simpsonville is typically July, while January often presents the lowest earnings, highlighting opportunities for strategic pricing adjustments during shoulder and low seasons. Explore the typical Airbnb income in Simpsonville across different performance tiers:
- Best-in-class properties (Top 10%) achieve $5,264+ monthly, often utilizing dynamic pricing and superior guest experiences.
- Strong performing properties (Top 25%) earn $3,579 or more, indicating effective management and desirable locations/amenities.
- Typical properties (Median) generate around $2,292 per month, representing the average market performance.
- Entry-level properties (Bottom 25%) see earnings around $839, often with potential for optimization.
Average Monthly Airbnb Earnings Trend in Simpsonville
Simpsonville Airbnb Occupancy Rate Trends (2026)
Maximize your bookings by understanding the Simpsonville STR occupancy trends. Seasonal demand shifts significantly influence how often properties are booked. Typically, Marchsees the highest demand (peak season occupancy), while January experiences the lowest (low season). Effective strategies, like adjusting minimum stays or offering promotions, can boost occupancy during slower periods. Here's how different property tiers perform in Simpsonville:
- Best-in-class properties (Top 10%) achieve 84%+ occupancy, indicating high desirability and potentially optimized availability.
- Strong performing properties (Top 25%) maintain 70% or higher occupancy, suggesting good market fit and guest satisfaction.
- Typical properties (Median) have an occupancy rate around 50%.
- Entry-level properties (Bottom 25%) average 25% occupancy, potentially facing higher vacancy.
Average Monthly Occupancy Rate Trend in Simpsonville
Average Daily Rate (ADR) Airbnb Trends in Simpsonville (2026)
Effective short term rental pricing strategy in Simpsonville involves understanding monthly ADR fluctuations. The Average Daily Rate (ADR) for Airbnb in Simpsonville typically peaks in October and dips lowest during February. Leveraging Airbnb dynamic pricing tools or strategies based on this seasonality can significantly boost revenue. Here's a look at the typical nightly rates achieved:
- Best-in-class properties (Top 10%) command rates of $283+ per night, often due to premium features or locations.
- Strong performing properties (Top 25%) achieve nightly rates of $191 or more.
- Typical properties (Median) charge around $120 per night.
- Entry-level properties (Bottom 25%) earn around $57 per night.
Average Daily Rate (ADR) Trend by Month in Simpsonville
Get Live Simpsonville Market Intelligence 👇

Explore Real-time Analytics
Airbnb Seasonality Analysis & Trends in Simpsonville (2026)
Peak Season (July, August, March)
- Revenue averages $3,119 per month
- Occupancy rates average 55.4%
- Daily rates average $147
Shoulder Season
- Revenue averages $2,692 per month
- Occupancy maintains around 49.6%
- Daily rates hold near $155
Low Season (January, September, December)
- Revenue drops to average $2,190 per month
- Occupancy decreases to average 38.5%
- Daily rates adjust to average $168
Seasonality Insights for Simpsonville
- The Airbnb seasonality in Simpsonville shows moderate seasonality with distinct peak and low periods. While the sections above show seasonal averages, it's also insightful to look at the extremes:
- During the high season, the absolute peak month showcases Simpsonville's highest earning potential, with monthly revenues capable of climbing to $3,347, occupancy reaching a high of 59.9%, and ADRs peaking at $174.
- Conversely, the slowest single month of the year, typically falling within the low season, marks the market's lowest point. In this month, revenue might dip to $1,945, occupancy could drop to 35.9%, and ADRs may adjust down to $140.
- Understanding both the seasonal averages and these monthly peaks and troughs in revenue, occupancy, and ADR is crucial for maximizing your Airbnb profit potential in Simpsonville.
Seasonal Strategies for Maximizing Profit
- Peak Season: Maximize revenue through premium pricing and potentially longer minimum stays. Ensure high availability.
- Low Season: Offer competitive pricing, special promotions (e.g., extended stay discounts), and flexible cancellation policies. Target off-season travelers like remote workers or budget-conscious guests.
- Shoulder Seasons: Implement dynamic pricing that balances peak and low rates. Target weekend travelers or specific events. Offer slightly more flexible terms than peak season.
- Regularly analyze your own performance against these Simpsonville seasonality benchmarks and adjust your pricing and availability strategy accordingly.
Best Areas for Airbnb Investment in Simpsonville (2026)
Exploring the top neighborhoods for short-term rentals in Simpsonville? This section highlights key areas, outlining why they are attractive for hosts and guests, along with notable local attractions. Consider these locations based on your target guest profile and investment strategy.
| Neighborhood / Area | Why Host Here? (Target Guests & Appeal) | Key Attractions & Landmarks |
|---|---|---|
| Downtown Simpsonville | The heart of Simpsonville, featuring a vibrant atmosphere with shops, restaurants, and parks. Ideal for visitors looking for convenience and local charm. | Simpsonville City Park, Heritage Park, Main Street shops, local dining options, Simpsonville Arts Center |
| Five Forks | A family-friendly neighborhood with excellent schools and amenities. Popular with families and those looking for a quieter stay while still being close to attractions. | Five Forks Library, local parks, shopping centers, great dining options, Reedy River Park |
| Verdae | An upscale community known for its modern homes and access to nature. Attracts travelers looking for a peaceful retreat with easy access to Greenville. | Converse College, Greenville Zoo, Stone Lakes, golf courses, hiking trails |
| Woodruff Road | A bustling area with a mix of commercial and residential spaces. Perfect for guests interested in shopping and dining. | Haywood Mall, Restoration Church, local eateries, spa services, movie theaters |
| Mauldin | Close to Simpsonville, this area has a friendly community vibe and is a good base for exploring nearby attractions. | Mauldin Sports Center, local parks, shopping centers, family-friendly restaurants, community events |
| Hunter's Creek | A peaceful suburb with ample green space. Great for travelers seeking relaxation and outdoor activities. | local hiking trails, community parks, Kayak rentals, bike paths, family activities |
| Cleveland Park | Located just a short drive from Simpsonville, Cleveland Park is known for its beautiful landscape and recreational amenities. Attracts nature lovers and families. | Cleveland Park playgrounds, waterfalls, walking trails, picnic areas, Reedy River |
| Lake Robinson | A scenic area around the lake that offers a tranquil escape and water activities. Ideal for those looking for outdoor experiences. | Lake Robinson Park, fishing spots, hiking trails, picnic areas, nature watching |
Understanding Airbnb License Requirements & STR Laws in Simpsonville (2026)
While Simpsonville, South Carolina, United States currently shows low STR regulations, specific Airbnb license requirements might still exist or change. Always verify the latest short term rental regulations and Airbnb license requirements directly with local government authorities for Simpsonville to ensure full compliance before hosting.
(Source: AirROI data, 2026, finding no licensed listings among those analyzed)
Top Performing Airbnb Properties in Simpsonville (2026)
Benchmark your potential! Explore examples of top-performing Airbnb properties in Simpsonvillebased on Trailing Twelve Month (TTM) revenue. Analyze their characteristics, revenue, occupancy rate, and ADR to understand what drives success in this market.
The Wright Place! 25/min DT G-Ville. Pool/Hottub.
Entire Place • 5 bedrooms

Luxury Retreat & Heated Pool Downtown Simpsonville
Entire Place • 4 bedrooms
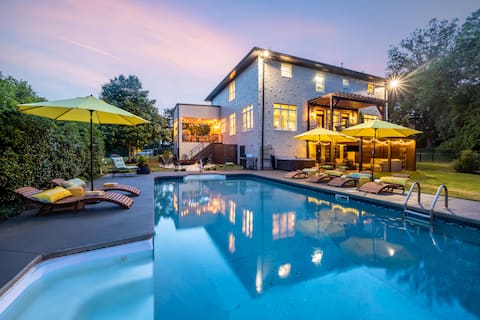
Fabulous 5 Bedroom Home W/ Resort Style Amenities
Entire Place • 7 bedrooms
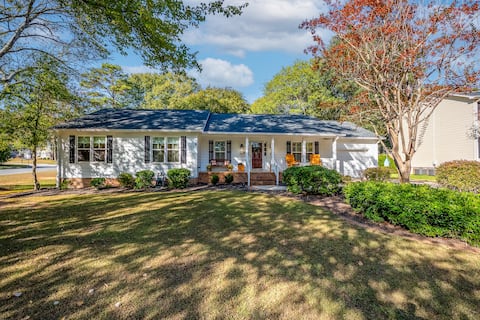
The Taylor House
Entire Place • 4 bedrooms

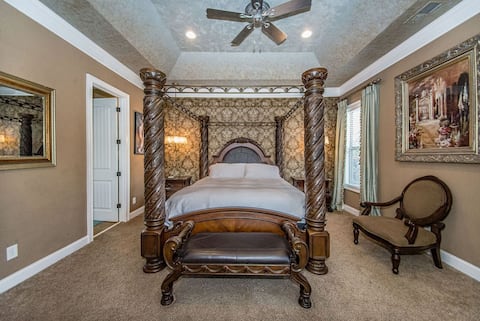
Lux Estate Pool Hot Tub Theater!
Entire Place • 5 bedrooms

Entire Duplex w/backyard firepit, great for groups
Entire Place • 6 bedrooms
Note: Performance varies based on location, size, amenities, seasonality, and management quality. Data reflects the past 12 months.
Top Performing Airbnb Hosts in Simpsonville (2026)
Learn from the best! This table showcases top-performing Airbnb hosts in Simpsonville based on the number of properties managed and estimated total revenue over the past year. Analyze their scale and performance metrics.
| Host Name | Properties | Grossing Revenue | Stay Reviews | Avg Rating |
|---|---|---|---|---|
| Melanie | 1 | $169,297 | 42 | 4.95/5.0 |
| Shari | 3 | $111,353 | 628 | 4.94/5.0 |
| Talia | 1 | $92,942 | 74 | 4.95/5.0 |
| Stephanie | 2 | $88,542 | 45 | 5.00/5.0 |
| Brad And Tiffany | 2 | $73,966 | 262 | 4.98/5.0 |
| Lauren | 2 | $69,911 | 431 | 4.96/5.0 |
| Brigitte | 1 | $67,417 | 24 | 5.00/5.0 |
| Tatiane | 14 | $67,085 | 149 | 4.85/5.0 |
| Adam | 1 | $64,660 | 49 | 4.90/5.0 |
| Bob | 1 | $62,994 | 1 | Not Rated |
Analyzing the strategies of top hosts, such as their property selection, pricing, and guest communication, can offer valuable lessons for optimizing your own Airbnb operations in Simpsonville.
Dive Deeper: Advanced Simpsonville STR Market Data (2026)
Ready to unlock more insights? AirROI provides access to advanced metrics and comprehensive Airbnb data for Simpsonville. Explore detailed analytics beyond this report to refine your investment strategy, optimize pricing, and maximize your vacation rental profits.
Explore Advanced MetricsSimpsonville Short-Term Rental Market Composition (2026): Property & Room Types
Room Type Distribution
Property Type Distribution
Market Composition Insights for Simpsonville
- The Simpsonville Airbnb market composition is heavily skewed towards Entire Home/Apt listings, which make up 72.7% of the 99 active rentals. This indicates strong guest preference for privacy and space.
- Looking at the property type distribution in Simpsonville, House properties are the most common (86.9%), reflecting the local real estate landscape.
- Houses represent a significant 86.9% portion, catering likely to families or larger groups.
- Smaller segments like others, hotel/boutique, outdoor/unique (combined 6.0%) offer potential for unique stay experiences.
Simpsonville Airbnb Room Capacity Analysis (2026): Bedroom Distribution
Distribution of Listings by Number of Bedrooms
Room Capacity Insights for Simpsonville
- The dominant room capacity in Simpsonville is 3 bedrooms listings, making up 30.3% of the market. This suggests a strong demand for properties suitable for families or small groups.
- Together, 3 bedrooms and 1 bedroom properties represent 43.4% of the active Airbnb listings in Simpsonville, indicating a high concentration in these sizes.
- A significant 50.5% of listings offer 3+ bedrooms, catering to larger groups and families seeking more space in Simpsonville.
Simpsonville Vacation Rental Guest Capacity Trends (2026)
Distribution of Listings by Guest Capacity
Guest Capacity Insights for Simpsonville
- The most common guest capacity trend in Simpsonville vacation rentals is listings accommodating 8+ guests (26.3%). This suggests the primary traveler segment is likely larger groups.
- Properties designed for 8+ guests and 6 guests dominate the Simpsonville STR market, accounting for 49.5% of listings.
- 52.5% of properties accommodate 6+ guests, serving the market segment for larger families or group travel in Simpsonville.
- On average, properties in Simpsonville are equipped to host 4.4 guests.
Simpsonville Airbnb Booking Patterns (2026): Available vs. Booked Days
Available Days Distribution
Booked Days Distribution
Booking Pattern Insights for Simpsonville
- The most common availability pattern in Simpsonville falls within the 271-366 days range, representing 34.3% of listings. This suggests many properties have significant open periods on their calendars.
- Approximately 65.6% of listings show high availability (181+ days open annually), indicating potential for increased bookings or specific owner usage patterns.
- For booked days, the 91-180 days range is most frequent in Simpsonville (31.3%), reflecting common guest stay durations or potential owner blocking patterns.
- A notable 34.3% of properties secure long booking periods (181+ days booked per year), highlighting successful long-term rental strategies or significant owner usage.
Simpsonville Airbnb Minimum Stay Requirements Analysis
Distribution of Listings by Minimum Night Requirement
1 Night
18 listings
18.2% of total
2 Nights
25 listings
25.3% of total
3 Nights
9 listings
9.1% of total
4-6 Nights
5 listings
5.1% of total
7-29 Nights
8 listings
8.1% of total
30+ Nights
34 listings
34.3% of total
Key Insights
- The most prevalent minimum stay requirement in Simpsonville is 30+ Nights, adopted by 34.3% of listings. This highlights the market's preference for longer commitments.
- A significant segment (34.3%) caters to monthly stays (30+ nights) in Simpsonville, pointing to opportunities in the extended-stay market.
Recommendations
- Align with the market by considering a 30+ Nights minimum stay, as 34.3% of Simpsonville hosts use this setting.
- If feasible, allowing 1-night stays, especially midweek or during low season, could capture last-minute bookings, as only 18.2% currently do.
- Explore offering discounts for stays of 30+ nights to attract the 34.3% of the market seeking extended stays.
- Adjust minimum nights based on seasonality – potentially shorter during low season and longer during peak demand periods in Simpsonville.
Simpsonville Airbnb Cancellation Policy Trends Analysis (2026)
Limited
1 listings
1% of total
Flexible
21 listings
21.2% of total
Moderate
31 listings
31.3% of total
Firm
38 listings
38.4% of total
Strict
8 listings
8.1% of total
Cancellation Policy Insights for Simpsonville
- The prevailing Airbnb cancellation policy trend in Simpsonville is Firm, used by 38.4% of listings.
- There's a relatively balanced mix between guest-friendly (52.5%) and stricter (46.5%) policies, offering choices for different guest needs.
- Strict cancellation policies are quite rare (8.1%), potentially making listings with this policy less competitive unless justified by high demand or property type.
Recommendations for Hosts
- Consider adopting a Firm policy to align with the 38.4% market standard in Simpsonville.
- Using a Strict policy might deter some guests, as only 8.1% of listings use it. Evaluate if potential revenue protection outweighs possible lower booking rates.
- Regularly review your cancellation policy against competitors and market demand shifts in Simpsonville.
Simpsonville STR Booking Lead Time Analysis (2026)
Average Booking Lead Time by Month
Booking Lead Time Insights for Simpsonville
- The overall average booking lead time for vacation rentals in Simpsonville is 28 days.
- Guests book furthest in advance for stays during October (average 41 days), likely coinciding with peak travel demand or local events.
- The shortest booking windows occur for stays in January (average 15 days), indicating more last-minute travel plans during this time.
- Seasonally, Fall (38 days avg.) sees the longest lead times, while Winter (25 days avg.) has the shortest, reflecting typical travel planning cycles.
Recommendations for Hosts
- Use the overall average lead time (28 days) as a baseline for your pricing and availability strategy in Simpsonville.
- For October stays, consider implementing length-of-stay discounts or slightly higher rates for bookings made less than 41 days out to capitalize on advance planning.
- Target marketing efforts for the Fall season well in advance (at least 38 days) to capture early planners.
- Monitor your own booking lead times against these Simpsonville averages to identify opportunities for dynamic pricing adjustments.
Popular & Essential Airbnb Amenities in Simpsonville (2026)
Amenity Prevalence
Amenity Insights for Simpsonville
- Essential amenities in Simpsonville that guests expect include: Smoke alarm, TV, Air conditioning, Wifi, Free parking on premises, Kitchen. Lacking these (any) could significantly impact bookings.
- Popular amenities like Heating, Microwave, Cooking basics are common but not universal. Offering these can provide a competitive edge.
Recommendations for Hosts
- Ensure your listing includes all essential amenities for Simpsonville: Smoke alarm, TV, Air conditioning, Wifi, Free parking on premises, Kitchen.
- Prioritize adding missing essentials: Smoke alarm, TV, Air conditioning, Wifi, Free parking on premises, Kitchen.
- Consider adding popular differentiators like Heating or Microwave to increase appeal.
- Highlight unique or less common amenities you offer (e.g., hot tub, dedicated workspace, EV charger) in your listing description and photos.
- Regularly check competitor amenities in Simpsonville to stay competitive.
Simpsonville Airbnb Guest Demographics & Profile Analysis (2026)
Guest Profile Summary for Simpsonville
- The typical guest profile for Airbnb in Simpsonville consists of primarily domestic travelers (96%), often arriving from nearby Greenville, typically belonging to the Post-2000s (Gen Z/Alpha) group (50%), primarily speaking English or Spanish.
- Domestic travelers account for 96.3% of guests.
- Key international markets include United States (96.3%) and Mexico (0.9%).
- Top languages spoken are English (74%) followed by Spanish (11.4%).
- A significant demographic segment is the Post-2000s (Gen Z/Alpha) group, representing 50% of guests.
Recommendations for Hosts
- Target domestic marketing efforts towards travelers from Greenville and Charleston.
- Tailor amenities and listing descriptions to appeal to the dominant Post-2000s (Gen Z/Alpha) demographic (e.g., highlight fast WiFi, smart home features, local guides).
- Highlight unique local experiences or amenities relevant to the primary guest profile.
- Consider seasonal promotions aligned with peak travel times for key origin markets.
Nearby Short-Term Rental Market Comparison
How does the Simpsonville Airbnb market stack up against its neighbors? Compare key performance metrics like average monthly revenue, ADR, and occupancy rates in surrounding areas to understand the broader regional STR landscape.
| Market | Active Properties | Monthly Revenue | Daily Rate | Avg. Occupancy |
|---|---|---|---|---|
| Sevier County | 68 | $7,108 | $567.95 | 44% |
| Catawba | 16 | $6,093 | $582.49 | 38% |
| Bogart | 13 | $5,528 | $637.81 | 35% |
| Union Mills | 15 | $4,938 | $442.76 | 41% |
| Sevierville | 6,269 | $4,747 | $370.20 | 46% |
| Six Mile | 57 | $4,396 | $449.78 | 42% |
| Gatlinburg | 3,565 | $4,385 | $353.70 | 45% |
| Commerce | 19 | $4,298 | $285.34 | 45% |
| Eatonton | 236 | $4,178 | $502.80 | 33% |
| Pigeon Forge | 2,938 | $4,158 | $337.10 | 45% |