North Litchfield Beach Airbnb Market Analysis 2026: Short Term Rental Data & Vacation Rental Statistics in South Carolina, United States
Is Airbnb profitable in North Litchfield Beach in 2026? Explore comprehensive Airbnb analytics for North Litchfield Beach, South Carolina, United States to uncover income potential. This 2026 STR market report for North Litchfield Beach, based on AirROI data from February 2025 to January 2026, reveals key trends in the niche market of 144 active listings.
Whether you're considering an Airbnb investment in North Litchfield Beach, optimizing your existing vacation rental, or exploring rental arbitrage opportunities, understanding the North Litchfield Beach Airbnb data is crucial. Leveraging the low regulation environment is key to maximizing your short term rental income potential. Let's dive into the specifics.
Key North Litchfield Beach Airbnb Performance Metrics Overview
Monthly Airbnb Revenue Variations & Income Potential in North Litchfield Beach (2026)
Understanding the monthly revenue variations for Airbnb listings in North Litchfield Beach is key to maximizing your short term rental income potential. Seasonality significantly impacts earnings. Our analysis, based on data from the past 12 months, shows that the peak revenue month for STRs in North Litchfield Beach is typically July, while January often presents the lowest earnings, highlighting opportunities for strategic pricing adjustments during shoulder and low seasons. Explore the typical Airbnb income in North Litchfield Beach across different performance tiers:
- Best-in-class properties (Top 10%) achieve $8,428+ monthly, often utilizing dynamic pricing and superior guest experiences.
- Strong performing properties (Top 25%) earn $5,318 or more, indicating effective management and desirable locations/amenities.
- Typical properties (Median) generate around $3,103 per month, representing the average market performance.
- Entry-level properties (Bottom 25%) see earnings around $1,685, often with potential for optimization.
Average Monthly Airbnb Earnings Trend in North Litchfield Beach
North Litchfield Beach Airbnb Occupancy Rate Trends (2026)
Maximize your bookings by understanding the North Litchfield Beach STR occupancy trends. Seasonal demand shifts significantly influence how often properties are booked. Typically, Julysees the highest demand (peak season occupancy), while January experiences the lowest (low season). Effective strategies, like adjusting minimum stays or offering promotions, can boost occupancy during slower periods. Here's how different property tiers perform in North Litchfield Beach:
- Best-in-class properties (Top 10%) achieve 71%+ occupancy, indicating high desirability and potentially optimized availability.
- Strong performing properties (Top 25%) maintain 54% or higher occupancy, suggesting good market fit and guest satisfaction.
- Typical properties (Median) have an occupancy rate around 33%.
- Entry-level properties (Bottom 25%) average 17% occupancy, potentially facing higher vacancy.
Average Monthly Occupancy Rate Trend in North Litchfield Beach
Average Daily Rate (ADR) Airbnb Trends in North Litchfield Beach (2026)
Effective short term rental pricing strategy in North Litchfield Beach involves understanding monthly ADR fluctuations. The Average Daily Rate (ADR) for Airbnb in North Litchfield Beach typically peaks in January and dips lowest during February. Leveraging Airbnb dynamic pricing tools or strategies based on this seasonality can significantly boost revenue. Here's a look at the typical nightly rates achieved:
- Best-in-class properties (Top 10%) command rates of $702+ per night, often due to premium features or locations.
- Strong performing properties (Top 25%) achieve nightly rates of $457 or more.
- Typical properties (Median) charge around $345 per night.
- Entry-level properties (Bottom 25%) earn around $247 per night.
Average Daily Rate (ADR) Trend by Month in North Litchfield Beach
Get Live North Litchfield Beach Market Intelligence 👇

Explore Real-time Analytics
Airbnb Seasonality Analysis & Trends in North Litchfield Beach (2026)
Peak Season (July, June, August)
- Revenue averages $6,845 per month
- Occupancy rates average 54.3%
- Daily rates average $444
Shoulder Season
- Revenue averages $3,630 per month
- Occupancy maintains around 34.9%
- Daily rates hold near $407
Low Season (January, February, December)
- Revenue drops to average $2,082 per month
- Occupancy decreases to average 22.4%
- Daily rates adjust to average $418
Seasonality Insights for North Litchfield Beach
- The Airbnb seasonality in North Litchfield Beach shows highly seasonal trends requiring careful strategy. While the sections above show seasonal averages, it's also insightful to look at the extremes:
- During the high season, the absolute peak month showcases North Litchfield Beach's highest earning potential, with monthly revenues capable of climbing to $8,366, occupancy reaching a high of 64.0%, and ADRs peaking at $481.
- Conversely, the slowest single month of the year, typically falling within the low season, marks the market's lowest point. In this month, revenue might dip to $1,729, occupancy could drop to 16.0%, and ADRs may adjust down to $352.
- Understanding both the seasonal averages and these monthly peaks and troughs in revenue, occupancy, and ADR is crucial for maximizing your Airbnb profit potential in North Litchfield Beach.
Seasonal Strategies for Maximizing Profit
- Peak Season: Maximize revenue through premium pricing and potentially longer minimum stays. Ensure high availability.
- Low Season: Offer competitive pricing, special promotions (e.g., extended stay discounts), and flexible cancellation policies. Target off-season travelers like remote workers or budget-conscious guests.
- Shoulder Seasons: Implement dynamic pricing that balances peak and low rates. Target weekend travelers or specific events. Offer slightly more flexible terms than peak season.
- Regularly analyze your own performance against these North Litchfield Beach seasonality benchmarks and adjust your pricing and availability strategy accordingly.
Best Areas for Airbnb Investment in North Litchfield Beach (2026)
Exploring the top neighborhoods for short-term rentals in North Litchfield Beach? This section highlights key areas, outlining why they are attractive for hosts and guests, along with notable local attractions. Consider these locations based on your target guest profile and investment strategy.
| Neighborhood / Area | Why Host Here? (Target Guests & Appeal) | Key Attractions & Landmarks |
|---|---|---|
| North Litchfield Beach | A serene coastal area known for its beautiful beaches and family-friendly atmosphere. Ideal for vacationers looking for a peaceful retreat with easy access to the beach and local amenities. | North Litchfield Beach, Litchfield Beach, Huntington Beach State Park, Brookgreen Gardens, Murrells Inlet MarshWalk |
| Murrells Inlet | A picturesque fishing village famous for its seafood restaurants and laid-back vibe. Attracts visitors looking for great dining options and waterfront views. | Murrells Inlet MarshWalk, Belin Memorial United Methodist Church, TPC of Myrtle Beach, The Inlet”, Murrells Inlet, Fish’N Fun Charters |
| Litchfield Plantation | A historic plantation area that offers a unique South Carolina experience. Visitors enjoy the combination of history and the beauty of coastal landscapes. | Litchfield Plantation, Historic Litchfield Beach, Caledonia Golf & Fish Club, The River Club, Brookgreen Gardens |
| Pawleys Island | A charming coastal town known for its stunning beaches and relaxed atmosphere. Perfect for families and those seeking a quieter seaside getaway. | Pawleys Island Beach, Huntington Beach State Park, Waccamaw River, Pawleys Island Historic District, The Hammock Shops |
| Georgetown | Rich in history and well-known for its waterfront and historic buildings. Great location for guests interested in culture and local heritage. | Georgetown Historic District, The Rice Museum, Hampton Plantation State Historic Site, Georgetown Harborwalk, The Kaminski House Museum |
| Surfside Beach | Popular destination known for its family-friendly beaches and lively community. It offers a variety of activities for visitors of all ages. | Surfside Beach Pier, Wild Water & Wheels, Surfside Beach, MarshWalk, Family Kingdom Amusement Park |
| Myrtle Beach | Just a short drive away, Myrtle Beach is a bustling tourist hotspot with entertainment, shopping, and nightlife. Ideal for guests looking for a vibrant beach experience. | Myrtle Beach Boardwalk, SkyWheel Myrtle Beach, Ripley’s Aquarium, Broadway at the Beach, Myrtle Beach State Park |
| Garden City Beach | A laid-back beach community that is perfect for vacationers seeking a peaceful beach experience near the attractions of Myrtle Beach. | Garden City Beach, The Pier at Garden City, MarshWalk, Wild Water & Wheels, Fishing Charters |
Understanding Airbnb License Requirements & STR Laws in North Litchfield Beach (2026)
While North Litchfield Beach, South Carolina, United States currently shows low STR regulations, specific Airbnb license requirements might still exist or change. Always verify the latest short term rental regulations and Airbnb license requirements directly with local government authorities for North Litchfield Beach to ensure full compliance before hosting.
(Source: AirROI data, 2026, finding no licensed listings among those analyzed)
Top Performing Airbnb Properties in North Litchfield Beach (2026)
Benchmark your potential! Explore examples of top-performing Airbnb properties in North Litchfield Beachbased on Trailing Twelve Month (TTM) revenue. Analyze their characteristics, revenue, occupancy rate, and ADR to understand what drives success in this market.
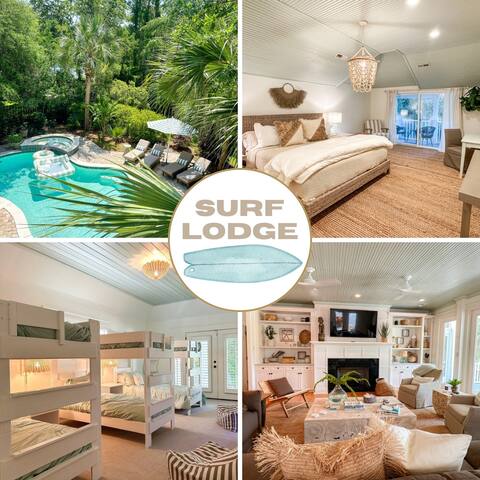
Surf Lodge - Pvt Pool, Walk to beach, 12beds
Entire Place • 7 bedrooms

Alive After Five Where Tranquility Meets the Ocean
Entire Place • 6 bedrooms
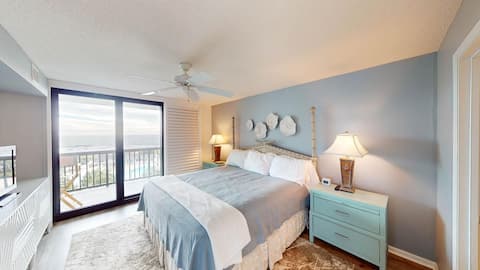
Luxurious 4BR 3BA Top Floor Oceanfront Condo
Entire Place • 4 bedrooms
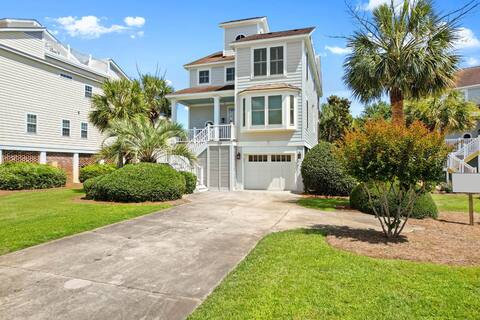
Ocean Breezes 4 Bedroom 4 Bath with Amenities
Entire Place • 3 bedrooms

Summer Breeze
Entire Place • 5 bedrooms
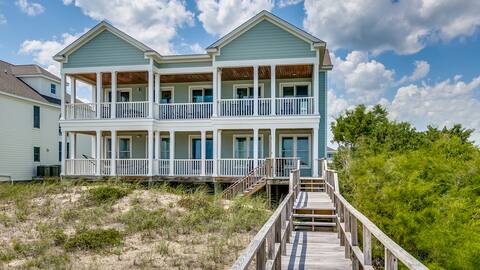
Oceanfront North Litchfield Peaceful and Pristine
Entire Place • 6 bedrooms
Note: Performance varies based on location, size, amenities, seasonality, and management quality. Data reflects the past 12 months.
Top Performing Airbnb Hosts in North Litchfield Beach (2026)
Learn from the best! This table showcases top-performing Airbnb hosts in North Litchfield Beach based on the number of properties managed and estimated total revenue over the past year. Analyze their scale and performance metrics.
| Host Name | Properties | Grossing Revenue | Stay Reviews | Avg Rating |
|---|---|---|---|---|
| Brittain Resorts | 57 | $1,369,689 | 215 | 4.44/5.0 |
| Suzanne | 11 | $383,240 | 25 | 4.53/5.0 |
| JoAnne | 14 | $367,875 | 373 | 4.85/5.0 |
| Litchfield Real | 14 | $299,509 | 61 | 4.54/5.0 |
| Sea Star Realty | 5 | $272,262 | 18 | 4.67/5.0 |
| Ian | 1 | $156,493 | 30 | 4.87/5.0 |
| Evolve | 3 | $109,086 | 82 | 4.74/5.0 |
| Peace | 1 | $78,103 | 9 | 5.00/5.0 |
| Richard | 1 | $76,060 | 19 | 5.00/5.0 |
| Michael | 1 | $73,856 | 46 | 5.00/5.0 |
Analyzing the strategies of top hosts, such as their property selection, pricing, and guest communication, can offer valuable lessons for optimizing your own Airbnb operations in North Litchfield Beach.
Dive Deeper: Advanced North Litchfield Beach STR Market Data (2026)
Ready to unlock more insights? AirROI provides access to advanced metrics and comprehensive Airbnb data for North Litchfield Beach. Explore detailed analytics beyond this report to refine your investment strategy, optimize pricing, and maximize your vacation rental profits.
Explore Advanced MetricsNorth Litchfield Beach Short-Term Rental Market Composition (2026): Property & Room Types
Room Type Distribution
Property Type Distribution
Market Composition Insights for North Litchfield Beach
- The North Litchfield Beach Airbnb market composition is heavily skewed towards Entire Home/Apt listings, which make up 98.6% of the 144 active rentals. This indicates strong guest preference for privacy and space.
- Looking at the property type distribution in North Litchfield Beach, Apartment/Condo properties are the most common (60.4%), reflecting the local real estate landscape.
- Houses represent a significant 38.9% portion, catering likely to families or larger groups.
- Smaller segments like hotel/boutique (combined 0.7%) offer potential for unique stay experiences.
North Litchfield Beach Airbnb Room Capacity Analysis (2026): Bedroom Distribution
Distribution of Listings by Number of Bedrooms
Room Capacity Insights for North Litchfield Beach
- The dominant room capacity in North Litchfield Beach is 3 bedrooms listings, making up 28.5% of the market. This suggests a strong demand for properties suitable for families or small groups.
- Together, 3 bedrooms and 1 bedroom properties represent 54.9% of the active Airbnb listings in North Litchfield Beach, indicating a high concentration in these sizes.
- A significant 48.6% of listings offer 3+ bedrooms, catering to larger groups and families seeking more space in North Litchfield Beach.
North Litchfield Beach Vacation Rental Guest Capacity Trends (2026)
Distribution of Listings by Guest Capacity
Guest Capacity Insights for North Litchfield Beach
- The most common guest capacity trend in North Litchfield Beach vacation rentals is listings accommodating 8+ guests (45.1%). This suggests the primary traveler segment is likely larger groups.
- Properties designed for 8+ guests and 6 guests dominate the North Litchfield Beach STR market, accounting for 81.9% of listings.
- 85.4% of properties accommodate 6+ guests, serving the market segment for larger families or group travel in North Litchfield Beach.
- On average, properties in North Litchfield Beach are equipped to host 6.6 guests.
North Litchfield Beach Airbnb Booking Patterns (2026): Available vs. Booked Days
Available Days Distribution
Booked Days Distribution
Booking Pattern Insights for North Litchfield Beach
- The most common availability pattern in North Litchfield Beach falls within the 271-366 days range, representing 61.1% of listings. This suggests many properties have significant open periods on their calendars.
- Approximately 89.6% of listings show high availability (181+ days open annually), indicating potential for increased bookings or specific owner usage patterns.
- For booked days, the 31-90 days range is most frequent in North Litchfield Beach (33.3%), reflecting common guest stay durations or potential owner blocking patterns.
- A notable 10.4% of properties secure long booking periods (181+ days booked per year), highlighting successful long-term rental strategies or significant owner usage.
North Litchfield Beach Airbnb Minimum Stay Requirements Analysis
Distribution of Listings by Minimum Night Requirement
1 Night
36 listings
25% of total
2 Nights
16 listings
11.1% of total
3 Nights
8 listings
5.6% of total
4-6 Nights
1 listings
0.7% of total
30+ Nights
83 listings
57.6% of total
Key Insights
- The most prevalent minimum stay requirement in North Litchfield Beach is 30+ Nights, adopted by 57.6% of listings. This highlights the market's preference for longer commitments.
- A significant segment (57.6%) caters to monthly stays (30+ nights) in North Litchfield Beach, pointing to opportunities in the extended-stay market.
Recommendations
- Align with the market by considering a 30+ Nights minimum stay, as 57.6% of North Litchfield Beach hosts use this setting.
- If feasible, allowing 1-night stays, especially midweek or during low season, could capture last-minute bookings, as only 25% currently do.
- Explore offering discounts for stays of 30+ nights to attract the 57.6% of the market seeking extended stays.
- Adjust minimum nights based on seasonality – potentially shorter during low season and longer during peak demand periods in North Litchfield Beach.
North Litchfield Beach Airbnb Cancellation Policy Trends Analysis (2026)
Super Strict 60 Days
8 listings
5.6% of total
Super Strict 30 Days
62 listings
43.1% of total
Flexible
6 listings
4.2% of total
Moderate
4 listings
2.8% of total
Firm
53 listings
36.8% of total
Strict
11 listings
7.6% of total
Cancellation Policy Insights for North Litchfield Beach
- The prevailing Airbnb cancellation policy trend in North Litchfield Beach is Super Strict 30 Days, used by 43.1% of listings.
- There's a relatively balanced mix between guest-friendly (7.0%) and stricter (44.4%) policies, offering choices for different guest needs.
- Strict cancellation policies are quite rare (7.6%), potentially making listings with this policy less competitive unless justified by high demand or property type.
Recommendations for Hosts
- Consider adopting a Super Strict 30 Days policy to align with the 43.1% market standard in North Litchfield Beach.
- Using a Strict policy might deter some guests, as only 7.6% of listings use it. Evaluate if potential revenue protection outweighs possible lower booking rates.
- Regularly review your cancellation policy against competitors and market demand shifts in North Litchfield Beach.
North Litchfield Beach STR Booking Lead Time Analysis (2026)
Average Booking Lead Time by Month
Booking Lead Time Insights for North Litchfield Beach
- The overall average booking lead time for vacation rentals in North Litchfield Beach is 87 days.
- Guests book furthest in advance for stays during June (average 103 days), likely coinciding with peak travel demand or local events.
- The shortest booking windows occur for stays in January (average 33 days), indicating more last-minute travel plans during this time.
- Seasonally, Summer (90 days avg.) sees the longest lead times, while Winter (48 days avg.) has the shortest, reflecting typical travel planning cycles.
Recommendations for Hosts
- Use the overall average lead time (87 days) as a baseline for your pricing and availability strategy in North Litchfield Beach.
- For June stays, consider implementing length-of-stay discounts or slightly higher rates for bookings made less than 103 days out to capitalize on advance planning.
- Target marketing efforts for the Summer season well in advance (at least 90 days) to capture early planners.
- Monitor your own booking lead times against these North Litchfield Beach averages to identify opportunities for dynamic pricing adjustments.
Popular & Essential Airbnb Amenities in North Litchfield Beach (2026)
Amenity Prevalence
Amenity Insights for North Litchfield Beach
- Essential amenities in North Litchfield Beach that guests expect include: TV, Air conditioning, Wifi, Free parking on premises, Smoke alarm, Heating, Kitchen, Refrigerator, Coffee maker, Microwave. Lacking these (any) could significantly impact bookings.
Recommendations for Hosts
- Ensure your listing includes all essential amenities for North Litchfield Beach: TV, Air conditioning, Wifi, Free parking on premises, Smoke alarm, Heating, Kitchen, Refrigerator, Coffee maker, Microwave.
- Prioritize adding missing essentials: Free parking on premises, Smoke alarm, Heating, Kitchen, Refrigerator, Coffee maker, Microwave.
- Highlight unique or less common amenities you offer (e.g., hot tub, dedicated workspace, EV charger) in your listing description and photos.
- Regularly check competitor amenities in North Litchfield Beach to stay competitive.
North Litchfield Beach Airbnb Guest Demographics & Profile Analysis (2026)
Guest Profile Summary for North Litchfield Beach
- The typical guest profile for Airbnb in North Litchfield Beach consists of primarily domestic travelers (97%), often arriving from nearby Charlotte, typically belonging to the Post-2000s (Gen Z/Alpha) group (50%), primarily speaking English or Spanish.
- Domestic travelers account for 97.4% of guests.
- Key international markets include United States (97.4%) and DC (0.8%).
- Top languages spoken are English (86.3%) followed by Spanish (6.9%).
- A significant demographic segment is the Post-2000s (Gen Z/Alpha) group, representing 50% of guests.
Recommendations for Hosts
- Target domestic marketing efforts towards travelers from Charlotte and Greenville.
- Tailor amenities and listing descriptions to appeal to the dominant Post-2000s (Gen Z/Alpha) demographic (e.g., highlight fast WiFi, smart home features, local guides).
- Highlight unique local experiences or amenities relevant to the primary guest profile.
- Consider seasonal promotions aligned with peak travel times for key origin markets.
Nearby Short-Term Rental Market Comparison
How does the North Litchfield Beach Airbnb market stack up against its neighbors? Compare key performance metrics like average monthly revenue, ADR, and occupancy rates in surrounding areas to understand the broader regional STR landscape.
| Market | Active Properties | Monthly Revenue | Daily Rate | Avg. Occupancy |
|---|---|---|---|---|
| Isle of Palms | 1,004 | $7,287 | $730.96 | 43% |
| Folly Beach | 904 | $7,160 | $572.70 | 47% |
| Sullivan's Island | 23 | $7,082 | $861.05 | 40% |
| Talahi Island | 41 | $6,064 | $358.56 | 51% |
| Charleston | 1,843 | $5,599 | $389.09 | 53% |
| Okatie | 11 | $5,231 | $510.60 | 41% |
| Ocean Isle Beach | 508 | $5,018 | $610.93 | 38% |
| Mount Pleasant | 448 | $4,561 | $303.21 | 54% |
| Kiawah Island | 624 | $4,526 | $615.10 | 34% |
| Tybee Island | 1,356 | $4,376 | $423.03 | 42% |