Myrtle Beach Airbnb Market Analysis 2026: Short Term Rental Data & Vacation Rental Statistics in South Carolina, United States
Is Airbnb profitable in Myrtle Beach in 2026? Explore comprehensive Airbnb analytics for Myrtle Beach, South Carolina, United States to uncover income potential. This 2026 STR market report for Myrtle Beach, based on AirROI data from February 2025 to January 2026, reveals key trends in the bustling market of 7,533 active listings.
Whether you're considering an Airbnb investment in Myrtle Beach, optimizing your existing vacation rental, or exploring rental arbitrage opportunities, understanding the Myrtle Beach Airbnb data is crucial. Leveraging the low regulation environment is key to maximizing your short term rental income potential. Let's dive into the specifics.
Key Myrtle Beach Airbnb Performance Metrics Overview
Monthly Airbnb Revenue Variations & Income Potential in Myrtle Beach (2026)
Understanding the monthly revenue variations for Airbnb listings in Myrtle Beach is key to maximizing your short term rental income potential. Seasonality significantly impacts earnings. Our analysis, based on data from the past 12 months, shows that the peak revenue month for STRs in Myrtle Beach is typically July, while January often presents the lowest earnings, highlighting opportunities for strategic pricing adjustments during shoulder and low seasons. Explore the typical Airbnb income in Myrtle Beach across different performance tiers:
- Best-in-class properties (Top 10%) achieve $6,203+ monthly, often utilizing dynamic pricing and superior guest experiences.
- Strong performing properties (Top 25%) earn $3,978 or more, indicating effective management and desirable locations/amenities.
- Typical properties (Median) generate around $2,371 per month, representing the average market performance.
- Entry-level properties (Bottom 25%) see earnings around $1,192, often with potential for optimization.
Average Monthly Airbnb Earnings Trend in Myrtle Beach
Myrtle Beach Airbnb Occupancy Rate Trends (2026)
Maximize your bookings by understanding the Myrtle Beach STR occupancy trends. Seasonal demand shifts significantly influence how often properties are booked. Typically, Julysees the highest demand (peak season occupancy), while January experiences the lowest (low season). Effective strategies, like adjusting minimum stays or offering promotions, can boost occupancy during slower periods. Here's how different property tiers perform in Myrtle Beach:
- Best-in-class properties (Top 10%) achieve 76%+ occupancy, indicating high desirability and potentially optimized availability.
- Strong performing properties (Top 25%) maintain 59% or higher occupancy, suggesting good market fit and guest satisfaction.
- Typical properties (Median) have an occupancy rate around 38%.
- Entry-level properties (Bottom 25%) average 19% occupancy, potentially facing higher vacancy.
Average Monthly Occupancy Rate Trend in Myrtle Beach
Average Daily Rate (ADR) Airbnb Trends in Myrtle Beach (2026)
Effective short term rental pricing strategy in Myrtle Beach involves understanding monthly ADR fluctuations. The Average Daily Rate (ADR) for Airbnb in Myrtle Beach typically peaks in July and dips lowest during February. Leveraging Airbnb dynamic pricing tools or strategies based on this seasonality can significantly boost revenue. Here's a look at the typical nightly rates achieved:
- Best-in-class properties (Top 10%) command rates of $380+ per night, often due to premium features or locations.
- Strong performing properties (Top 25%) achieve nightly rates of $268 or more.
- Typical properties (Median) charge around $195 per night.
- Entry-level properties (Bottom 25%) earn around $145 per night.
Average Daily Rate (ADR) Trend by Month in Myrtle Beach
Get Live Myrtle Beach Market Intelligence 👇

Explore Real-time Analytics
Airbnb Seasonality Analysis & Trends in Myrtle Beach (2026)
Peak Season (July, June, August)
- Revenue averages $5,354 per month
- Occupancy rates average 54.5%
- Daily rates average $281
Shoulder Season
- Revenue averages $2,545 per month
- Occupancy maintains around 39.3%
- Daily rates hold near $216
Low Season (January, February, December)
- Revenue drops to average $1,576 per month
- Occupancy decreases to average 28.2%
- Daily rates adjust to average $201
Seasonality Insights for Myrtle Beach
- The Airbnb seasonality in Myrtle Beach shows highly seasonal trends requiring careful strategy. While the sections above show seasonal averages, it's also insightful to look at the extremes:
- During the high season, the absolute peak month showcases Myrtle Beach's highest earning potential, with monthly revenues capable of climbing to $6,179, occupancy reaching a high of 58.9%, and ADRs peaking at $294.
- Conversely, the slowest single month of the year, typically falling within the low season, marks the market's lowest point. In this month, revenue might dip to $1,433, occupancy could drop to 21.4%, and ADRs may adjust down to $172.
- Understanding both the seasonal averages and these monthly peaks and troughs in revenue, occupancy, and ADR is crucial for maximizing your Airbnb profit potential in Myrtle Beach.
Seasonal Strategies for Maximizing Profit
- Peak Season: Maximize revenue through premium pricing and potentially longer minimum stays. Ensure high availability.
- Low Season: Offer competitive pricing, special promotions (e.g., extended stay discounts), and flexible cancellation policies. Target off-season travelers like remote workers or budget-conscious guests.
- Shoulder Seasons: Implement dynamic pricing that balances peak and low rates. Target weekend travelers or specific events. Offer slightly more flexible terms than peak season.
- Regularly analyze your own performance against these Myrtle Beach seasonality benchmarks and adjust your pricing and availability strategy accordingly.
Best Areas for Airbnb Investment in Myrtle Beach (2026)
Exploring the top neighborhoods for short-term rentals in Myrtle Beach? This section highlights key areas, outlining why they are attractive for hosts and guests, along with notable local attractions. Consider these locations based on your target guest profile and investment strategy.
| Neighborhood / Area | Why Host Here? (Target Guests & Appeal) | Key Attractions & Landmarks |
|---|---|---|
| Broadway at the Beach | A premier entertainment complex with shopping, dining, and attractions. Ideal for attracting families and tourists looking for a fun experience with various activities. | Ripley's Aquarium, WonderWorks, Hollywood Wax Museum, Broadway Grand Prix, The Pavilion Park |
| Myrtle Beach Boardwalk and Promenade | A lively area with beautiful ocean views, a bustling boardwalk, and numerous restaurants and shops. Perfect for tourists wanting to experience beach life. | SkyWheel, Myrtle Beach SkyWheel, Myrtle Beach Pier, Ripley's Believe It or Not!, The Gay Dolphin Gift Cove |
| North Myrtle Beach | A quieter alternative to Myrtle Beach, known for its beautiful beaches and family-friendly environment. Great for those looking for a more relaxed vacation. | Cherry Grove Beach, Ocean Drive Beach, North Myrtle Beach Park and Sports Complex, Barefoot Landing, Alabama Theatre |
| Surfside Beach | A charming, family-friendly town with beautiful beaches, making it appealing for families and couples seeking a tranquil getaway. | Surfside Beach Pier, Wild Water & Wheels, Surfside Beach, Huntington Beach State Park, Brookgreen Gardens |
| Murrells Inlet | Famous for its waterfront dining and proximity to natural sights. Attracts visitors who love seafood and the outdoors. | Murrells Inlet MarshWalk, Gardens State Park, Brookgreen Gardens, Huntington Beach State Park, The Inlet Sports Lodge |
| Pawleys Island | Known for its historic charm and beautiful beaches. Perfect for travelers looking for a peaceful retreat with a mix of local history and nature. | Pawleys Island Beach, Huntington Beach State Park, Gullah Heritage Trail, Brookgreen Gardens, Pawleys Island Historic District |
| West Myrtle Beach | Offers a mix of family-friendly attractions and local eateries, it attracts a diverse range of visitors looking for a more local experience. | Pirate's Voyage, Myrtle Beach State Park, Family Kingdom Amusement Park, Waccatee Zoo, Myrtle Beach Theater |
| Litchfield Beach | A serene and upscale area known for its luxury homes and quiet beaches, appealing to guests looking for an upscale experience away from the crowds. | Litchfield Beach, Litchfield Inn, Pawleys Island Nature Park, The Reserve Golf Club, Brookgreen Gardens |
Understanding Airbnb License Requirements & STR Laws in Myrtle Beach (2026)
While Myrtle Beach, South Carolina, United States currently shows low STR regulations, specific Airbnb license requirements might still exist or change. Always verify the latest short term rental regulations and Airbnb license requirements directly with local government authorities for Myrtle Beach to ensure full compliance before hosting.
(Source: AirROI data, 2026, based on 0% licensed listings)
Top Performing Airbnb Properties in Myrtle Beach (2026)
Benchmark your potential! Explore examples of top-performing Airbnb properties in Myrtle Beachbased on Trailing Twelve Month (TTM) revenue. Analyze their characteristics, revenue, occupancy rate, and ADR to understand what drives success in this market.
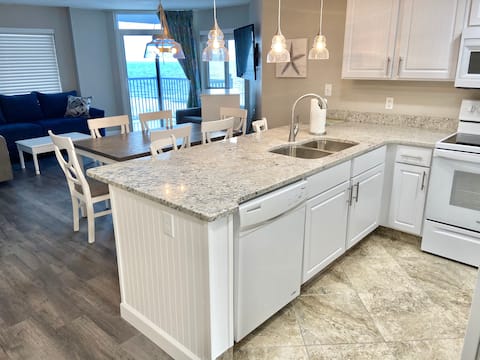
Seawatch 2BR Oceanfront Condo, Aug. 12-16 OPEN
Entire Place • 2 bedrooms
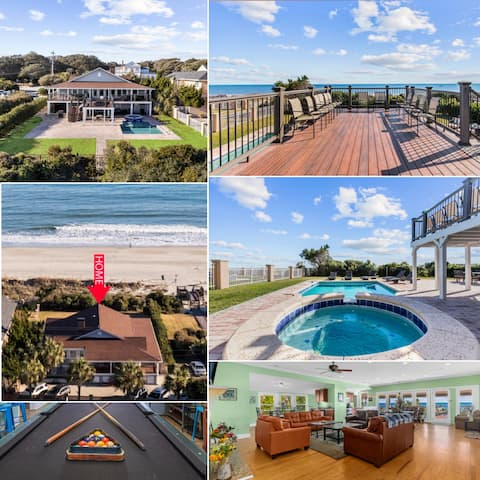
Posh on Ocean w Private Pool, Huge Yard, Game Room
Entire Place • 6 bedrooms
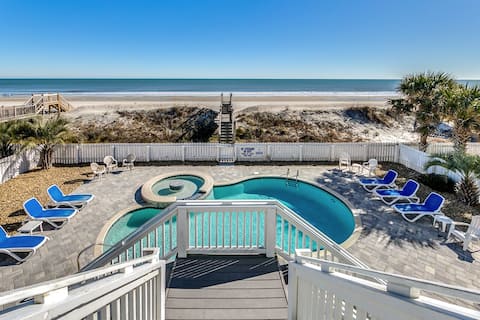
The Palms by Luxury Beach Rentals
Entire Place • 6 bedrooms

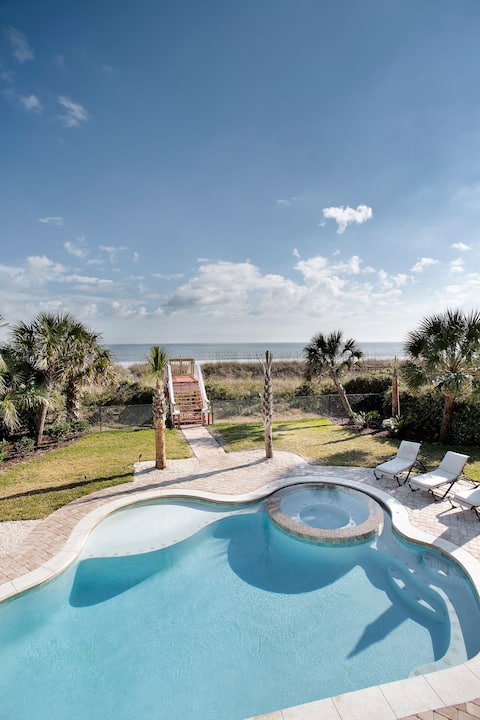
Southern C's Oceanfront Home in Myrtle Beach, SC
Entire Place • 6 bedrooms
Oceanfront luxury 6bd/6bath home
Entire Place • 6 bedrooms
Low Tide Too
Entire Place • 6 bedrooms
Note: Performance varies based on location, size, amenities, seasonality, and management quality. Data reflects the past 12 months.
Top Performing Airbnb Hosts in Myrtle Beach (2026)
Learn from the best! This table showcases top-performing Airbnb hosts in Myrtle Beach based on the number of properties managed and estimated total revenue over the past year. Analyze their scale and performance metrics.
| Host Name | Properties | Grossing Revenue | Stay Reviews | Avg Rating |
|---|---|---|---|---|
| Julie With Big Fish Rentals | 241 | $9,156,827 | 13661 | 4.53/5.0 |
| Luxury Beach Rentals | 160 | $8,860,426 | 1961 | 4.62/5.0 |
| Brittain Resorts | 339 | $5,812,770 | 715 | 4.69/5.0 |
| Evolve | 229 | $5,119,355 | 5892 | 4.58/5.0 |
| Premium | 121 | $4,130,907 | 4330 | 4.58/5.0 |
| Casago | 168 | $3,627,318 | 3579 | 4.28/5.0 |
| Steven With Myrtle Beach Desti | 97 | $3,268,268 | 1952 | 4.81/5.0 |
| Julie With Big Fish Rentals | 117 | $2,975,788 | 2669 | 4.40/5.0 |
| B2 Vacations | 120 | $2,884,434 | 2110 | 4.78/5.0 |
| Gosia | 89 | $2,661,156 | 8451 | 4.63/5.0 |
Analyzing the strategies of top hosts, such as their property selection, pricing, and guest communication, can offer valuable lessons for optimizing your own Airbnb operations in Myrtle Beach.
Dive Deeper: Advanced Myrtle Beach STR Market Data (2026)
Ready to unlock more insights? AirROI provides access to advanced metrics and comprehensive Airbnb data for Myrtle Beach. Explore detailed analytics beyond this report to refine your investment strategy, optimize pricing, and maximize your vacation rental profits.
Explore Advanced MetricsMyrtle Beach Short-Term Rental Market Composition (2026): Property & Room Types
Room Type Distribution
Property Type Distribution
Market Composition Insights for Myrtle Beach
- The Myrtle Beach Airbnb market composition is heavily skewed towards Entire Home/Apt listings, which make up 93.7% of the 7,533 active rentals. This indicates strong guest preference for privacy and space.
- Looking at the property type distribution in Myrtle Beach, Apartment/Condo properties are the most common (81.4%), reflecting the local real estate landscape.
- The presence of 5.9% Hotel/Boutique listings indicates integration with traditional hospitality.
- Smaller segments like others, outdoor/unique (combined 0.5%) offer potential for unique stay experiences.
Myrtle Beach Airbnb Room Capacity Analysis (2026): Bedroom Distribution
Distribution of Listings by Number of Bedrooms
Room Capacity Insights for Myrtle Beach
- The dominant room capacity in Myrtle Beach is 1 bedroom listings, making up 35.7% of the market. This suggests a strong demand for properties suitable for couples or solo travelers.
- Together, 1 bedroom and 2 bedrooms properties represent 67.7% of the active Airbnb listings in Myrtle Beach, indicating a high concentration in these sizes.
- A significant 21.3% of listings offer 3+ bedrooms, catering to larger groups and families seeking more space in Myrtle Beach.
Myrtle Beach Vacation Rental Guest Capacity Trends (2026)
Distribution of Listings by Guest Capacity
Guest Capacity Insights for Myrtle Beach
- The most common guest capacity trend in Myrtle Beach vacation rentals is listings accommodating 6 guests (32.9%). This suggests the primary traveler segment is likely larger groups.
- Properties designed for 6 guests and 4 guests dominate the Myrtle Beach STR market, accounting for 62.9% of listings.
- 60.3% of properties accommodate 6+ guests, serving the market segment for larger families or group travel in Myrtle Beach.
- On average, properties in Myrtle Beach are equipped to host 5.6 guests.
Myrtle Beach Airbnb Booking Patterns (2026): Available vs. Booked Days
Available Days Distribution
Booked Days Distribution
Booking Pattern Insights for Myrtle Beach
- The most common availability pattern in Myrtle Beach falls within the 271-366 days range, representing 51.5% of listings. This suggests many properties have significant open periods on their calendars.
- Approximately 84.5% of listings show high availability (181+ days open annually), indicating potential for increased bookings or specific owner usage patterns.
- For booked days, the 91-180 days range is most frequent in Myrtle Beach (34.4%), reflecting common guest stay durations or potential owner blocking patterns.
- A notable 16.4% of properties secure long booking periods (181+ days booked per year), highlighting successful long-term rental strategies or significant owner usage.
Myrtle Beach Airbnb Minimum Stay Requirements Analysis
Distribution of Listings by Minimum Night Requirement
1 Night
1299 listings
17.3% of total
2 Nights
1421 listings
18.9% of total
3 Nights
451 listings
6% of total
4-6 Nights
311 listings
4.1% of total
7-29 Nights
226 listings
3% of total
30+ Nights
3822 listings
50.8% of total
Key Insights
- The most prevalent minimum stay requirement in Myrtle Beach is 30+ Nights, adopted by 50.8% of listings. This highlights the market's preference for longer commitments.
- A significant segment (50.8%) caters to monthly stays (30+ nights) in Myrtle Beach, pointing to opportunities in the extended-stay market.
Recommendations
- Align with the market by considering a 30+ Nights minimum stay, as 50.8% of Myrtle Beach hosts use this setting.
- If feasible, allowing 1-night stays, especially midweek or during low season, could capture last-minute bookings, as only 17.3% currently do.
- Explore offering discounts for stays of 30+ nights to attract the 50.8% of the market seeking extended stays.
- Adjust minimum nights based on seasonality – potentially shorter during low season and longer during peak demand periods in Myrtle Beach.
Myrtle Beach Airbnb Cancellation Policy Trends Analysis (2026)
Refundable
1 listings
0% of total
Non-refundable
1 listings
0% of total
Super Strict 60 Days
331 listings
4.4% of total
Limited
89 listings
1.2% of total
Super Strict 30 Days
800 listings
10.6% of total
Flexible
716 listings
9.5% of total
Moderate
1403 listings
18.7% of total
Firm
3120 listings
41.5% of total
Strict
1054 listings
14% of total
Cancellation Policy Insights for Myrtle Beach
- The prevailing Airbnb cancellation policy trend in Myrtle Beach is Firm, used by 41.5% of listings.
- A majority (55.5%) of hosts in Myrtle Beach utilize Firm or Strict policies, indicating a market where hosts prioritize booking security.
Recommendations for Hosts
- Consider adopting a Firm policy to align with the 41.5% market standard in Myrtle Beach.
- Using a Strict policy might deter some guests, as only 14% of listings use it. Evaluate if potential revenue protection outweighs possible lower booking rates.
- Regularly review your cancellation policy against competitors and market demand shifts in Myrtle Beach.
Myrtle Beach STR Booking Lead Time Analysis (2026)
Average Booking Lead Time by Month
Booking Lead Time Insights for Myrtle Beach
- The overall average booking lead time for vacation rentals in Myrtle Beach is 45 days.
- Guests book furthest in advance for stays during June (average 55 days), likely coinciding with peak travel demand or local events.
- The shortest booking windows occur for stays in December (average 34 days), indicating more last-minute travel plans during this time.
- Seasonally, Summer (51 days avg.) sees the longest lead times, while Winter (36 days avg.) has the shortest, reflecting typical travel planning cycles.
Recommendations for Hosts
- Use the overall average lead time (45 days) as a baseline for your pricing and availability strategy in Myrtle Beach.
- Target marketing efforts for the Summer season well in advance (at least 51 days) to capture early planners.
- Monitor your own booking lead times against these Myrtle Beach averages to identify opportunities for dynamic pricing adjustments.
Popular & Essential Airbnb Amenities in Myrtle Beach (2026)
Amenity Prevalence
Amenity Insights for Myrtle Beach
- Essential amenities in Myrtle Beach that guests expect include: Air conditioning, TV, Wifi, Smoke alarm. Lacking these (any) could significantly impact bookings.
- Popular amenities like Coffee maker, Microwave, Kitchen are common but not universal. Offering these can provide a competitive edge.
Recommendations for Hosts
- Ensure your listing includes all essential amenities for Myrtle Beach: Air conditioning, TV, Wifi, Smoke alarm.
- Prioritize adding missing essentials: Air conditioning, TV, Wifi, Smoke alarm.
- Consider adding popular differentiators like Coffee maker or Microwave to increase appeal.
- Highlight unique or less common amenities you offer (e.g., hot tub, dedicated workspace, EV charger) in your listing description and photos.
- Regularly check competitor amenities in Myrtle Beach to stay competitive.
Myrtle Beach Airbnb Guest Demographics & Profile Analysis (2026)
Guest Profile Summary for Myrtle Beach
- The typical guest profile for Airbnb in Myrtle Beach consists of primarily domestic travelers (97%), often arriving from nearby Charlotte, typically belonging to the Post-2000s (Gen Z/Alpha) group (50%), primarily speaking English or Spanish.
- Domestic travelers account for 97.4% of guests.
- Key international markets include United States (97.4%) and Canada (1.2%).
- Top languages spoken are English (79.1%) followed by Spanish (12.3%).
- A significant demographic segment is the Post-2000s (Gen Z/Alpha) group, representing 50% of guests.
Recommendations for Hosts
- Target domestic marketing efforts towards travelers from Charlotte and Columbia.
- Tailor amenities and listing descriptions to appeal to the dominant Post-2000s (Gen Z/Alpha) demographic (e.g., highlight fast WiFi, smart home features, local guides).
- Highlight unique local experiences or amenities relevant to the primary guest profile.
- Consider seasonal promotions aligned with peak travel times for key origin markets.
Nearby Short-Term Rental Market Comparison
How does the Myrtle Beach Airbnb market stack up against its neighbors? Compare key performance metrics like average monthly revenue, ADR, and occupancy rates in surrounding areas to understand the broader regional STR landscape.
| Market | Active Properties | Monthly Revenue | Daily Rate | Avg. Occupancy |
|---|---|---|---|---|
| Isle of Palms | 1,004 | $7,287 | $730.96 | 43% |
| Folly Beach | 904 | $7,160 | $572.70 | 47% |
| Sullivan's Island | 23 | $7,082 | $861.05 | 40% |
| Charleston | 1,843 | $5,599 | $389.09 | 53% |
| Ocean Isle Beach | 508 | $5,018 | $610.93 | 38% |
| Wrightsville Beach | 497 | $4,620 | $531.11 | 39% |
| Mount Pleasant | 448 | $4,561 | $303.21 | 54% |
| Bald Head Island | 207 | $4,127 | $601.50 | 33% |
| Kure Beach | 502 | $3,804 | $427.64 | 42% |
| Cedar Point | 30 | $3,725 | $310.88 | 49% |