Isle of Palms Airbnb Market Analysis 2026: Short Term Rental Data & Vacation Rental Statistics in South Carolina, United States
Is Airbnb profitable in Isle of Palms in 2026? Explore comprehensive Airbnb analytics for Isle of Palms, South Carolina, United States to uncover income potential. This 2026 STR market report for Isle of Palms, based on AirROI data from February 2025 to January 2026, reveals key trends in the bustling market of 1,004 active listings.
Whether you're considering an Airbnb investment in Isle of Palms, optimizing your existing vacation rental, or exploring rental arbitrage opportunities, understanding the Isle of Palms Airbnb data is crucial. Leveraging the low regulation environment is key to maximizing your short term rental income potential. Let's dive into the specifics.
Key Isle of Palms Airbnb Performance Metrics Overview
Monthly Airbnb Revenue Variations & Income Potential in Isle of Palms (2026)
Understanding the monthly revenue variations for Airbnb listings in Isle of Palms is key to maximizing your short term rental income potential. Seasonality significantly impacts earnings. Our analysis, based on data from the past 12 months, shows that the peak revenue month for STRs in Isle of Palms is typically July, while January often presents the lowest earnings, highlighting opportunities for strategic pricing adjustments during shoulder and low seasons. Explore the typical Airbnb income in Isle of Palms across different performance tiers:
- Best-in-class properties (Top 10%) achieve $20,949+ monthly, often utilizing dynamic pricing and superior guest experiences.
- Strong performing properties (Top 25%) earn $12,880 or more, indicating effective management and desirable locations/amenities.
- Typical properties (Median) generate around $7,508 per month, representing the average market performance.
- Entry-level properties (Bottom 25%) see earnings around $4,053, often with potential for optimization.
Average Monthly Airbnb Earnings Trend in Isle of Palms
Isle of Palms Airbnb Occupancy Rate Trends (2026)
Maximize your bookings by understanding the Isle of Palms STR occupancy trends. Seasonal demand shifts significantly influence how often properties are booked. Typically, Julysees the highest demand (peak season occupancy), while January experiences the lowest (low season). Effective strategies, like adjusting minimum stays or offering promotions, can boost occupancy during slower periods. Here's how different property tiers perform in Isle of Palms:
- Best-in-class properties (Top 10%) achieve 77%+ occupancy, indicating high desirability and potentially optimized availability.
- Strong performing properties (Top 25%) maintain 63% or higher occupancy, suggesting good market fit and guest satisfaction.
- Typical properties (Median) have an occupancy rate around 45%.
- Entry-level properties (Bottom 25%) average 24% occupancy, potentially facing higher vacancy.
Average Monthly Occupancy Rate Trend in Isle of Palms
Average Daily Rate (ADR) Airbnb Trends in Isle of Palms (2026)
Effective short term rental pricing strategy in Isle of Palms involves understanding monthly ADR fluctuations. The Average Daily Rate (ADR) for Airbnb in Isle of Palms typically peaks in June and dips lowest during February. Leveraging Airbnb dynamic pricing tools or strategies based on this seasonality can significantly boost revenue. Here's a look at the typical nightly rates achieved:
- Best-in-class properties (Top 10%) command rates of $1,326+ per night, often due to premium features or locations.
- Strong performing properties (Top 25%) achieve nightly rates of $859 or more.
- Typical properties (Median) charge around $574 per night.
- Entry-level properties (Bottom 25%) earn around $402 per night.
Average Daily Rate (ADR) Trend by Month in Isle of Palms
Get Live Isle of Palms Market Intelligence 👇

Explore Real-time Analytics
Airbnb Seasonality Analysis & Trends in Isle of Palms (2026)
Peak Season (July, June, April)
- Revenue averages $14,997 per month
- Occupancy rates average 59.8%
- Daily rates average $832
Shoulder Season
- Revenue averages $9,857 per month
- Occupancy maintains around 45.4%
- Daily rates hold near $722
Low Season (January, February, December)
- Revenue drops to average $5,244 per month
- Occupancy decreases to average 27.4%
- Daily rates adjust to average $626
Seasonality Insights for Isle of Palms
- The Airbnb seasonality in Isle of Palms shows highly seasonal trends requiring careful strategy. While the sections above show seasonal averages, it's also insightful to look at the extremes:
- During the high season, the absolute peak month showcases Isle of Palms's highest earning potential, with monthly revenues capable of climbing to $16,452, occupancy reaching a high of 61.8%, and ADRs peaking at $879.
- Conversely, the slowest single month of the year, typically falling within the low season, marks the market's lowest point. In this month, revenue might dip to $4,201, occupancy could drop to 21.5%, and ADRs may adjust down to $596.
- Understanding both the seasonal averages and these monthly peaks and troughs in revenue, occupancy, and ADR is crucial for maximizing your Airbnb profit potential in Isle of Palms.
Seasonal Strategies for Maximizing Profit
- Peak Season: Maximize revenue through premium pricing and potentially longer minimum stays. Ensure high availability.
- Low Season: Offer competitive pricing, special promotions (e.g., extended stay discounts), and flexible cancellation policies. Target off-season travelers like remote workers or budget-conscious guests.
- Shoulder Seasons: Implement dynamic pricing that balances peak and low rates. Target weekend travelers or specific events. Offer slightly more flexible terms than peak season.
- Regularly analyze your own performance against these Isle of Palms seasonality benchmarks and adjust your pricing and availability strategy accordingly.
Best Areas for Airbnb Investment in Isle of Palms (2026)
Exploring the top neighborhoods for short-term rentals in Isle of Palms? This section highlights key areas, outlining why they are attractive for hosts and guests, along with notable local attractions. Consider these locations based on your target guest profile and investment strategy.
| Neighborhood / Area | Why Host Here? (Target Guests & Appeal) | Key Attractions & Landmarks |
|---|---|---|
| Wild Dunes | A prestigious resort community on Isle of Palms known for its beautiful beaches and golf courses. Wild Dunes is a great spot for tourists seeking luxury accommodations and resort-style living. | Wild Dunes Golf Club, Isle of Palms Beach, Sweetgrass Pavilion, Boardwalk to the Beach, Tennis Center at Wild Dunes |
| Isle of Palms Front Beach | The primary beachfront area of Isle of Palms, featuring popular restaurants, shops, and quick beach access. A lively spot that's always buzzing with activity, making it perfect for vacation rentals. | Front Beach, Palm Boulevard, Island House, Local restaurants and shops, Beach access points |
| Isle of Palms County Park | A family-friendly area with park facilities and amenities. This is ideal for families looking for a vacation spot with improved facilities and easy access to the beach. | County Park, Pavilion, Grilling areas, Children's play area, Restroom facilities |
| Palm Boulevard | A residential area close to the beach that offers a mix of charming homes and vacation rentals. It's popular among visitors looking for a quieter experience with close beach proximity. | Scenic coastal views, Quaint homes, Access to beach paths, Cycling routes, Local parks |
| Dewees Island | A private island offering serene beach experiences and a getaway from the bustling mainland. Ideal for unique vacation rental opportunities in a tranquil setting. | Dewees Island Beach, Nature trails, Wildlife observation, Kayaking opportunities, Secluded atmosphere |
| Sullivan's Island | Just a short drive from Isle of Palms, Sullivan's Island features beautiful beaches and a rich history. It's a desirable location for travelers looking for a mix of relaxation and exploration. | Sullivan's Island Beach, Fort Moultrie, Historic sites, Local restaurants, Quiet atmosphere |
| Charleston Harbor | While not directly on Isle of Palms, the nearby Charleston Harbor offers stunning views and proximity to historic Charleston, making it a draw for tourists looking for combination rentals. | Charleston Harbor views, Waterfront park, Access to Charleston tours, Historic downtown Charleston, Folly Beach nearby |
| Intracoastal Waterway | An appealing area for those interested in water activities like kayaking and boating. This location can attract adventurous tourists looking for a different experience. | Waterway access, Boat rentals, Fishing spots, Beautiful views, Wildlife watching |
Understanding Airbnb License Requirements & STR Laws in Isle of Palms (2026)
While Isle of Palms, South Carolina, United States currently shows low STR regulations, specific Airbnb license requirements might still exist or change. Always verify the latest short term rental regulations and Airbnb license requirements directly with local government authorities for Isle of Palms to ensure full compliance before hosting.
(Source: AirROI data, 2026, based on 0% licensed listings)
Top Performing Airbnb Properties in Isle of Palms (2026)
Benchmark your potential! Explore examples of top-performing Airbnb properties in Isle of Palmsbased on Trailing Twelve Month (TTM) revenue. Analyze their characteristics, revenue, occupancy rate, and ADR to understand what drives success in this market.
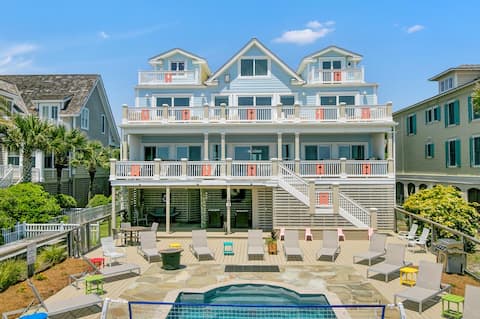
Can't Top This | Oceanfront | Sleeps 25 | Pool
Entire Place • 10 bedrooms
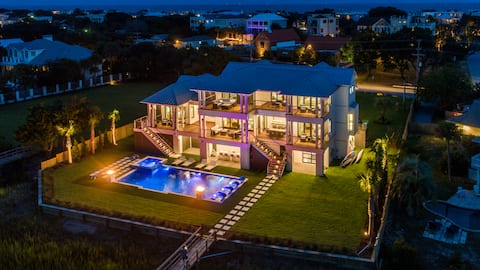
Waterfront Home with Deep Water Dock
Entire Place • 5 bedrooms
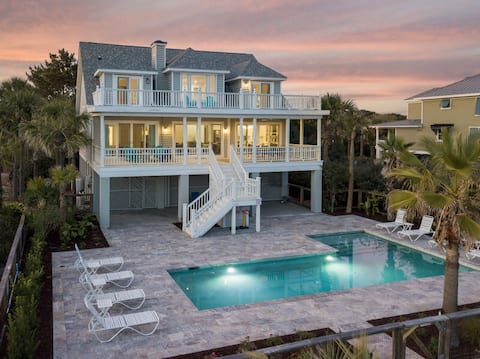
714 Ocean Blvd. Ocean Front, Private Pool
Entire Place • 5 bedrooms
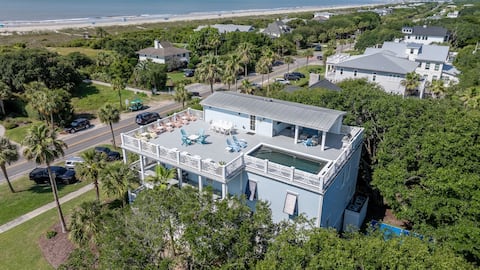
9BR Ocean View, Elevator, Rooftop Pool &Pickleball
Entire Place • 9 bedrooms
Pool, Elevator, Ocean Views, Steps from Ocean!
Entire Place • 5 bedrooms
Lux IOP Home, 7bd, pool, cabana, beach!
Entire Place • 7 bedrooms
Note: Performance varies based on location, size, amenities, seasonality, and management quality. Data reflects the past 12 months.
Top Performing Airbnb Hosts in Isle of Palms (2026)
Learn from the best! This table showcases top-performing Airbnb hosts in Isle of Palms based on the number of properties managed and estimated total revenue over the past year. Analyze their scale and performance metrics.
| Host Name | Properties | Grossing Revenue | Stay Reviews | Avg Rating |
|---|---|---|---|---|
| Sweetgrass | 74 | $8,429,438 | 1651 | 4.68/5.0 |
| Beachside By AvantStay | 103 | $7,955,170 | 586 | 4.85/5.0 |
| Amy | 51 | $7,035,549 | 602 | 4.91/5.0 |
| Wild Dunes | 128 | $6,096,994 | 521 | 4.67/5.0 |
| Michael | 39 | $5,832,443 | 576 | 4.96/5.0 |
| Deserving Vacations | 57 | $5,725,063 | 1828 | 4.88/5.0 |
| Megan | 24 | $5,153,510 | 70 | 4.96/5.0 |
| Carroll Realty Vacations | 84 | $4,311,065 | 1236 | 4.59/5.0 |
| ITrip Charleston Beaches | 42 | $3,586,910 | 515 | 4.86/5.0 |
| Charleston Coast | 33 | $2,476,435 | 99 | 4.84/5.0 |
Analyzing the strategies of top hosts, such as their property selection, pricing, and guest communication, can offer valuable lessons for optimizing your own Airbnb operations in Isle of Palms.
Dive Deeper: Advanced Isle of Palms STR Market Data (2026)
Ready to unlock more insights? AirROI provides access to advanced metrics and comprehensive Airbnb data for Isle of Palms. Explore detailed analytics beyond this report to refine your investment strategy, optimize pricing, and maximize your vacation rental profits.
Explore Advanced MetricsIsle of Palms Short-Term Rental Market Composition (2026): Property & Room Types
Room Type Distribution
Property Type Distribution
Market Composition Insights for Isle of Palms
- The Isle of Palms Airbnb market composition is heavily skewed towards Entire Home/Apt listings, which make up 99.9% of the 1,004 active rentals. This indicates strong guest preference for privacy and space.
- Looking at the property type distribution in Isle of Palms, House properties are the most common (64.8%), reflecting the local real estate landscape.
- Houses represent a significant 64.8% portion, catering likely to families or larger groups.
- Smaller segments like unique stays, others (combined 0.4%) offer potential for unique stay experiences.
Isle of Palms Airbnb Room Capacity Analysis (2026): Bedroom Distribution
Distribution of Listings by Number of Bedrooms
Room Capacity Insights for Isle of Palms
- The dominant room capacity in Isle of Palms is 3 bedrooms listings, making up 26.6% of the market. This suggests a strong demand for properties suitable for families or small groups.
- Together, 3 bedrooms and 5+ bedrooms properties represent 49.3% of the active Airbnb listings in Isle of Palms, indicating a high concentration in these sizes.
- A significant 68.2% of listings offer 3+ bedrooms, catering to larger groups and families seeking more space in Isle of Palms.
Isle of Palms Vacation Rental Guest Capacity Trends (2026)
Distribution of Listings by Guest Capacity
Guest Capacity Insights for Isle of Palms
- The most common guest capacity trend in Isle of Palms vacation rentals is listings accommodating 8+ guests (56.7%). This suggests the primary traveler segment is likely larger groups.
- Properties designed for 8+ guests and 6 guests dominate the Isle of Palms STR market, accounting for 79.7% of listings.
- 81.8% of properties accommodate 6+ guests, serving the market segment for larger families or group travel in Isle of Palms.
- On average, properties in Isle of Palms are equipped to host 6.8 guests.
Isle of Palms Airbnb Booking Patterns (2026): Available vs. Booked Days
Available Days Distribution
Booked Days Distribution
Booking Pattern Insights for Isle of Palms
- The most common availability pattern in Isle of Palms falls within the 271-366 days range, representing 40.7% of listings. This suggests many properties have significant open periods on their calendars.
- Approximately 77.3% of listings show high availability (181+ days open annually), indicating potential for increased bookings or specific owner usage patterns.
- For booked days, the 91-180 days range is most frequent in Isle of Palms (36.9%), reflecting common guest stay durations or potential owner blocking patterns.
- A notable 24.5% of properties secure long booking periods (181+ days booked per year), highlighting successful long-term rental strategies or significant owner usage.
Isle of Palms Airbnb Minimum Stay Requirements Analysis
Distribution of Listings by Minimum Night Requirement
1 Night
9 listings
0.9% of total
2 Nights
58 listings
5.8% of total
3 Nights
93 listings
9.3% of total
4-6 Nights
136 listings
13.5% of total
7-29 Nights
6 listings
0.6% of total
30+ Nights
702 listings
69.9% of total
Key Insights
- The most prevalent minimum stay requirement in Isle of Palms is 30+ Nights, adopted by 69.9% of listings. This highlights the market's preference for longer commitments.
- Very short stays (1-2 nights) are less common (6.7%), suggesting hosts prefer slightly longer bookings to optimize turnover.
- A significant segment (69.9%) caters to monthly stays (30+ nights) in Isle of Palms, pointing to opportunities in the extended-stay market.
Recommendations
- Align with the market by considering a 30+ Nights minimum stay, as 69.9% of Isle of Palms hosts use this setting.
- If feasible, allowing 1-night stays, especially midweek or during low season, could capture last-minute bookings, as only 0.9% currently do.
- Explore offering discounts for stays of 30+ nights to attract the 69.9% of the market seeking extended stays.
- Adjust minimum nights based on seasonality – potentially shorter during low season and longer during peak demand periods in Isle of Palms.
Isle of Palms Airbnb Cancellation Policy Trends Analysis (2026)
Limited
6 listings
0.6% of total
Super Strict 60 Days
206 listings
20.6% of total
Super Strict 30 Days
291 listings
29.1% of total
Flexible
9 listings
0.9% of total
Moderate
41 listings
4.1% of total
Firm
368 listings
36.8% of total
Strict
80 listings
8% of total
Cancellation Policy Insights for Isle of Palms
- The prevailing Airbnb cancellation policy trend in Isle of Palms is Firm, used by 36.8% of listings.
- There's a relatively balanced mix between guest-friendly (5.0%) and stricter (44.8%) policies, offering choices for different guest needs.
- Strict cancellation policies are quite rare (8%), potentially making listings with this policy less competitive unless justified by high demand or property type.
Recommendations for Hosts
- Consider adopting a Firm policy to align with the 36.8% market standard in Isle of Palms.
- Using a Strict policy might deter some guests, as only 8% of listings use it. Evaluate if potential revenue protection outweighs possible lower booking rates.
- Regularly review your cancellation policy against competitors and market demand shifts in Isle of Palms.
Isle of Palms STR Booking Lead Time Analysis (2026)
Average Booking Lead Time by Month
Booking Lead Time Insights for Isle of Palms
- The overall average booking lead time for vacation rentals in Isle of Palms is 86 days.
- Guests book furthest in advance for stays during May (average 107 days), likely coinciding with peak travel demand or local events.
- The shortest booking windows occur for stays in January (average 60 days), indicating more last-minute travel plans during this time.
- Seasonally, Spring (95 days avg.) sees the longest lead times, while Winter (65 days avg.) has the shortest, reflecting typical travel planning cycles.
Recommendations for Hosts
- Use the overall average lead time (86 days) as a baseline for your pricing and availability strategy in Isle of Palms.
- For May stays, consider implementing length-of-stay discounts or slightly higher rates for bookings made less than 107 days out to capitalize on advance planning.
- Target marketing efforts for the Spring season well in advance (at least 95 days) to capture early planners.
- Monitor your own booking lead times against these Isle of Palms averages to identify opportunities for dynamic pricing adjustments.
Popular & Essential Airbnb Amenities in Isle of Palms (2026)
Amenity Prevalence
Amenity Insights for Isle of Palms
- Essential amenities in Isle of Palms that guests expect include: Wifi, Air conditioning, TV, Coffee maker, Kitchen, Smoke alarm, Refrigerator, Dishwasher, Free parking on premises, Washer. Lacking these (any) could significantly impact bookings.
Recommendations for Hosts
- Ensure your listing includes all essential amenities for Isle of Palms: Wifi, Air conditioning, TV, Coffee maker, Kitchen, Smoke alarm, Refrigerator, Dishwasher, Free parking on premises, Washer.
- Prioritize adding missing essentials: Wifi, Air conditioning, TV, Coffee maker, Kitchen, Smoke alarm, Refrigerator, Dishwasher, Free parking on premises, Washer.
- Highlight unique or less common amenities you offer (e.g., hot tub, dedicated workspace, EV charger) in your listing description and photos.
- Regularly check competitor amenities in Isle of Palms to stay competitive.
Isle of Palms Airbnb Guest Demographics & Profile Analysis (2026)
Guest Profile Summary for Isle of Palms
- The typical guest profile for Airbnb in Isle of Palms consists of primarily domestic travelers (98%), often arriving from nearby Charlotte, typically belonging to the Post-2000s (Gen Z/Alpha) group (50%), primarily speaking English or Spanish.
- Domestic travelers account for 98.1% of guests.
- Key international markets include United States (98.1%) and DC (0.9%).
- Top languages spoken are English (85.1%) followed by Spanish (6.3%).
- A significant demographic segment is the Post-2000s (Gen Z/Alpha) group, representing 50% of guests.
Recommendations for Hosts
- Target domestic marketing efforts towards travelers from Charlotte and Greenville.
- Tailor amenities and listing descriptions to appeal to the dominant Post-2000s (Gen Z/Alpha) demographic (e.g., highlight fast WiFi, smart home features, local guides).
- Highlight unique local experiences or amenities relevant to the primary guest profile.
- Consider seasonal promotions aligned with peak travel times for key origin markets.
Nearby Short-Term Rental Market Comparison
How does the Isle of Palms Airbnb market stack up against its neighbors? Compare key performance metrics like average monthly revenue, ADR, and occupancy rates in surrounding areas to understand the broader regional STR landscape.
| Market | Active Properties | Monthly Revenue | Daily Rate | Avg. Occupancy |
|---|---|---|---|---|
| Folly Beach | 904 | $7,160 | $572.70 | 47% |
| Sullivan's Island | 23 | $7,082 | $861.05 | 40% |
| Talahi Island | 41 | $6,064 | $358.56 | 51% |
| Charleston | 1,843 | $5,599 | $389.09 | 53% |
| Okatie | 11 | $5,231 | $510.60 | 41% |
| Ocean Isle Beach | 508 | $5,018 | $610.93 | 38% |
| Mount Pleasant | 448 | $4,561 | $303.21 | 54% |
| Kiawah Island | 624 | $4,526 | $615.10 | 34% |
| Tybee Island | 1,356 | $4,376 | $423.03 | 42% |
| Wilmington Island | 113 | $3,954 | $322.99 | 46% |