Garden City Beach Airbnb Market Analysis 2026: Short Term Rental Data & Vacation Rental Statistics in South Carolina, United States
Is Airbnb profitable in Garden City Beach in 2026? Explore comprehensive Airbnb analytics for Garden City Beach, South Carolina, United States to uncover income potential. This 2026 STR market report for Garden City Beach, based on AirROI data from February 2025 to January 2026, reveals key trends in the market of 424 active listings.
Whether you're considering an Airbnb investment in Garden City Beach, optimizing your existing vacation rental, or exploring rental arbitrage opportunities, understanding the Garden City Beach Airbnb data is crucial. Leveraging the low regulation environment is key to maximizing your short term rental income potential. Let's dive into the specifics.
Key Garden City Beach Airbnb Performance Metrics Overview
Monthly Airbnb Revenue Variations & Income Potential in Garden City Beach (2026)
Understanding the monthly revenue variations for Airbnb listings in Garden City Beach is key to maximizing your short term rental income potential. Seasonality significantly impacts earnings. Our analysis, based on data from the past 12 months, shows that the peak revenue month for STRs in Garden City Beach is typically July, while January often presents the lowest earnings, highlighting opportunities for strategic pricing adjustments during shoulder and low seasons. Explore the typical Airbnb income in Garden City Beach across different performance tiers:
- Best-in-class properties (Top 10%) achieve $9,725+ monthly, often utilizing dynamic pricing and superior guest experiences.
- Strong performing properties (Top 25%) earn $5,484 or more, indicating effective management and desirable locations/amenities.
- Typical properties (Median) generate around $3,287 per month, representing the average market performance.
- Entry-level properties (Bottom 25%) see earnings around $1,826, often with potential for optimization.
Average Monthly Airbnb Earnings Trend in Garden City Beach
Garden City Beach Airbnb Occupancy Rate Trends (2026)
Maximize your bookings by understanding the Garden City Beach STR occupancy trends. Seasonal demand shifts significantly influence how often properties are booked. Typically, Julysees the highest demand (peak season occupancy), while January experiences the lowest (low season). Effective strategies, like adjusting minimum stays or offering promotions, can boost occupancy during slower periods. Here's how different property tiers perform in Garden City Beach:
- Best-in-class properties (Top 10%) achieve 78%+ occupancy, indicating high desirability and potentially optimized availability.
- Strong performing properties (Top 25%) maintain 61% or higher occupancy, suggesting good market fit and guest satisfaction.
- Typical properties (Median) have an occupancy rate around 41%.
- Entry-level properties (Bottom 25%) average 22% occupancy, potentially facing higher vacancy.
Average Monthly Occupancy Rate Trend in Garden City Beach
Average Daily Rate (ADR) Airbnb Trends in Garden City Beach (2026)
Effective short term rental pricing strategy in Garden City Beach involves understanding monthly ADR fluctuations. The Average Daily Rate (ADR) for Airbnb in Garden City Beach typically peaks in July and dips lowest during February. Leveraging Airbnb dynamic pricing tools or strategies based on this seasonality can significantly boost revenue. Here's a look at the typical nightly rates achieved:
- Best-in-class properties (Top 10%) command rates of $632+ per night, often due to premium features or locations.
- Strong performing properties (Top 25%) achieve nightly rates of $390 or more.
- Typical properties (Median) charge around $264 per night.
- Entry-level properties (Bottom 25%) earn around $191 per night.
Average Daily Rate (ADR) Trend by Month in Garden City Beach
Get Live Garden City Beach Market Intelligence 👇

Explore Real-time Analytics
Airbnb Seasonality Analysis & Trends in Garden City Beach (2026)
Peak Season (July, June, August)
- Revenue averages $7,523 per month
- Occupancy rates average 59.0%
- Daily rates average $399
Shoulder Season
- Revenue averages $4,052 per month
- Occupancy maintains around 41.8%
- Daily rates hold near $324
Low Season (January, February, December)
- Revenue drops to average $2,522 per month
- Occupancy decreases to average 28.4%
- Daily rates adjust to average $305
Seasonality Insights for Garden City Beach
- The Airbnb seasonality in Garden City Beach shows highly seasonal trends requiring careful strategy. While the sections above show seasonal averages, it's also insightful to look at the extremes:
- During the high season, the absolute peak month showcases Garden City Beach's highest earning potential, with monthly revenues capable of climbing to $8,798, occupancy reaching a high of 65.1%, and ADRs peaking at $411.
- Conversely, the slowest single month of the year, typically falling within the low season, marks the market's lowest point. In this month, revenue might dip to $2,372, occupancy could drop to 23.7%, and ADRs may adjust down to $265.
- Understanding both the seasonal averages and these monthly peaks and troughs in revenue, occupancy, and ADR is crucial for maximizing your Airbnb profit potential in Garden City Beach.
Seasonal Strategies for Maximizing Profit
- Peak Season: Maximize revenue through premium pricing and potentially longer minimum stays. Ensure high availability.
- Low Season: Offer competitive pricing, special promotions (e.g., extended stay discounts), and flexible cancellation policies. Target off-season travelers like remote workers or budget-conscious guests.
- Shoulder Seasons: Implement dynamic pricing that balances peak and low rates. Target weekend travelers or specific events. Offer slightly more flexible terms than peak season.
- Regularly analyze your own performance against these Garden City Beach seasonality benchmarks and adjust your pricing and availability strategy accordingly.
Best Areas for Airbnb Investment in Garden City Beach (2026)
Exploring the top neighborhoods for short-term rentals in Garden City Beach? This section highlights key areas, outlining why they are attractive for hosts and guests, along with notable local attractions. Consider these locations based on your target guest profile and investment strategy.
| Neighborhood / Area | Why Host Here? (Target Guests & Appeal) | Key Attractions & Landmarks |
|---|---|---|
| Garden City Beach | A picturesque beach town known for its family-friendly atmosphere and beautiful sandy shores. This area caters to vacationers looking for a relaxing beach getaway, with plenty of activities and dining options nearby. | Garden City Pier, Marlin Quay Marina, Huntington Beach State Park, Murrells Inlet Marsh Walk, Brookgreen Gardens, Garden City Beach State Park |
| Surfside Beach | A charming small beach town that offers a laid-back vibe and is close to the bustling Myrtle Beach area. Great for tourists seeking a quieter beach experience with easy access to attractions. | Surfside Beach Pier, Wild Water & Wheels, Hudson's Surfside Flea Market, Huntington Beach State Park, Water sports activities, Local seafood restaurants |
| Myrtle Beach | A major tourist destination with a wide variety of entertainment, dining, and shopping options. Attracts a diverse group of visitors year-round, making it a prime spot for vacation rentals. | Broadway at the Beach, Myrtle Beach Boardwalk, SkyWheel, Ripley's Aquarium, Myrtle Beach State Park, Golf courses and shows |
| Pawleys Island | Known for its historic charm and natural beauty, Pawleys Island offers a more serene environment. It's perfect for those seeking a more upscale, relaxing vacation experience. | Pawleys Island Beach, Huntington Beach State Park, Local art galleries, Plantation tours, Water sports activities, Nature trails |
| Litchfield Beach | A tranquil area with luxurious homes and beautiful beaches, ideal for those looking for a peaceful vacation destination. Popular with families and couples alike. | Litchfield Beach, Local golf courses, Nature reserves, Fishing options, Gourmet dining, Pawleys Island shopping |
| Murrells Inlet | Famous for its seafood and beautiful marsh views, Murrells Inlet is great for those who enjoy a laid-back lifestyle with access to local eateries and nature. | Murrells Inlet Marsh Walk, Local seafood restaurants, Fishing charters, Waterfront parks, Nature trails, Atalaya Castle |
| North Myrtle Beach | A family-friendly area with plenty of entertainment options. Offers a wide range of activities, making it a hot spot for tourism and vacation rentals. | Barefoot Landing, Ocean Drive Beach, Local shops and restaurants, Golf courses, Live music venues, Water sports |
| Georgetown | A historic town with charm, beautiful views of the waterfront, and a rich cultural heritage. It's great for guests interested in history as well as beach activities. | Georgetown Waterfront, Historic downtown shops, Plantation tours, Beaches, Fishing and boating, Local museums |
Understanding Airbnb License Requirements & STR Laws in Garden City Beach (2026)
While Garden City Beach, South Carolina, United States currently shows low STR regulations, specific Airbnb license requirements might still exist or change. Always verify the latest short term rental regulations and Airbnb license requirements directly with local government authorities for Garden City Beach to ensure full compliance before hosting.
(Source: AirROI data, 2026, finding no licensed listings among those analyzed)
Top Performing Airbnb Properties in Garden City Beach (2026)
Benchmark your potential! Explore examples of top-performing Airbnb properties in Garden City Beachbased on Trailing Twelve Month (TTM) revenue. Analyze their characteristics, revenue, occupancy rate, and ADR to understand what drives success in this market.
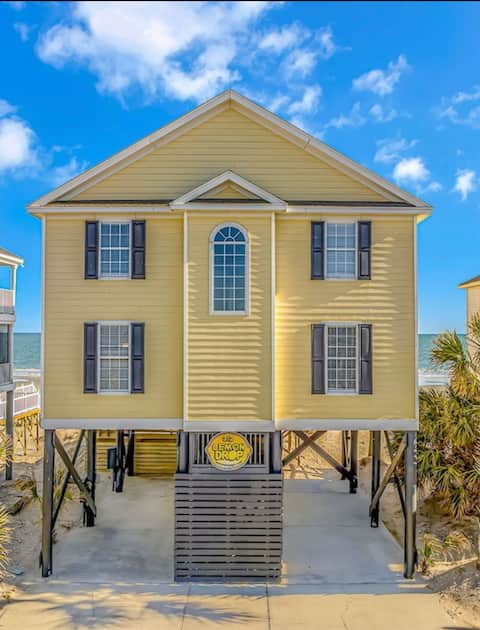
LemonDrop Oceanfront Garden City Beach SC
Entire Place • 6 bedrooms
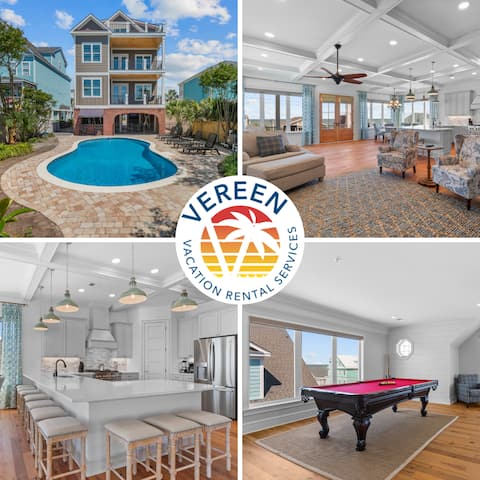
Luxury 8BD Home-Heated Pool+Elevator-Pet Friendly
Entire Place • 8 bedrooms
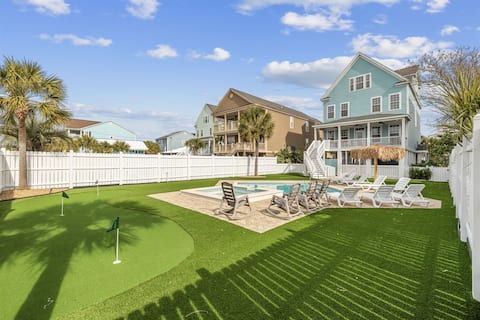
Sale! Free Heated Pool, 2nd Row, Golf, Sleeps 18,
Entire Place • 6 bedrooms
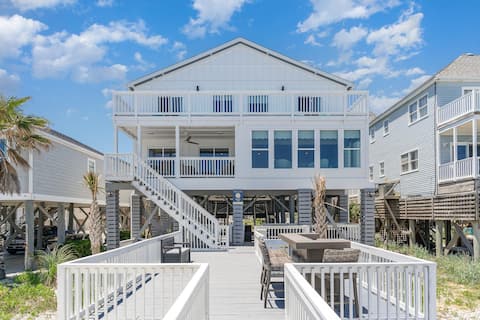
Ocean Whisper: Oceanfront, 10BR, Hot Tub, Newly Re
Entire Place • 10 bedrooms
Beachfront-Pet Friendly-Heated Pool Apr to Oct
Entire Place • 4 bedrooms
Blackbeard's Paradise, Beach House ON THE SAND!!
Entire Place • 5 bedrooms
Note: Performance varies based on location, size, amenities, seasonality, and management quality. Data reflects the past 12 months.
Top Performing Airbnb Hosts in Garden City Beach (2026)
Learn from the best! This table showcases top-performing Airbnb hosts in Garden City Beach based on the number of properties managed and estimated total revenue over the past year. Analyze their scale and performance metrics.
| Host Name | Properties | Grossing Revenue | Stay Reviews | Avg Rating |
|---|---|---|---|---|
| Evolve | 23 | $1,034,381 | 1050 | 4.73/5.0 |
| Karl | 6 | $730,488 | 218 | 4.99/5.0 |
| BASK Away. | 6 | $589,572 | 74 | 4.67/5.0 |
| Sea Star Realty | 19 | $514,061 | 60 | 4.57/5.0 |
| Lynn | 17 | $487,797 | 61 | 4.90/5.0 |
| Brock And Kim | 3 | $455,963 | 206 | 4.99/5.0 |
| ITrip | 19 | $436,353 | 235 | 4.49/5.0 |
| Stasy | 6 | $332,017 | 412 | 4.79/5.0 |
| Heather | 2 | $307,052 | 72 | 4.90/5.0 |
| RedAwning | 20 | $288,778 | 29 | 4.67/5.0 |
Analyzing the strategies of top hosts, such as their property selection, pricing, and guest communication, can offer valuable lessons for optimizing your own Airbnb operations in Garden City Beach.
Dive Deeper: Advanced Garden City Beach STR Market Data (2026)
Ready to unlock more insights? AirROI provides access to advanced metrics and comprehensive Airbnb data for Garden City Beach. Explore detailed analytics beyond this report to refine your investment strategy, optimize pricing, and maximize your vacation rental profits.
Explore Advanced MetricsGarden City Beach Short-Term Rental Market Composition (2026): Property & Room Types
Room Type Distribution
Property Type Distribution
Market Composition Insights for Garden City Beach
- The Garden City Beach Airbnb market composition is heavily skewed towards Entire Home/Apt listings, which make up 99.5% of the 424 active rentals. This indicates strong guest preference for privacy and space.
- Looking at the property type distribution in Garden City Beach, Apartment/Condo properties are the most common (66%), reflecting the local real estate landscape.
- Houses represent a significant 32.8% portion, catering likely to families or larger groups.
- Smaller segments like others, hotel/boutique (combined 1.2%) offer potential for unique stay experiences.
Garden City Beach Airbnb Room Capacity Analysis (2026): Bedroom Distribution
Distribution of Listings by Number of Bedrooms
Room Capacity Insights for Garden City Beach
- The dominant room capacity in Garden City Beach is 2 bedrooms listings, making up 32.5% of the market. This suggests a strong demand for properties suitable for couples or solo travelers.
- Together, 2 bedrooms and 3 bedrooms properties represent 56.3% of the active Airbnb listings in Garden City Beach, indicating a high concentration in these sizes.
- A significant 45.2% of listings offer 3+ bedrooms, catering to larger groups and families seeking more space in Garden City Beach.
Garden City Beach Vacation Rental Guest Capacity Trends (2026)
Distribution of Listings by Guest Capacity
Guest Capacity Insights for Garden City Beach
- The most common guest capacity trend in Garden City Beach vacation rentals is listings accommodating 8+ guests (38.9%). This suggests the primary traveler segment is likely larger groups.
- Properties designed for 8+ guests and 6 guests dominate the Garden City Beach STR market, accounting for 65.6% of listings.
- 70.1% of properties accommodate 6+ guests, serving the market segment for larger families or group travel in Garden City Beach.
- On average, properties in Garden City Beach are equipped to host 6.2 guests.
Garden City Beach Airbnb Booking Patterns (2026): Available vs. Booked Days
Available Days Distribution
Booked Days Distribution
Booking Pattern Insights for Garden City Beach
- The most common availability pattern in Garden City Beach falls within the 271-366 days range, representing 43.9% of listings. This suggests many properties have significant open periods on their calendars.
- Approximately 80.2% of listings show high availability (181+ days open annually), indicating potential for increased bookings or specific owner usage patterns.
- For booked days, the 91-180 days range is most frequent in Garden City Beach (36.6%), reflecting common guest stay durations or potential owner blocking patterns.
- A notable 21.2% of properties secure long booking periods (181+ days booked per year), highlighting successful long-term rental strategies or significant owner usage.
Garden City Beach Airbnb Minimum Stay Requirements Analysis
Distribution of Listings by Minimum Night Requirement
1 Night
29 listings
6.8% of total
2 Nights
51 listings
12% of total
3 Nights
84 listings
19.8% of total
4-6 Nights
31 listings
7.3% of total
7-29 Nights
16 listings
3.8% of total
30+ Nights
213 listings
50.2% of total
Key Insights
- The most prevalent minimum stay requirement in Garden City Beach is 30+ Nights, adopted by 50.2% of listings. This highlights the market's preference for longer commitments.
- Very short stays (1-2 nights) are less common (18.8%), suggesting hosts prefer slightly longer bookings to optimize turnover.
- A significant segment (50.2%) caters to monthly stays (30+ nights) in Garden City Beach, pointing to opportunities in the extended-stay market.
Recommendations
- Align with the market by considering a 30+ Nights minimum stay, as 50.2% of Garden City Beach hosts use this setting.
- If feasible, allowing 1-night stays, especially midweek or during low season, could capture last-minute bookings, as only 6.8% currently do.
- Explore offering discounts for stays of 30+ nights to attract the 50.2% of the market seeking extended stays.
- Adjust minimum nights based on seasonality – potentially shorter during low season and longer during peak demand periods in Garden City Beach.
Garden City Beach Airbnb Cancellation Policy Trends Analysis (2026)
Super Strict 30 Days
21 listings
5% of total
Super Strict 60 Days
47 listings
11.1% of total
Limited
6 listings
1.4% of total
Flexible
23 listings
5.4% of total
Moderate
36 listings
8.5% of total
Firm
217 listings
51.2% of total
Strict
74 listings
17.5% of total
Cancellation Policy Insights for Garden City Beach
- The prevailing Airbnb cancellation policy trend in Garden City Beach is Firm, used by 51.2% of listings.
- A majority (68.7%) of hosts in Garden City Beach utilize Firm or Strict policies, indicating a market where hosts prioritize booking security.
Recommendations for Hosts
- Consider adopting a Firm policy to align with the 51.2% market standard in Garden City Beach.
- Regularly review your cancellation policy against competitors and market demand shifts in Garden City Beach.
Garden City Beach STR Booking Lead Time Analysis (2026)
Average Booking Lead Time by Month
Booking Lead Time Insights for Garden City Beach
- The overall average booking lead time for vacation rentals in Garden City Beach is 70 days.
- Guests book furthest in advance for stays during June (average 87 days), likely coinciding with peak travel demand or local events.
- The shortest booking windows occur for stays in February (average 47 days), indicating more last-minute travel plans during this time.
- Seasonally, Summer (83 days avg.) sees the longest lead times, while Winter (51 days avg.) has the shortest, reflecting typical travel planning cycles.
Recommendations for Hosts
- Use the overall average lead time (70 days) as a baseline for your pricing and availability strategy in Garden City Beach.
- For June stays, consider implementing length-of-stay discounts or slightly higher rates for bookings made less than 87 days out to capitalize on advance planning.
- Target marketing efforts for the Summer season well in advance (at least 83 days) to capture early planners.
- Monitor your own booking lead times against these Garden City Beach averages to identify opportunities for dynamic pricing adjustments.
Popular & Essential Airbnb Amenities in Garden City Beach (2026)
Amenity Prevalence
Amenity Insights for Garden City Beach
- Essential amenities in Garden City Beach that guests expect include: Smoke alarm, Air conditioning, Wifi, Kitchen, Free parking on premises, TV, Heating, Coffee maker. Lacking these (any) could significantly impact bookings.
- Popular amenities like Microwave, Refrigerator are common but not universal. Offering these can provide a competitive edge.
Recommendations for Hosts
- Ensure your listing includes all essential amenities for Garden City Beach: Smoke alarm, Air conditioning, Wifi, Kitchen, Free parking on premises, TV, Heating, Coffee maker.
- Prioritize adding missing essentials: Smoke alarm, Air conditioning, Wifi, Kitchen, Free parking on premises, TV, Heating, Coffee maker.
- Consider adding popular differentiators like Microwave or Refrigerator to increase appeal.
- Highlight unique or less common amenities you offer (e.g., hot tub, dedicated workspace, EV charger) in your listing description and photos.
- Regularly check competitor amenities in Garden City Beach to stay competitive.
Garden City Beach Airbnb Guest Demographics & Profile Analysis (2026)
Guest Profile Summary for Garden City Beach
- The typical guest profile for Airbnb in Garden City Beach consists of primarily domestic travelers (99%), often arriving from nearby Charlotte, typically belonging to the Post-2000s (Gen Z/Alpha) group (50%), primarily speaking English or Spanish.
- Domestic travelers account for 98.5% of guests.
- Key international markets include United States (98.5%) and Canada (0.6%).
- Top languages spoken are English (85.6%) followed by Spanish (8.1%).
- A significant demographic segment is the Post-2000s (Gen Z/Alpha) group, representing 50% of guests.
Recommendations for Hosts
- Target domestic marketing efforts towards travelers from Charlotte and Columbia.
- Tailor amenities and listing descriptions to appeal to the dominant Post-2000s (Gen Z/Alpha) demographic (e.g., highlight fast WiFi, smart home features, local guides).
- Highlight unique local experiences or amenities relevant to the primary guest profile.
- Consider seasonal promotions aligned with peak travel times for key origin markets.
Nearby Short-Term Rental Market Comparison
How does the Garden City Beach Airbnb market stack up against its neighbors? Compare key performance metrics like average monthly revenue, ADR, and occupancy rates in surrounding areas to understand the broader regional STR landscape.
| Market | Active Properties | Monthly Revenue | Daily Rate | Avg. Occupancy |
|---|---|---|---|---|
| Isle of Palms | 1,004 | $7,287 | $730.96 | 43% |
| Folly Beach | 904 | $7,160 | $572.70 | 47% |
| Sullivan's Island | 23 | $7,082 | $861.05 | 40% |
| Charleston | 1,843 | $5,599 | $389.09 | 53% |
| Ocean Isle Beach | 508 | $5,018 | $610.93 | 38% |
| Wrightsville Beach | 497 | $4,620 | $531.11 | 39% |
| Mount Pleasant | 448 | $4,561 | $303.21 | 54% |
| Bald Head Island | 207 | $4,127 | $601.50 | 33% |
| Kure Beach | 502 | $3,804 | $427.64 | 42% |
| Cedar Point | 30 | $3,725 | $310.88 | 49% |