Columbia Airbnb Market Analysis 2026: Short Term Rental Data & Vacation Rental Statistics in South Carolina, United States
Is Airbnb profitable in Columbia in 2026? Explore comprehensive Airbnb analytics for Columbia, South Carolina, United States to uncover income potential. This 2026 STR market report for Columbia, based on AirROI data from February 2025 to January 2026, reveals key trends in the market of 815 active listings.
Whether you're considering an Airbnb investment in Columbia, optimizing your existing vacation rental, or exploring rental arbitrage opportunities, understanding the Columbia Airbnb data is crucial. Understanding the local regulations is key to maximizing your short term rental income potential. Let's dive into the specifics.
Key Columbia Airbnb Performance Metrics Overview
Monthly Airbnb Revenue Variations & Income Potential in Columbia (2026)
Understanding the monthly revenue variations for Airbnb listings in Columbia is key to maximizing your short term rental income potential. Seasonality significantly impacts earnings. Our analysis, based on data from the past 12 months, shows that the peak revenue month for STRs in Columbia is typically October, while January often presents the lowest earnings, highlighting opportunities for strategic pricing adjustments during shoulder and low seasons. Explore the typical Airbnb income in Columbia across different performance tiers:
- Best-in-class properties (Top 10%) achieve $5,107+ monthly, often utilizing dynamic pricing and superior guest experiences.
- Strong performing properties (Top 25%) earn $3,497 or more, indicating effective management and desirable locations/amenities.
- Typical properties (Median) generate around $2,223 per month, representing the average market performance.
- Entry-level properties (Bottom 25%) see earnings around $1,219, often with potential for optimization.
Average Monthly Airbnb Earnings Trend in Columbia
Columbia Airbnb Occupancy Rate Trends (2026)
Maximize your bookings by understanding the Columbia STR occupancy trends. Seasonal demand shifts significantly influence how often properties are booked. Typically, Februarysees the highest demand (peak season occupancy), while January experiences the lowest (low season). Effective strategies, like adjusting minimum stays or offering promotions, can boost occupancy during slower periods. Here's how different property tiers perform in Columbia:
- Best-in-class properties (Top 10%) achieve 81%+ occupancy, indicating high desirability and potentially optimized availability.
- Strong performing properties (Top 25%) maintain 68% or higher occupancy, suggesting good market fit and guest satisfaction.
- Typical properties (Median) have an occupancy rate around 49%.
- Entry-level properties (Bottom 25%) average 28% occupancy, potentially facing higher vacancy.
Average Monthly Occupancy Rate Trend in Columbia
Average Daily Rate (ADR) Airbnb Trends in Columbia (2026)
Effective short term rental pricing strategy in Columbia involves understanding monthly ADR fluctuations. The Average Daily Rate (ADR) for Airbnb in Columbia typically peaks in November and dips lowest during February. Leveraging Airbnb dynamic pricing tools or strategies based on this seasonality can significantly boost revenue. Here's a look at the typical nightly rates achieved:
- Best-in-class properties (Top 10%) command rates of $310+ per night, often due to premium features or locations.
- Strong performing properties (Top 25%) achieve nightly rates of $213 or more.
- Typical properties (Median) charge around $147 per night.
- Entry-level properties (Bottom 25%) earn around $103 per night.
Average Daily Rate (ADR) Trend by Month in Columbia
Get Live Columbia Market Intelligence 👇

Explore Real-time Analytics
Airbnb Seasonality Analysis & Trends in Columbia (2026)
Peak Season (October, November, August)
- Revenue averages $3,149 per month
- Occupancy rates average 50.2%
- Daily rates average $199
Shoulder Season
- Revenue averages $2,661 per month
- Occupancy maintains around 47.4%
- Daily rates hold near $182
Low Season (January, February, March)
- Revenue drops to average $2,193 per month
- Occupancy decreases to average 47.9%
- Daily rates adjust to average $165
Seasonality Insights for Columbia
- The Airbnb seasonality in Columbia shows moderate seasonality with distinct peak and low periods. While the sections above show seasonal averages, it's also insightful to look at the extremes:
- During the high season, the absolute peak month showcases Columbia's highest earning potential, with monthly revenues capable of climbing to $3,421, occupancy reaching a high of 54.7%, and ADRs peaking at $212.
- Conversely, the slowest single month of the year, typically falling within the low season, marks the market's lowest point. In this month, revenue might dip to $1,968, occupancy could drop to 36.0%, and ADRs may adjust down to $155.
- Understanding both the seasonal averages and these monthly peaks and troughs in revenue, occupancy, and ADR is crucial for maximizing your Airbnb profit potential in Columbia.
Seasonal Strategies for Maximizing Profit
- Peak Season: Maximize revenue through premium pricing and potentially longer minimum stays. Ensure high availability.
- Low Season: Offer competitive pricing, special promotions (e.g., extended stay discounts), and flexible cancellation policies. Target off-season travelers like remote workers or budget-conscious guests.
- Shoulder Seasons: Implement dynamic pricing that balances peak and low rates. Target weekend travelers or specific events. Offer slightly more flexible terms than peak season.
- Regularly analyze your own performance against these Columbia seasonality benchmarks and adjust your pricing and availability strategy accordingly.
Best Areas for Airbnb Investment in Columbia (2026)
Exploring the top neighborhoods for short-term rentals in Columbia? This section highlights key areas, outlining why they are attractive for hosts and guests, along with notable local attractions. Consider these locations based on your target guest profile and investment strategy.
| Neighborhood / Area | Why Host Here? (Target Guests & Appeal) | Key Attractions & Landmarks |
|---|---|---|
| Downtown Columbia | The heart of the city, filled with vibrant nightlife, dining, and cultural attractions. Ideal for travelers seeking urban experiences and convenience to local events. | South Carolina State House, Columbia Museum of Art, Main Street, The Vista District, EdVenture Children's Museum |
| Five Points | Historic neighborhood known for its eclectic mix of shops, restaurants, and nightlife. Popular among college students and young professionals, making it a prime area for short-term rentals. | Five Points Fountain, The Whig, The Top, Buffalo Wild Wings, Soda City Market |
| University of South Carolina | A bustling area filled with students and faculty, offering a steady stream of visitors and guests all year round. Close to educational and cultural landmarks. | Colonel Andrew Pickens House, Carolina Coliseum, Gambrell Hall, Russell House University Union, The Gardens at the University of South Carolina |
| Briarwood | A suburban area with family-friendly amenities. Attracts visitors for longer stays with the appeal of nearby parks and recreational activities. | Briarwood Park, Lake Hartwell, Columbia International University, local dining options, community events |
| Forest Acres | An affluent neighborhood known for its quiet streets and proximity to shopping and dining. Appeals to business travelers and families looking for a comfortable stay. | Forest Acres Shopping Center, Hirsch Memorial Park, Crickentree Country Club, local boutique stores, restaurants |
| Lexington | A suburban area just outside Columbia, known for its charming downtown and recreational options. Popular for travelers seeking a quieter atmosphere while being close to the city. | Lake Murray, Lexington County Museum, local shops and cafes, The Ice House Amphitheater, Lexington Town Hall |
| Irmo | A growing area with a family-friendly vibe and abundant outdoor activities. Great for travelers looking for a balance of urban and natural attractions. | Lake Murray Park, Irmo Community Park, Harbison State Forest, local entertainment options, restaurants |
| West Columbia | A city neighboring Columbia that offers a unique blend of culture and convenience. Features local eateries and shops, attracting both tourists and locals alike. | Saluda Riverwalk, West Columbia Riverwalk Park, local craft breweries, historic downtown, restaurants |
Understanding Airbnb License Requirements & STR Laws in Columbia (2026)
With 13% of listings showing registration in 2026, understanding potential Airbnb license requirements is crucial in Columbia. Always verify the latest short term rental regulations and Airbnb license requirements directly with local government authorities for Columbia to ensure full compliance before hosting.
(Source: AirROI data, 2026, based on 13% licensed listings)
Top Performing Airbnb Properties in Columbia (2026)
Benchmark your potential! Explore examples of top-performing Airbnb properties in Columbiabased on Trailing Twelve Month (TTM) revenue. Analyze their characteristics, revenue, occupancy rate, and ADR to understand what drives success in this market.

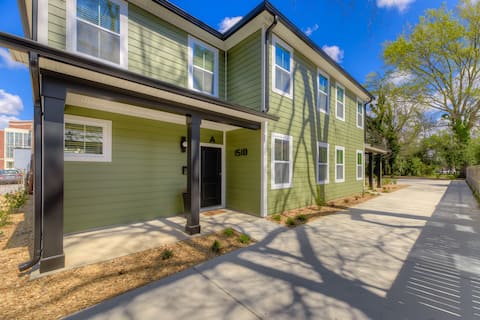
Charleston Home-Walk to 5pts/USC
Entire Place • 5 bedrooms
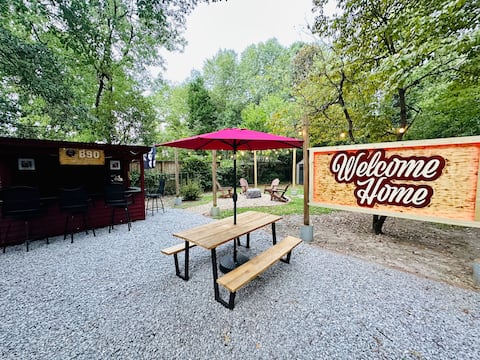
CB90 Club: Golf Cart, Mini Golf, Grills & Fire Pit
Entire Place • 6 bedrooms

Historic Luxury Apartment Main St Apt 201
Entire Place • 2 bedrooms

Historic Luxury 3 Bedroom -Main Street Apt 204
Entire Place • 3 bedrooms
Henderson Inn | 6 King Bedroom Suites + SmartTVs
Entire Place • 6 bedrooms

Downtown! Walk to USC/Downtown/Tennis
Entire Place • 4 bedrooms
Note: Performance varies based on location, size, amenities, seasonality, and management quality. Data reflects the past 12 months.
Top Performing Airbnb Hosts in Columbia (2026)
Learn from the best! This table showcases top-performing Airbnb hosts in Columbia based on the number of properties managed and estimated total revenue over the past year. Analyze their scale and performance metrics.
| Host Name | Properties | Grossing Revenue | Stay Reviews | Avg Rating |
|---|---|---|---|---|
| Wendy | 82 | $2,861,022 | 5490 | 4.75/5.0 |
| Wendy | 26 | $767,469 | 2040 | 4.70/5.0 |
| Vanessa | 12 | $750,958 | 1176 | 4.90/5.0 |
| Historic Stays Of Columbia To | 5 | $499,463 | 102 | 4.98/5.0 |
| Ben & Andres | 16 | $344,886 | 1259 | 4.72/5.0 |
| Gus | 9 | $339,702 | 562 | 4.85/5.0 |
| Jeff | 4 | $314,220 | 226 | 4.98/5.0 |
| Joseph | 10 | $266,413 | 895 | 4.66/5.0 |
| Joab | 12 | $231,996 | 4571 | 4.72/5.0 |
| Kim | 6 | $201,297 | 169 | 4.95/5.0 |
Analyzing the strategies of top hosts, such as their property selection, pricing, and guest communication, can offer valuable lessons for optimizing your own Airbnb operations in Columbia.
Dive Deeper: Advanced Columbia STR Market Data (2026)
Ready to unlock more insights? AirROI provides access to advanced metrics and comprehensive Airbnb data for Columbia. Explore detailed analytics beyond this report to refine your investment strategy, optimize pricing, and maximize your vacation rental profits.
Explore Advanced MetricsColumbia Short-Term Rental Market Composition (2026): Property & Room Types
Room Type Distribution
Property Type Distribution
Market Composition Insights for Columbia
- The Columbia Airbnb market composition is heavily skewed towards Entire Home/Apt listings, which make up 90.4% of the 815 active rentals. This indicates strong guest preference for privacy and space.
- Looking at the property type distribution in Columbia, House properties are the most common (65.2%), reflecting the local real estate landscape.
- Houses represent a significant 65.2% portion, catering likely to families or larger groups.
- Smaller segments like hotel/boutique, others, outdoor/unique (combined 8.1%) offer potential for unique stay experiences.
Columbia Airbnb Room Capacity Analysis (2026): Bedroom Distribution
Distribution of Listings by Number of Bedrooms
Room Capacity Insights for Columbia
- The dominant room capacity in Columbia is 2 bedrooms listings, making up 30.6% of the market. This suggests a strong demand for properties suitable for couples or solo travelers.
- Together, 2 bedrooms and 1 bedroom properties represent 55.1% of the active Airbnb listings in Columbia, indicating a high concentration in these sizes.
- A significant 35.4% of listings offer 3+ bedrooms, catering to larger groups and families seeking more space in Columbia.
Columbia Vacation Rental Guest Capacity Trends (2026)
Distribution of Listings by Guest Capacity
Guest Capacity Insights for Columbia
- The most common guest capacity trend in Columbia vacation rentals is listings accommodating 4 guests (24.5%). This suggests the primary traveler segment is likely small families or groups.
- Properties designed for 4 guests and 6 guests dominate the Columbia STR market, accounting for 43.6% of listings.
- 40.4% of properties accommodate 6+ guests, serving the market segment for larger families or group travel in Columbia.
- On average, properties in Columbia are equipped to host 4.5 guests.
Columbia Airbnb Booking Patterns (2026): Available vs. Booked Days
Available Days Distribution
Booked Days Distribution
Booking Pattern Insights for Columbia
- The most common availability pattern in Columbia falls within the 271-366 days range, representing 35.6% of listings. This suggests many properties have significant open periods on their calendars.
- Approximately 70.3% of listings show high availability (181+ days open annually), indicating potential for increased bookings or specific owner usage patterns.
- For booked days, the 91-180 days range is most frequent in Columbia (34.6%), reflecting common guest stay durations or potential owner blocking patterns.
- A notable 31.5% of properties secure long booking periods (181+ days booked per year), highlighting successful long-term rental strategies or significant owner usage.
Columbia Airbnb Minimum Stay Requirements Analysis
Distribution of Listings by Minimum Night Requirement
1 Night
231 listings
28.3% of total
2 Nights
237 listings
29.1% of total
3 Nights
26 listings
3.2% of total
4-6 Nights
22 listings
2.7% of total
7-29 Nights
49 listings
6% of total
30+ Nights
250 listings
30.7% of total
Key Insights
- The most prevalent minimum stay requirement in Columbia is 30+ Nights, adopted by 30.7% of listings. This highlights the market's preference for longer commitments.
- A significant segment (30.7%) caters to monthly stays (30+ nights) in Columbia, pointing to opportunities in the extended-stay market.
Recommendations
- Align with the market by considering a 30+ Nights minimum stay, as 30.7% of Columbia hosts use this setting.
- If feasible, allowing 1-night stays, especially midweek or during low season, could capture last-minute bookings, as only 28.3% currently do.
- Explore offering discounts for stays of 30+ nights to attract the 30.7% of the market seeking extended stays.
- Adjust minimum nights based on seasonality – potentially shorter during low season and longer during peak demand periods in Columbia.
Columbia Airbnb Cancellation Policy Trends Analysis (2026)
Super Strict 30 Days
11 listings
1.4% of total
Limited
6 listings
0.7% of total
Super Strict 60 Days
1 listings
0.1% of total
Flexible
210 listings
25.8% of total
Moderate
209 listings
25.7% of total
Firm
271 listings
33.3% of total
Strict
105 listings
12.9% of total
Cancellation Policy Insights for Columbia
- The prevailing Airbnb cancellation policy trend in Columbia is Firm, used by 33.3% of listings.
- There's a relatively balanced mix between guest-friendly (51.5%) and stricter (46.2%) policies, offering choices for different guest needs.
Recommendations for Hosts
- Consider adopting a Firm policy to align with the 33.3% market standard in Columbia.
- Using a Strict policy might deter some guests, as only 12.9% of listings use it. Evaluate if potential revenue protection outweighs possible lower booking rates.
- Regularly review your cancellation policy against competitors and market demand shifts in Columbia.
Columbia STR Booking Lead Time Analysis (2026)
Average Booking Lead Time by Month
Booking Lead Time Insights for Columbia
- The overall average booking lead time for vacation rentals in Columbia is 38 days.
- Guests book furthest in advance for stays during October (average 66 days), likely coinciding with peak travel demand or local events.
- The shortest booking windows occur for stays in February (average 19 days), indicating more last-minute travel plans during this time.
- Seasonally, Fall (60 days avg.) sees the longest lead times, while Winter (24 days avg.) has the shortest, reflecting typical travel planning cycles.
Recommendations for Hosts
- Use the overall average lead time (38 days) as a baseline for your pricing and availability strategy in Columbia.
- For October stays, consider implementing length-of-stay discounts or slightly higher rates for bookings made less than 66 days out to capitalize on advance planning.
- Target marketing efforts for the Fall season well in advance (at least 60 days) to capture early planners.
- Monitor your own booking lead times against these Columbia averages to identify opportunities for dynamic pricing adjustments.
Popular & Essential Airbnb Amenities in Columbia (2026)
Amenity Prevalence
Amenity Insights for Columbia
- Essential amenities in Columbia that guests expect include: Wifi, Air conditioning, Smoke alarm, TV, Free parking on premises. Lacking these (any) could significantly impact bookings.
- Popular amenities like Heating, Kitchen, Hot water are common but not universal. Offering these can provide a competitive edge.
Recommendations for Hosts
- Ensure your listing includes all essential amenities for Columbia: Wifi, Air conditioning, Smoke alarm, TV, Free parking on premises.
- Prioritize adding missing essentials: Wifi, Air conditioning, Smoke alarm, TV, Free parking on premises.
- Consider adding popular differentiators like Heating or Kitchen to increase appeal.
- Highlight unique or less common amenities you offer (e.g., hot tub, dedicated workspace, EV charger) in your listing description and photos.
- Regularly check competitor amenities in Columbia to stay competitive.
Columbia Airbnb Guest Demographics & Profile Analysis (2026)
Guest Profile Summary for Columbia
- The typical guest profile for Airbnb in Columbia consists of primarily domestic travelers (97%), often arriving from nearby Columbia, typically belonging to the Post-2000s (Gen Z/Alpha) group (50%), primarily speaking English or Spanish.
- Domestic travelers account for 97.0% of guests.
- Key international markets include United States (97%) and DC (0.7%).
- Top languages spoken are English (78.5%) followed by Spanish (11.2%).
- A significant demographic segment is the Post-2000s (Gen Z/Alpha) group, representing 50% of guests.
Recommendations for Hosts
- Target domestic marketing efforts towards travelers from Columbia and Charleston.
- Tailor amenities and listing descriptions to appeal to the dominant Post-2000s (Gen Z/Alpha) demographic (e.g., highlight fast WiFi, smart home features, local guides).
- Highlight unique local experiences or amenities relevant to the primary guest profile.
- Consider seasonal promotions aligned with peak travel times for key origin markets.
Nearby Short-Term Rental Market Comparison
How does the Columbia Airbnb market stack up against its neighbors? Compare key performance metrics like average monthly revenue, ADR, and occupancy rates in surrounding areas to understand the broader regional STR landscape.
| Market | Active Properties | Monthly Revenue | Daily Rate | Avg. Occupancy |
|---|---|---|---|---|
| Denver | 109 | $6,309 | $590.96 | 45% |
| Catawba | 16 | $6,093 | $582.49 | 38% |
| Mooresville | 369 | $5,702 | $559.93 | 42% |
| Sherrills Ford | 107 | $5,615 | $547.26 | 41% |
| Troutman | 49 | $5,587 | $467.90 | 42% |
| Lake Norman of Catawba | 51 | $4,972 | $513.30 | 43% |
| Union Mills | 15 | $4,938 | $442.76 | 41% |
| Six Mile | 57 | $4,396 | $449.78 | 42% |
| West Union | 30 | $4,126 | $564.92 | 32% |
| Appling | 21 | $4,080 | $617.34 | 35% |