Beaufort Airbnb Market Analysis 2026: Short Term Rental Data & Vacation Rental Statistics in South Carolina, United States
Is Airbnb profitable in Beaufort in 2026? Explore comprehensive Airbnb analytics for Beaufort, South Carolina, United States to uncover income potential. This 2026 STR market report for Beaufort, based on AirROI data from February 2025 to January 2026, reveals key trends in the market of 333 active listings.
Whether you're considering an Airbnb investment in Beaufort, optimizing your existing vacation rental, or exploring rental arbitrage opportunities, understanding the Beaufort Airbnb data is crucial. Leveraging the low regulation environment is key to maximizing your short term rental income potential. Let's dive into the specifics.
Key Beaufort Airbnb Performance Metrics Overview
Monthly Airbnb Revenue Variations & Income Potential in Beaufort (2026)
Understanding the monthly revenue variations for Airbnb listings in Beaufort is key to maximizing your short term rental income potential. Seasonality significantly impacts earnings. Our analysis, based on data from the past 12 months, shows that the peak revenue month for STRs in Beaufort is typically June, while January often presents the lowest earnings, highlighting opportunities for strategic pricing adjustments during shoulder and low seasons. Explore the typical Airbnb income in Beaufort across different performance tiers:
- Best-in-class properties (Top 10%) achieve $5,997+ monthly, often utilizing dynamic pricing and superior guest experiences.
- Strong performing properties (Top 25%) earn $4,298 or more, indicating effective management and desirable locations/amenities.
- Typical properties (Median) generate around $2,919 per month, representing the average market performance.
- Entry-level properties (Bottom 25%) see earnings around $1,733, often with potential for optimization.
Average Monthly Airbnb Earnings Trend in Beaufort
Beaufort Airbnb Occupancy Rate Trends (2026)
Maximize your bookings by understanding the Beaufort STR occupancy trends. Seasonal demand shifts significantly influence how often properties are booked. Typically, Aprilsees the highest demand (peak season occupancy), while January experiences the lowest (low season). Effective strategies, like adjusting minimum stays or offering promotions, can boost occupancy during slower periods. Here's how different property tiers perform in Beaufort:
- Best-in-class properties (Top 10%) achieve 78%+ occupancy, indicating high desirability and potentially optimized availability.
- Strong performing properties (Top 25%) maintain 65% or higher occupancy, suggesting good market fit and guest satisfaction.
- Typical properties (Median) have an occupancy rate around 48%.
- Entry-level properties (Bottom 25%) average 29% occupancy, potentially facing higher vacancy.
Average Monthly Occupancy Rate Trend in Beaufort
Average Daily Rate (ADR) Airbnb Trends in Beaufort (2026)
Effective short term rental pricing strategy in Beaufort involves understanding monthly ADR fluctuations. The Average Daily Rate (ADR) for Airbnb in Beaufort typically peaks in November and dips lowest during February. Leveraging Airbnb dynamic pricing tools or strategies based on this seasonality can significantly boost revenue. Here's a look at the typical nightly rates achieved:
- Best-in-class properties (Top 10%) command rates of $334+ per night, often due to premium features or locations.
- Strong performing properties (Top 25%) achieve nightly rates of $252 or more.
- Typical properties (Median) charge around $197 per night.
- Entry-level properties (Bottom 25%) earn around $149 per night.
Average Daily Rate (ADR) Trend by Month in Beaufort
Get Live Beaufort Market Intelligence 👇

Explore Real-time Analytics
Airbnb Seasonality Analysis & Trends in Beaufort (2026)
Peak Season (June, October, July)
- Revenue averages $3,771 per month
- Occupancy rates average 52.6%
- Daily rates average $229
Shoulder Season
- Revenue averages $3,304 per month
- Occupancy maintains around 49.7%
- Daily rates hold near $212
Low Season (January, September, December)
- Revenue drops to average $2,683 per month
- Occupancy decreases to average 37.4%
- Daily rates adjust to average $232
Seasonality Insights for Beaufort
- The Airbnb seasonality in Beaufort shows moderate seasonality with distinct peak and low periods. While the sections above show seasonal averages, it's also insightful to look at the extremes:
- During the high season, the absolute peak month showcases Beaufort's highest earning potential, with monthly revenues capable of climbing to $3,802, occupancy reaching a high of 57.1%, and ADRs peaking at $238.
- Conversely, the slowest single month of the year, typically falling within the low season, marks the market's lowest point. In this month, revenue might dip to $2,420, occupancy could drop to 33.5%, and ADRs may adjust down to $196.
- Understanding both the seasonal averages and these monthly peaks and troughs in revenue, occupancy, and ADR is crucial for maximizing your Airbnb profit potential in Beaufort.
Seasonal Strategies for Maximizing Profit
- Peak Season: Maximize revenue through premium pricing and potentially longer minimum stays. Ensure high availability.
- Low Season: Offer competitive pricing, special promotions (e.g., extended stay discounts), and flexible cancellation policies. Target off-season travelers like remote workers or budget-conscious guests.
- Shoulder Seasons: Implement dynamic pricing that balances peak and low rates. Target weekend travelers or specific events. Offer slightly more flexible terms than peak season.
- Regularly analyze your own performance against these Beaufort seasonality benchmarks and adjust your pricing and availability strategy accordingly.
Best Areas for Airbnb Investment in Beaufort (2026)
Exploring the top neighborhoods for short-term rentals in Beaufort? This section highlights key areas, outlining why they are attractive for hosts and guests, along with notable local attractions. Consider these locations based on your target guest profile and investment strategy.
| Neighborhood / Area | Why Host Here? (Target Guests & Appeal) | Key Attractions & Landmarks |
|---|---|---|
| Historic District | Charming area known for its antebellum architecture and rich history. Visitors are attracted to its walkable streets, historic homes, and nearby attractions. | Beaufort National Historic Landmark District, South Carolina Maritime Museum, John Mark Verdier House, Henry C. Chambers Waterfront Park, The Study of Beaufort History |
| Lady's Island | A peaceful residential area with beautiful waterfront views and close proximity to the city. Ideal for families and those seeking a quiet getaway while still being near downtown activities. | Beaufort River, Lady's Island Marina, The Sands Beach, The Beaufort Arts Council, Community parks |
| Downtown Beaufort | The heart of Beaufort with shops, restaurants, and cultural experiences. Perfect for travelers who want to be near dining and entertainment options. | Bay Street, Beaufort Historic District, Rhett Gallery, Saltus River Grill, Beaufort County Farmers Market |
| Port Royal | A small coastal town with a charming community and proximity to beaches. Attractive for those looking for a beach getaway. | Port Royal Sound, Sands Beach, The Cypress Wetlands, Looking Glass Marina, Port Royal Farmers Market |
| Pritchard's Island | A secluded and tranquil island perfect for nature lovers and those seeking a private retreat away from the hustle and bustle. | Private beaches, Wildlife watching, Kayaking opportunities, Nature trails, Scenic views |
| Fripp Island | A popular resort destination with beautiful beaches and golf courses. Excellent for vacation rentals due to its family-friendly atmosphere. | Fripp Island Beach, Ocean Creek Golf Club, Fripp Island Wildlife Refuge, The Frippery, Dining at The Beach Club |
| St. Helena Island | Rich in Gullah culture and history, St. Helena Island offers a unique experience for those interested in cultural tourism and nature. | Penn Center, Hunting Island State Park, Gullah Museum, Sea Island Cotton Plantation, Local seafood restaurants |
| Sea Islands | A collection of islands known for their pristine beaches and natural beauty. Ideal for travelers seeking relaxation and outdoor activities. | Hunting Island State Park, Cove Beach, Kayaking and paddleboarding, Birdwatching, Historical sites |
Understanding Airbnb License Requirements & STR Laws in Beaufort (2026)
While Beaufort, South Carolina, United States currently shows low STR regulations, specific Airbnb license requirements might still exist or change. Always verify the latest short term rental regulations and Airbnb license requirements directly with local government authorities for Beaufort to ensure full compliance before hosting.
(Source: AirROI data, 2026, finding no licensed listings among those analyzed)
Top Performing Airbnb Properties in Beaufort (2026)
Benchmark your potential! Explore examples of top-performing Airbnb properties in Beaufortbased on Trailing Twelve Month (TTM) revenue. Analyze their characteristics, revenue, occupancy rate, and ADR to understand what drives success in this market.
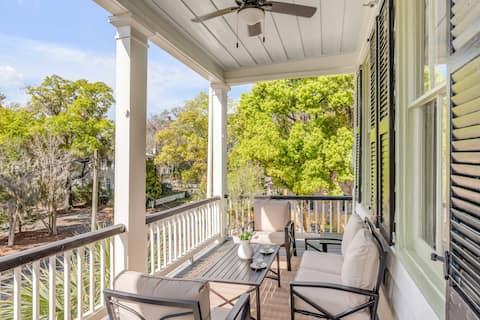
Circa 1785- Whole Hotel!
Entire Place • 5 bedrooms
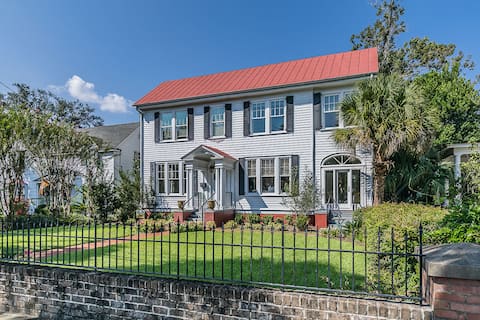
Home Overlooking the Beaufort River on Bay St
Entire Place • 4 bedrooms

5BR|3BA near Parris Island - Game Room, Fire Pit
Entire Place • 5 bedrooms
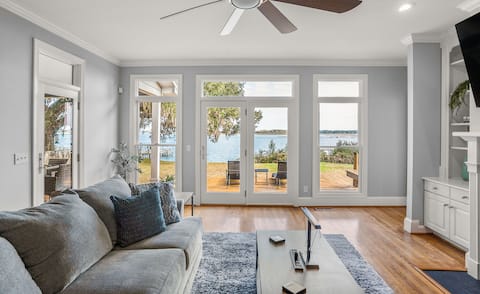
Coastal Getaway - Stunning Water Views!
Entire Place • 5 bedrooms

The '56 Retreat
Entire Place • 3 bedrooms

Tabby House, Parris Island, Reunions & Beaches
Entire Place • 6 bedrooms
Note: Performance varies based on location, size, amenities, seasonality, and management quality. Data reflects the past 12 months.
Top Performing Airbnb Hosts in Beaufort (2026)
Learn from the best! This table showcases top-performing Airbnb hosts in Beaufort based on the number of properties managed and estimated total revenue over the past year. Analyze their scale and performance metrics.
| Host Name | Properties | Grossing Revenue | Stay Reviews | Avg Rating |
|---|---|---|---|---|
| Tidewatch Vacations | 35 | $1,143,179 | 939 | 4.80/5.0 |
| Labi | 16 | $434,693 | 598 | 4.81/5.0 |
| Eli | 9 | $408,063 | 798 | 4.99/5.0 |
| Maddie | 9 | $361,799 | 405 | 4.85/5.0 |
| Richard | 11 | $308,363 | 762 | 4.87/5.0 |
| Joanna | 11 | $234,495 | 438 | 4.58/5.0 |
| Bryan | 6 | $224,731 | 217 | 4.86/5.0 |
| John | 9 | $206,258 | 236 | 4.89/5.0 |
| Corner | 7 | $156,360 | 684 | 4.81/5.0 |
| Susanna | 2 | $150,066 | 216 | 4.99/5.0 |
Analyzing the strategies of top hosts, such as their property selection, pricing, and guest communication, can offer valuable lessons for optimizing your own Airbnb operations in Beaufort.
Dive Deeper: Advanced Beaufort STR Market Data (2026)
Ready to unlock more insights? AirROI provides access to advanced metrics and comprehensive Airbnb data for Beaufort. Explore detailed analytics beyond this report to refine your investment strategy, optimize pricing, and maximize your vacation rental profits.
Explore Advanced MetricsBeaufort Short-Term Rental Market Composition (2026): Property & Room Types
Room Type Distribution
Property Type Distribution
Market Composition Insights for Beaufort
- The Beaufort Airbnb market composition is heavily skewed towards Entire Home/Apt listings, which make up 95.8% of the 333 active rentals. This indicates strong guest preference for privacy and space.
- Looking at the property type distribution in Beaufort, House properties are the most common (76%), reflecting the local real estate landscape.
- Houses represent a significant 76% portion, catering likely to families or larger groups.
- Smaller segments like hotel/boutique, outdoor/unique, others, unique stays (combined 10.2%) offer potential for unique stay experiences.
Beaufort Airbnb Room Capacity Analysis (2026): Bedroom Distribution
Distribution of Listings by Number of Bedrooms
Room Capacity Insights for Beaufort
- The dominant room capacity in Beaufort is 3 bedrooms listings, making up 34.5% of the market. This suggests a strong demand for properties suitable for families or small groups.
- Together, 3 bedrooms and 2 bedrooms properties represent 63.3% of the active Airbnb listings in Beaufort, indicating a high concentration in these sizes.
- A significant 46.2% of listings offer 3+ bedrooms, catering to larger groups and families seeking more space in Beaufort.
Beaufort Vacation Rental Guest Capacity Trends (2026)
Distribution of Listings by Guest Capacity
Guest Capacity Insights for Beaufort
- The most common guest capacity trend in Beaufort vacation rentals is listings accommodating 6 guests (30.6%). This suggests the primary traveler segment is likely larger groups.
- Properties designed for 6 guests and 4 guests dominate the Beaufort STR market, accounting for 53.1% of listings.
- 51.6% of properties accommodate 6+ guests, serving the market segment for larger families or group travel in Beaufort.
- On average, properties in Beaufort are equipped to host 5.0 guests.
Beaufort Airbnb Booking Patterns (2026): Available vs. Booked Days
Available Days Distribution
Booked Days Distribution
Booking Pattern Insights for Beaufort
- The most common availability pattern in Beaufort falls within the 181-270 days range, representing 37.8% of listings. This suggests many properties have significant open periods on their calendars.
- Approximately 66.6% of listings show high availability (181+ days open annually), indicating potential for increased bookings or specific owner usage patterns.
- For booked days, the 91-180 days range is most frequent in Beaufort (37.2%), reflecting common guest stay durations or potential owner blocking patterns.
- A notable 35.1% of properties secure long booking periods (181+ days booked per year), highlighting successful long-term rental strategies or significant owner usage.
Beaufort Airbnb Minimum Stay Requirements Analysis
Distribution of Listings by Minimum Night Requirement
1 Night
38 listings
11.4% of total
2 Nights
183 listings
55% of total
3 Nights
20 listings
6% of total
4-6 Nights
7 listings
2.1% of total
7-29 Nights
14 listings
4.2% of total
30+ Nights
71 listings
21.3% of total
Key Insights
- The most prevalent minimum stay requirement in Beaufort is 2 Nights, adopted by 55% of listings. This highlights the market's preference for shorter, flexible bookings.
- A strong majority (66.4%) of the Beaufort Airbnb data shows acceptance of very short stays (1-2 nights), indicating a dynamic, high-turnover market.
- A significant segment (21.3%) caters to monthly stays (30+ nights) in Beaufort, pointing to opportunities in the extended-stay market.
Recommendations
- Align with the market by considering a 2 Nights minimum stay, as 55% of Beaufort hosts use this setting.
- If feasible, allowing 1-night stays, especially midweek or during low season, could capture last-minute bookings, as only 11.4% currently do.
- A 2-night minimum appears standard (55%). Consider this for weekends or peak periods.
- Explore offering discounts for stays of 30+ nights to attract the 21.3% of the market seeking extended stays.
- Adjust minimum nights based on seasonality – potentially shorter during low season and longer during peak demand periods in Beaufort.
Beaufort Airbnb Cancellation Policy Trends Analysis (2026)
Super Strict 60 Days
1 listings
0.3% of total
Limited
9 listings
2.7% of total
Super Strict 30 Days
2 listings
0.6% of total
Flexible
43 listings
12.9% of total
Moderate
81 listings
24.3% of total
Firm
161 listings
48.3% of total
Strict
36 listings
10.8% of total
Cancellation Policy Insights for Beaufort
- The prevailing Airbnb cancellation policy trend in Beaufort is Firm, used by 48.3% of listings.
- A majority (59.1%) of hosts in Beaufort utilize Firm or Strict policies, indicating a market where hosts prioritize booking security.
Recommendations for Hosts
- Consider adopting a Firm policy to align with the 48.3% market standard in Beaufort.
- Using a Strict policy might deter some guests, as only 10.8% of listings use it. Evaluate if potential revenue protection outweighs possible lower booking rates.
- Regularly review your cancellation policy against competitors and market demand shifts in Beaufort.
Beaufort STR Booking Lead Time Analysis (2026)
Average Booking Lead Time by Month
Booking Lead Time Insights for Beaufort
- The overall average booking lead time for vacation rentals in Beaufort is 49 days.
- Guests book furthest in advance for stays during March (average 61 days), likely coinciding with peak travel demand or local events.
- The shortest booking windows occur for stays in August (average 37 days), indicating more last-minute travel plans during this time.
- Seasonally, Spring (59 days avg.) sees the longest lead times, while Summer (43 days avg.) has the shortest, reflecting typical travel planning cycles.
Recommendations for Hosts
- Use the overall average lead time (49 days) as a baseline for your pricing and availability strategy in Beaufort.
- For March stays, consider implementing length-of-stay discounts or slightly higher rates for bookings made less than 61 days out to capitalize on advance planning.
- Target marketing efforts for the Spring season well in advance (at least 59 days) to capture early planners.
- Monitor your own booking lead times against these Beaufort averages to identify opportunities for dynamic pricing adjustments.
Popular & Essential Airbnb Amenities in Beaufort (2026)
Amenity Prevalence
Amenity Insights for Beaufort
- Essential amenities in Beaufort that guests expect include: Air conditioning, TV, Wifi, Free parking on premises, Smoke alarm, Heating. Lacking these (any) could significantly impact bookings.
- Popular amenities like Kitchen, Hot water, Coffee maker are common but not universal. Offering these can provide a competitive edge.
Recommendations for Hosts
- Ensure your listing includes all essential amenities for Beaufort: Air conditioning, TV, Wifi, Free parking on premises, Smoke alarm, Heating.
- Prioritize adding missing essentials: Air conditioning, TV, Wifi, Free parking on premises, Smoke alarm, Heating.
- Consider adding popular differentiators like Kitchen or Hot water to increase appeal.
- Highlight unique or less common amenities you offer (e.g., hot tub, dedicated workspace, EV charger) in your listing description and photos.
- Regularly check competitor amenities in Beaufort to stay competitive.
Beaufort Airbnb Guest Demographics & Profile Analysis (2026)
Guest Profile Summary for Beaufort
- The typical guest profile for Airbnb in Beaufort consists of primarily domestic travelers (98%), often arriving from nearby Charleston, typically belonging to the Post-2000s (Gen Z/Alpha) group (50%), primarily speaking English or Spanish.
- Domestic travelers account for 97.8% of guests.
- Key international markets include United States (97.8%) and DC (0.5%).
- Top languages spoken are English (77.7%) followed by Spanish (11.6%).
- A significant demographic segment is the Post-2000s (Gen Z/Alpha) group, representing 50% of guests.
Recommendations for Hosts
- Target domestic marketing efforts towards travelers from Charleston and Charlotte.
- Tailor amenities and listing descriptions to appeal to the dominant Post-2000s (Gen Z/Alpha) demographic (e.g., highlight fast WiFi, smart home features, local guides).
- Highlight unique local experiences or amenities relevant to the primary guest profile.
- Consider seasonal promotions aligned with peak travel times for key origin markets.
Nearby Short-Term Rental Market Comparison
How does the Beaufort Airbnb market stack up against its neighbors? Compare key performance metrics like average monthly revenue, ADR, and occupancy rates in surrounding areas to understand the broader regional STR landscape.
| Market | Active Properties | Monthly Revenue | Daily Rate | Avg. Occupancy |
|---|---|---|---|---|
| Isle of Palms | 1,004 | $7,287 | $730.96 | 43% |
| Folly Beach | 904 | $7,160 | $572.70 | 47% |
| Sullivan's Island | 23 | $7,082 | $861.05 | 40% |
| Talahi Island | 41 | $6,064 | $358.56 | 51% |
| Charleston | 1,843 | $5,599 | $389.09 | 53% |
| Okatie | 11 | $5,231 | $510.60 | 41% |
| Mount Pleasant | 448 | $4,561 | $303.21 | 54% |
| Kiawah Island | 624 | $4,526 | $615.10 | 34% |
| Whitemarsh Island | 82 | $4,450 | $305.48 | 49% |
| Tybee Island | 1,356 | $4,376 | $423.03 | 42% |