Salinas Airbnb Market Analysis 2026: Short Term Rental Data & Vacation Rental Statistics in Puerto Rico, United States
Is Airbnb profitable in Salinas in 2026? Explore comprehensive Airbnb analytics for Salinas, Puerto Rico, United States to uncover income potential. This 2026 STR market report for Salinas, based on AirROI data from February 2025 to January 2026, reveals key trends in the niche market of 99 active listings.
Whether you're considering an Airbnb investment in Salinas, optimizing your existing vacation rental, or exploring rental arbitrage opportunities, understanding the Salinas Airbnb data is crucial. Leveraging the low regulation environment is key to maximizing your short term rental income potential. Let's dive into the specifics.
Key Salinas Airbnb Performance Metrics Overview
Monthly Airbnb Revenue Variations & Income Potential in Salinas (2026)
Understanding the monthly revenue variations for Airbnb listings in Salinas is key to maximizing your short term rental income potential. Seasonality significantly impacts earnings. Our analysis, based on data from the past 12 months, shows that the peak revenue month for STRs in Salinas is typically July, while January often presents the lowest earnings, highlighting opportunities for strategic pricing adjustments during shoulder and low seasons. Explore the typical Airbnb income in Salinas across different performance tiers:
- Best-in-class properties (Top 10%) achieve $5,205+ monthly, often utilizing dynamic pricing and superior guest experiences.
- Strong performing properties (Top 25%) earn $3,132 or more, indicating effective management and desirable locations/amenities.
- Typical properties (Median) generate around $1,655 per month, representing the average market performance.
- Entry-level properties (Bottom 25%) see earnings around $694, often with potential for optimization.
Average Monthly Airbnb Earnings Trend in Salinas
Salinas Airbnb Occupancy Rate Trends (2026)
Maximize your bookings by understanding the Salinas STR occupancy trends. Seasonal demand shifts significantly influence how often properties are booked. Typically, Julysees the highest demand (peak season occupancy), while January experiences the lowest (low season). Effective strategies, like adjusting minimum stays or offering promotions, can boost occupancy during slower periods. Here's how different property tiers perform in Salinas:
- Best-in-class properties (Top 10%) achieve 68%+ occupancy, indicating high desirability and potentially optimized availability.
- Strong performing properties (Top 25%) maintain 51% or higher occupancy, suggesting good market fit and guest satisfaction.
- Typical properties (Median) have an occupancy rate around 30%.
- Entry-level properties (Bottom 25%) average 15% occupancy, potentially facing higher vacancy.
Average Monthly Occupancy Rate Trend in Salinas
Average Daily Rate (ADR) Airbnb Trends in Salinas (2026)
Effective short term rental pricing strategy in Salinas involves understanding monthly ADR fluctuations. The Average Daily Rate (ADR) for Airbnb in Salinas typically peaks in October and dips lowest during April. Leveraging Airbnb dynamic pricing tools or strategies based on this seasonality can significantly boost revenue. Here's a look at the typical nightly rates achieved:
- Best-in-class properties (Top 10%) command rates of $362+ per night, often due to premium features or locations.
- Strong performing properties (Top 25%) achieve nightly rates of $241 or more.
- Typical properties (Median) charge around $156 per night.
- Entry-level properties (Bottom 25%) earn around $112 per night.
Average Daily Rate (ADR) Trend by Month in Salinas
Get Live Salinas Market Intelligence 👇

Explore Real-time Analytics
Airbnb Seasonality Analysis & Trends in Salinas (2026)
Peak Season (July, June, May)
- Revenue averages $2,960 per month
- Occupancy rates average 41.1%
- Daily rates average $205
Shoulder Season
- Revenue averages $2,392 per month
- Occupancy maintains around 35.0%
- Daily rates hold near $203
Low Season (January, October, November)
- Revenue drops to average $1,844 per month
- Occupancy decreases to average 27.7%
- Daily rates adjust to average $212
Seasonality Insights for Salinas
- The Airbnb seasonality in Salinas shows highly seasonal trends requiring careful strategy. While the sections above show seasonal averages, it's also insightful to look at the extremes:
- During the high season, the absolute peak month showcases Salinas's highest earning potential, with monthly revenues capable of climbing to $3,340, occupancy reaching a high of 46.7%, and ADRs peaking at $214.
- Conversely, the slowest single month of the year, typically falling within the low season, marks the market's lowest point. In this month, revenue might dip to $1,587, occupancy could drop to 21.7%, and ADRs may adjust down to $196.
- Understanding both the seasonal averages and these monthly peaks and troughs in revenue, occupancy, and ADR is crucial for maximizing your Airbnb profit potential in Salinas.
Seasonal Strategies for Maximizing Profit
- Peak Season: Maximize revenue through premium pricing and potentially longer minimum stays. Ensure high availability.
- Low Season: Offer competitive pricing, special promotions (e.g., extended stay discounts), and flexible cancellation policies. Target off-season travelers like remote workers or budget-conscious guests.
- Shoulder Seasons: Implement dynamic pricing that balances peak and low rates. Target weekend travelers or specific events. Offer slightly more flexible terms than peak season.
- Regularly analyze your own performance against these Salinas seasonality benchmarks and adjust your pricing and availability strategy accordingly.
Best Areas for Airbnb Investment in Salinas (2026)
Exploring the top neighborhoods for short-term rentals in Salinas? This section highlights key areas, outlining why they are attractive for hosts and guests, along with notable local attractions. Consider these locations based on your target guest profile and investment strategy.
| Neighborhood / Area | Why Host Here? (Target Guests & Appeal) | Key Attractions & Landmarks |
|---|---|---|
| Condado | A vibrant beach neighborhood known for its upscale hotels, restaurants, and nightlife, drawing tourists looking for a luxurious stay near the ocean. | Condado Beach, La Ventana al Mar, Ashford Avenue, Casino del Mar, Fortín San Gerónimo |
| Old San Juan | Full of history and culture, this area offers colorful streets, colonial architecture, and lively plazas, perfect for those wanting to explore Puerto Rico's heritage. | El Morro, San Cristóbal Castle, Catedral de San Juan, Paseo de la Princesa, Shopping in Calle del Cristo |
| Isla Verde | Popular for its beautiful beaches and resorts, Isla Verde is a hub for sun-seekers and offers a vibrant nightlife, making it attractive for both leisure and party travelers. | Isla Verde Beach, Los Muertos Beach, Carolina Beach, Margaritaville, Water Sports |
| Rincón | Famous for its surfing spots and laid-back atmosphere, Rincón attracts adventure seekers and those interested in a quieter beach experience. | Domes Beach, Maria's Beach, Rincón Lighthouse, Surfing Schools, Snorkeling Tours |
| Ponce | Known for its rich history and cultural attractions, Ponce offers a unique taste of Puerto Rican heritage, making it appealing for tourists interested in culture and history. | Ponce Historic Zone, Parque de Bombas, Museo de Arte de Ponce, La Guancha, Plaza Las Delicias |
| Luquillo | Home to beautiful beaches and the El Yunque Rainforest, Luquillo is perfect for nature lovers and those wanting to experience both beach and adventure. | Luquillo Beach, El Yunque National Forest, Kioskos de Luquillo, Fajardo Bio Bay, Surf Schools |
| Cabo Rojo | This area is known for its stunning natural beauty, including beaches and salt flats, appealing to those looking for outdoor activities and picturesque landscapes. | Playa Buyé, Los Morrillos Lighthouse, Salt Flats, Cabo Rojo National Wildlife Refuge, Beach Walks |
| Sierra Bayamon | An emerging area with beautiful landscapes and local attractions, ideal for those looking to invest in Airbnb properties with a local feel and access to nature. | Cerro Gordo Beach, Bayamon Park, Local Markets, Historical Sites, Nature Trails |
Understanding Airbnb License Requirements & STR Laws in Salinas (2026)
While Salinas, Puerto Rico, United States currently shows low STR regulations, specific Airbnb license requirements might still exist or change. Always verify the latest short term rental regulations and Airbnb license requirements directly with local government authorities for Salinas to ensure full compliance before hosting.
(Source: AirROI data, 2026, based on 1% licensed listings)
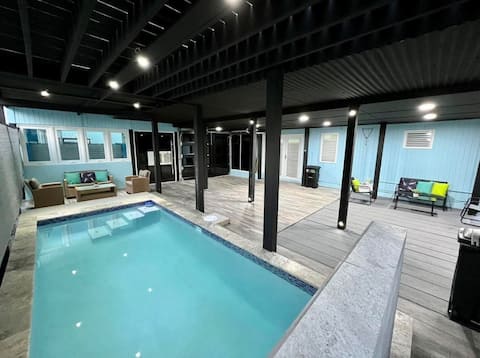
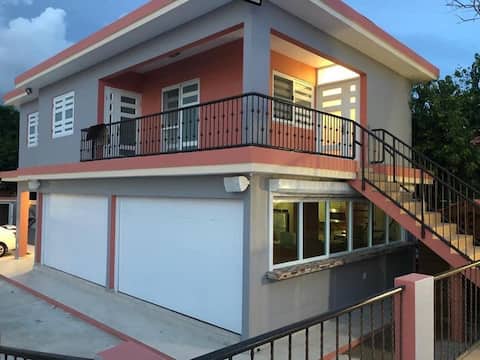
Top Performing Airbnb Properties in Salinas (2026)
Benchmark your potential! Explore examples of top-performing Airbnb properties in Salinasbased on Trailing Twelve Month (TTM) revenue. Analyze their characteristics, revenue, occupancy rate, and ADR to understand what drives success in this market.
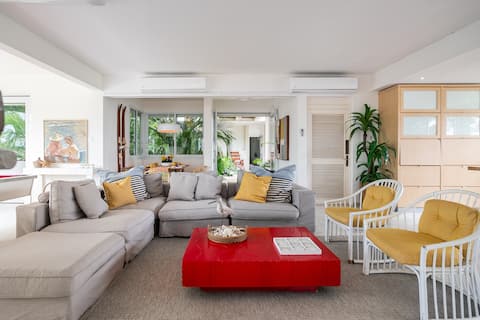
Stunning ocean front beach house with pool
Entire Place • 5 bedrooms

Caribbean House in Salinas, Puerto Rico
Entire Place • 3 bedrooms

NEW Beach, Restaurants and Pool 5 Bedrooms House
Entire Place • 5 bedrooms
Costa Mar Salinas PR
Entire Place • 4 bedrooms

Pleasure at Ease:South Side | Heated Pool |Retreat
Entire Place • 3 bedrooms
Hidden paradise
Entire Place • 4 bedrooms
Note: Performance varies based on location, size, amenities, seasonality, and management quality. Data reflects the past 12 months.
Top Performing Airbnb Hosts in Salinas (2026)
Learn from the best! This table showcases top-performing Airbnb hosts in Salinas based on the number of properties managed and estimated total revenue over the past year. Analyze their scale and performance metrics.
| Host Name | Properties | Grossing Revenue | Stay Reviews | Avg Rating |
|---|---|---|---|---|
| Sylvia | 1 | $218,028 | 69 | 4.91/5.0 |
| Yerania | 2 | $154,551 | 80 | 4.92/5.0 |
| Juan | 3 | $116,120 | 96 | 4.94/5.0 |
| Carlos | 1 | $72,606 | 38 | 4.92/5.0 |
| Wil | 1 | $70,887 | 77 | 4.86/5.0 |
| Xavier | 2 | $68,458 | 23 | 4.95/5.0 |
| Julian Y Ruth | 6 | $67,316 | 71 | 4.49/5.0 |
| Mayela | 1 | $65,380 | 82 | 4.94/5.0 |
| Delmar Vacation | 1 | $62,721 | 38 | 5.00/5.0 |
| Judith | 1 | $52,251 | 36 | 4.97/5.0 |
Analyzing the strategies of top hosts, such as their property selection, pricing, and guest communication, can offer valuable lessons for optimizing your own Airbnb operations in Salinas.
Dive Deeper: Advanced Salinas STR Market Data (2026)
Ready to unlock more insights? AirROI provides access to advanced metrics and comprehensive Airbnb data for Salinas. Explore detailed analytics beyond this report to refine your investment strategy, optimize pricing, and maximize your vacation rental profits.
Explore Advanced MetricsSalinas Short-Term Rental Market Composition (2026): Property & Room Types
Room Type Distribution
Property Type Distribution
Market Composition Insights for Salinas
- The Salinas Airbnb market composition is heavily skewed towards Entire Home/Apt listings, which make up 89.9% of the 99 active rentals. This indicates strong guest preference for privacy and space.
- Looking at the property type distribution in Salinas, House properties are the most common (69.7%), reflecting the local real estate landscape.
- Houses represent a significant 69.7% portion, catering likely to families or larger groups.
- The presence of 7.1% Hotel/Boutique listings indicates integration with traditional hospitality.
- Smaller segments like others (combined 1.0%) offer potential for unique stay experiences.
Salinas Airbnb Room Capacity Analysis (2026): Bedroom Distribution
Distribution of Listings by Number of Bedrooms
Room Capacity Insights for Salinas
- The dominant room capacity in Salinas is 3 bedrooms listings, making up 32.3% of the market. This suggests a strong demand for properties suitable for families or small groups.
- Together, 3 bedrooms and 1 bedroom properties represent 59.6% of the active Airbnb listings in Salinas, indicating a high concentration in these sizes.
- A significant 43.4% of listings offer 3+ bedrooms, catering to larger groups and families seeking more space in Salinas.
Salinas Vacation Rental Guest Capacity Trends (2026)
Distribution of Listings by Guest Capacity
Guest Capacity Insights for Salinas
- The most common guest capacity trend in Salinas vacation rentals is listings accommodating 8+ guests (35.4%). This suggests the primary traveler segment is likely larger groups.
- Properties designed for 8+ guests and 6 guests dominate the Salinas STR market, accounting for 57.6% of listings.
- 61.6% of properties accommodate 6+ guests, serving the market segment for larger families or group travel in Salinas.
- On average, properties in Salinas are equipped to host 5.7 guests.
Salinas Airbnb Booking Patterns (2026): Available vs. Booked Days
Available Days Distribution
Booked Days Distribution
Booking Pattern Insights for Salinas
- The most common availability pattern in Salinas falls within the 271-366 days range, representing 54.5% of listings. This suggests many properties have significant open periods on their calendars.
- Approximately 87.8% of listings show high availability (181+ days open annually), indicating potential for increased bookings or specific owner usage patterns.
- For booked days, the 31-90 days range is most frequent in Salinas (38.4%), reflecting common guest stay durations or potential owner blocking patterns.
- A notable 12.1% of properties secure long booking periods (181+ days booked per year), highlighting successful long-term rental strategies or significant owner usage.
Salinas Airbnb Minimum Stay Requirements Analysis
Distribution of Listings by Minimum Night Requirement
1 Night
21 listings
21.2% of total
2 Nights
55 listings
55.6% of total
3 Nights
4 listings
4% of total
30+ Nights
19 listings
19.2% of total
Key Insights
- The most prevalent minimum stay requirement in Salinas is 2 Nights, adopted by 55.6% of listings. This highlights the market's preference for shorter, flexible bookings.
- A strong majority (76.8%) of the Salinas Airbnb data shows acceptance of very short stays (1-2 nights), indicating a dynamic, high-turnover market.
- A significant segment (19.2%) caters to monthly stays (30+ nights) in Salinas, pointing to opportunities in the extended-stay market.
Recommendations
- Align with the market by considering a 2 Nights minimum stay, as 55.6% of Salinas hosts use this setting.
- If feasible, allowing 1-night stays, especially midweek or during low season, could capture last-minute bookings, as only 21.2% currently do.
- Explore offering discounts for stays of 30+ nights to attract the 19.2% of the market seeking extended stays.
- Adjust minimum nights based on seasonality – potentially shorter during low season and longer during peak demand periods in Salinas.
Salinas Airbnb Cancellation Policy Trends Analysis (2026)
Limited
1 listings
1% of total
Flexible
37 listings
37.4% of total
Moderate
18 listings
18.2% of total
Firm
34 listings
34.3% of total
Strict
9 listings
9.1% of total
Cancellation Policy Insights for Salinas
- The prevailing Airbnb cancellation policy trend in Salinas is Flexible, used by 37.4% of listings.
- There's a relatively balanced mix between guest-friendly (55.6%) and stricter (43.4%) policies, offering choices for different guest needs.
- Strict cancellation policies are quite rare (9.1%), potentially making listings with this policy less competitive unless justified by high demand or property type.
Recommendations for Hosts
- Consider adopting a Flexible policy to align with the 37.4% market standard in Salinas.
- Using a Strict policy might deter some guests, as only 9.1% of listings use it. Evaluate if potential revenue protection outweighs possible lower booking rates.
- Regularly review your cancellation policy against competitors and market demand shifts in Salinas.
Salinas STR Booking Lead Time Analysis (2026)
Average Booking Lead Time by Month
Booking Lead Time Insights for Salinas
- The overall average booking lead time for vacation rentals in Salinas is 44 days.
- Guests book furthest in advance for stays during December (average 78 days), likely coinciding with peak travel demand or local events.
- The shortest booking windows occur for stays in February (average 27 days), indicating more last-minute travel plans during this time.
- Seasonally, Winter (55 days avg.) sees the longest lead times, while Spring (36 days avg.) has the shortest, reflecting typical travel planning cycles.
Recommendations for Hosts
- Use the overall average lead time (44 days) as a baseline for your pricing and availability strategy in Salinas.
- For December stays, consider implementing length-of-stay discounts or slightly higher rates for bookings made less than 78 days out to capitalize on advance planning.
- Target marketing efforts for the Winter season well in advance (at least 55 days) to capture early planners.
- Monitor your own booking lead times against these Salinas averages to identify opportunities for dynamic pricing adjustments.
Popular & Essential Airbnb Amenities in Salinas (2026)
Amenity Prevalence
Amenity Insights for Salinas
- Essential amenities in Salinas that guests expect include: Air conditioning, TV. Lacking these (any) could significantly impact bookings.
- Popular amenities like Free parking on premises, Wifi, Kitchen are common but not universal. Offering these can provide a competitive edge.
- Warning: Wifi is not universally provided but is considered essential globally. Ensure reliable Wifi is offered.
Recommendations for Hosts
- Ensure your listing includes all essential amenities for Salinas: Air conditioning, TV.
- Prioritize adding missing essentials: TV.
- Consider adding popular differentiators like Free parking on premises or Wifi to increase appeal.
- Highlight unique or less common amenities you offer (e.g., hot tub, dedicated workspace, EV charger) in your listing description and photos.
- Regularly check competitor amenities in Salinas to stay competitive.
Salinas Airbnb Guest Demographics & Profile Analysis (2026)
Guest Profile Summary for Salinas
- The typical guest profile for Airbnb in Salinas consists of a mix of domestic (50%) and international guests, with top international origins including Puerto Rico, typically belonging to the Post-2000s (Gen Z/Alpha) group (50%), primarily speaking English or Spanish.
- Domestic travelers account for 49.9% of guests.
- Key international markets include United States (49.9%) and Puerto Rico (47.4%).
- Top languages spoken are English (47.3%) followed by Spanish (45.8%).
- A significant demographic segment is the Post-2000s (Gen Z/Alpha) group, representing 50% of guests.
Recommendations for Hosts
- Balance marketing efforts between domestic and international channels based on the guest mix.
- Tailor amenities and listing descriptions to appeal to the dominant Post-2000s (Gen Z/Alpha) demographic (e.g., highlight fast WiFi, smart home features, local guides).
- Highlight unique local experiences or amenities relevant to the primary guest profile.
- Consider seasonal promotions aligned with peak travel times for key origin markets.
Nearby Short-Term Rental Market Comparison
How does the Salinas Airbnb market stack up against its neighbors? Compare key performance metrics like average monthly revenue, ADR, and occupancy rates in surrounding areas to understand the broader regional STR landscape.
| Market | Active Properties | Monthly Revenue | Daily Rate | Avg. Occupancy |
|---|---|---|---|---|
| Guánica | 16 | $6,050 | $468.80 | 33% |
| Sabana | 16 | $5,847 | $454.72 | 44% |
| Fortuna | 14 | $5,521 | $311.09 | 50% |
| Mameyes II | 17 | $4,242 | $349.18 | 48% |
| Vega Alta | 78 | $4,082 | $336.12 | 46% |
| Río Grande | 100 | $4,068 | $457.29 | 44% |
| Río Grande | 609 | $4,033 | $368.55 | 43% |
| Dorado | 270 | $4,019 | $431.44 | 44% |
| Playa Fortuna | 14 | $3,994 | $256.75 | 49% |
| Cayey | 40 | $3,836 | $255.45 | 49% |