Río Grande Airbnb Market Analysis 2026: Short Term Rental Data & Vacation Rental Statistics in Puerto Rico, United States
Is Airbnb profitable in Río Grande in 2026? Explore comprehensive Airbnb analytics for Río Grande, Puerto Rico, United States to uncover income potential. This 2026 STR market report for Río Grande, based on AirROI data from February 2025 to January 2026, reveals key trends in the market of 609 active listings.
Whether you're considering an Airbnb investment in Río Grande, optimizing your existing vacation rental, or exploring rental arbitrage opportunities, understanding the Río Grande Airbnb data is crucial. Leveraging the low regulation environment is key to maximizing your short term rental income potential. Let's dive into the specifics.
Key Río Grande Airbnb Performance Metrics Overview
Monthly Airbnb Revenue Variations & Income Potential in Río Grande (2026)
Understanding the monthly revenue variations for Airbnb listings in Río Grande is key to maximizing your short term rental income potential. Seasonality significantly impacts earnings. Our analysis, based on data from the past 12 months, shows that the peak revenue month for STRs in Río Grande is typically March, while September often presents the lowest earnings, highlighting opportunities for strategic pricing adjustments during shoulder and low seasons. Explore the typical Airbnb income in Río Grande across different performance tiers:
- Best-in-class properties (Top 10%) achieve $11,821+ monthly, often utilizing dynamic pricing and superior guest experiences.
- Strong performing properties (Top 25%) earn $5,867 or more, indicating effective management and desirable locations/amenities.
- Typical properties (Median) generate around $3,139 per month, representing the average market performance.
- Entry-level properties (Bottom 25%) see earnings around $1,612, often with potential for optimization.
Average Monthly Airbnb Earnings Trend in Río Grande
Río Grande Airbnb Occupancy Rate Trends (2026)
Maximize your bookings by understanding the Río Grande STR occupancy trends. Seasonal demand shifts significantly influence how often properties are booked. Typically, Marchsees the highest demand (peak season occupancy), while September experiences the lowest (low season). Effective strategies, like adjusting minimum stays or offering promotions, can boost occupancy during slower periods. Here's how different property tiers perform in Río Grande:
- Best-in-class properties (Top 10%) achieve 82%+ occupancy, indicating high desirability and potentially optimized availability.
- Strong performing properties (Top 25%) maintain 67% or higher occupancy, suggesting good market fit and guest satisfaction.
- Typical properties (Median) have an occupancy rate around 44%.
- Entry-level properties (Bottom 25%) average 24% occupancy, potentially facing higher vacancy.
Average Monthly Occupancy Rate Trend in Río Grande
Average Daily Rate (ADR) Airbnb Trends in Río Grande (2026)
Effective short term rental pricing strategy in Río Grande involves understanding monthly ADR fluctuations. The Average Daily Rate (ADR) for Airbnb in Río Grande typically peaks in December and dips lowest during September. Leveraging Airbnb dynamic pricing tools or strategies based on this seasonality can significantly boost revenue. Here's a look at the typical nightly rates achieved:
- Best-in-class properties (Top 10%) command rates of $786+ per night, often due to premium features or locations.
- Strong performing properties (Top 25%) achieve nightly rates of $396 or more.
- Typical properties (Median) charge around $229 per night.
- Entry-level properties (Bottom 25%) earn around $160 per night.
Average Daily Rate (ADR) Trend by Month in Río Grande
Get Live Río Grande Market Intelligence 👇

Explore Real-time Analytics
Airbnb Seasonality Analysis & Trends in Río Grande (2026)
Peak Season (March, February, July)
- Revenue averages $6,806 per month
- Occupancy rates average 59.3%
- Daily rates average $376
Shoulder Season
- Revenue averages $5,170 per month
- Occupancy maintains around 44.8%
- Daily rates hold near $376
Low Season (September, October, November)
- Revenue drops to average $3,570 per month
- Occupancy decreases to average 33.8%
- Daily rates adjust to average $358
Seasonality Insights for Río Grande
- The Airbnb seasonality in Río Grande shows highly seasonal trends requiring careful strategy. While the sections above show seasonal averages, it's also insightful to look at the extremes:
- During the high season, the absolute peak month showcases Río Grande's highest earning potential, with monthly revenues capable of climbing to $7,920, occupancy reaching a high of 64.8%, and ADRs peaking at $393.
- Conversely, the slowest single month of the year, typically falling within the low season, marks the market's lowest point. In this month, revenue might dip to $3,190, occupancy could drop to 32.8%, and ADRs may adjust down to $350.
- Understanding both the seasonal averages and these monthly peaks and troughs in revenue, occupancy, and ADR is crucial for maximizing your Airbnb profit potential in Río Grande.
Seasonal Strategies for Maximizing Profit
- Peak Season: Maximize revenue through premium pricing and potentially longer minimum stays. Ensure high availability.
- Low Season: Offer competitive pricing, special promotions (e.g., extended stay discounts), and flexible cancellation policies. Target off-season travelers like remote workers or budget-conscious guests.
- Shoulder Seasons: Implement dynamic pricing that balances peak and low rates. Target weekend travelers or specific events. Offer slightly more flexible terms than peak season.
- Regularly analyze your own performance against these Río Grande seasonality benchmarks and adjust your pricing and availability strategy accordingly.
Best Areas for Airbnb Investment in Río Grande (2026)
Exploring the top neighborhoods for short-term rentals in Río Grande? This section highlights key areas, outlining why they are attractive for hosts and guests, along with notable local attractions. Consider these locations based on your target guest profile and investment strategy.
| Neighborhood / Area | Why Host Here? (Target Guests & Appeal) | Key Attractions & Landmarks |
|---|---|---|
| Isla Verde | Popular tourist destination known for its beautiful beaches and vibrant nightlife. Ideal for travelers who want to enjoy sun, sand, and a lively environment. | Isla Verde Beach, El San Juan Hotel Casino, Luis Muñoz Marín International Airport, Carolina Beach, Water sports activities |
| Condado | Trendy area in San Juan with upscale hotels, restaurants, and shopping. Attracts both tourists and locals for its beach access and vibrant culture. | Condado Beach, Ashford Avenue shopping, La Ventana al Mar, Fort San Jerónimo, Dining and nightlife options |
| Old San Juan | Historic district known for its colorful buildings and rich history. Perfect for guests looking to experience the culture and history of Puerto Rico. | El Morro, San Cristóbal Fort, Historic colonial architecture, Bacardi Distillery, Local marketplaces |
| Rincón | Famous for its surf beaches and stunning sunsets. Ideal for vacationers seeking a more relaxed and nature-focused experience. | Domes Beach, Punta Higüero Lighthouse, Rincón Surf School, Nearby diving opportunities, With an artistic community |
| Ponce | Cultural capital of Puerto Rico with beautiful plazas, museums, and colonial architecture. Great for travelers interested in arts and history. | Plaza Las Delicias, Ponce Museum of Art, Parque de Bombas, Château de Serrallés, Historic architecture |
| Culebra Island | A serene island getaway known for its stunning beaches and exceptional snorkeling. Perfect for those looking for a remote and peaceful experience. | Flamenco Beach, Culebra National Wildlife Refuge, Snorkeling and diving spots, Tamarindo Beach, Local seafood restaurants |
| Fajardo | Gateway to the beautiful beaches and cays of the eastern part of Puerto Rico. Popular for outdoor activities like kayaking and sailing. | El Yunque National Forest, Fajardo Bio Bay, Luquillo Beach, Ocean kayaking tours, Cayo Icacos |
| Cabo Rojo | Renowned for its scenic cliffs and stunning beaches. Attracts guests looking for natural beauty and relaxation. | Los Morrillos Lighthouse, Cabo Rojo National Wildlife Refuge, Buye Beach, Playuela Beach, Salt flats and birdwatching |
Understanding Airbnb License Requirements & STR Laws in Río Grande (2026)
While Río Grande, Puerto Rico, United States currently shows low STR regulations, specific Airbnb license requirements might still exist or change. Always verify the latest short term rental regulations and Airbnb license requirements directly with local government authorities for Río Grande to ensure full compliance before hosting.
(Source: AirROI data, 2026, finding no licensed listings among those analyzed)
Top Performing Airbnb Properties in Río Grande (2026)
Benchmark your potential! Explore examples of top-performing Airbnb properties in Río Grandebased on Trailing Twelve Month (TTM) revenue. Analyze their characteristics, revenue, occupancy rate, and ADR to understand what drives success in this market.

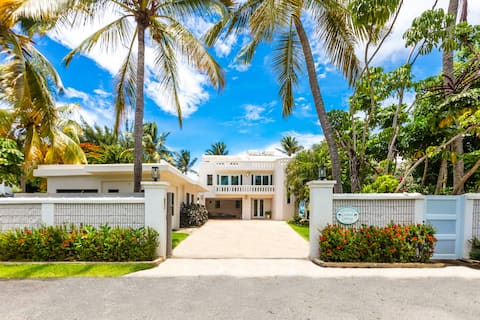
New Luxury Beachfront Home in 5 Diamond Resort
Entire Place • 4 bedrooms
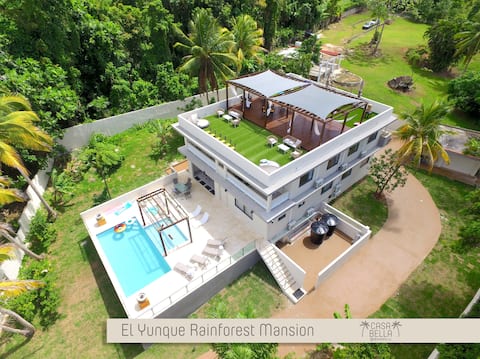
Casa Bella - El Yunque Rainforest Mansion.
Entire Place • 7 bedrooms

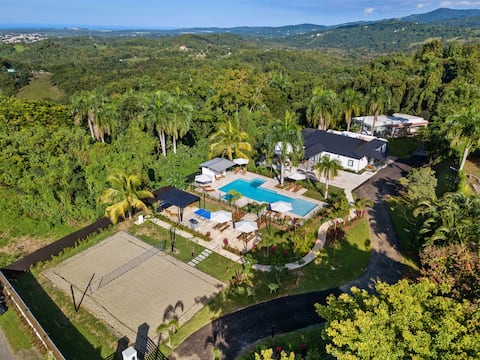
Stunning Private Oasis with Pool and Ocean Views
Entire Place • 8 bedrooms
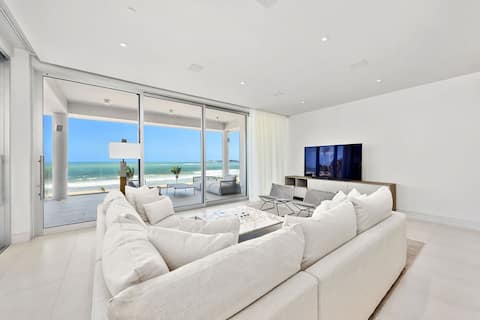
8 Bedroom Ocean Front Villa with Pool and Privacy
Entire Place • 8 bedrooms
Finca Monarca- Full Property
Entire Place • 7 bedrooms
The Beach
Entire Place • 3 bedrooms
Note: Performance varies based on location, size, amenities, seasonality, and management quality. Data reflects the past 12 months.
Top Performing Airbnb Hosts in Río Grande (2026)
Learn from the best! This table showcases top-performing Airbnb hosts in Río Grande based on the number of properties managed and estimated total revenue over the past year. Analyze their scale and performance metrics.
| Host Name | Properties | Grossing Revenue | Stay Reviews | Avg Rating |
|---|---|---|---|---|
| Lucia | 4 | $775,279 | 133 | 5.00/5.0 |
| Diana | 9 | $728,616 | 409 | 4.83/5.0 |
| Susan | 3 | $670,682 | 225 | 4.87/5.0 |
| West Indies Vacation Rentals | 5 | $629,801 | 596 | 4.81/5.0 |
| The Marco Polo Collection | 5 | $605,741 | 43 | 4.75/5.0 |
| Antonio | 4 | $600,409 | 158 | 4.98/5.0 |
| Arturo | 4 | $558,447 | 232 | 4.88/5.0 |
| Christophe | 4 | $542,297 | 254 | 4.88/5.0 |
| Carolina | 1 | $474,930 | 47 | 4.96/5.0 |
| Carlos | 2 | $454,275 | 116 | 4.88/5.0 |
Analyzing the strategies of top hosts, such as their property selection, pricing, and guest communication, can offer valuable lessons for optimizing your own Airbnb operations in Río Grande.
Dive Deeper: Advanced Río Grande STR Market Data (2026)
Ready to unlock more insights? AirROI provides access to advanced metrics and comprehensive Airbnb data for Río Grande. Explore detailed analytics beyond this report to refine your investment strategy, optimize pricing, and maximize your vacation rental profits.
Explore Advanced MetricsRío Grande Short-Term Rental Market Composition (2026): Property & Room Types
Room Type Distribution
Property Type Distribution
Market Composition Insights for Río Grande
- The Río Grande Airbnb market composition is heavily skewed towards Entire Home/Apt listings, which make up 97.2% of the 609 active rentals. This indicates strong guest preference for privacy and space.
- Looking at the property type distribution in Río Grande, Apartment/Condo properties are the most common (67.3%), reflecting the local real estate landscape.
- Houses represent a significant 24.1% portion, catering likely to families or larger groups.
- Smaller segments like others, hotel/boutique, unique stays, outdoor/unique (combined 8.5%) offer potential for unique stay experiences.
Río Grande Airbnb Room Capacity Analysis (2026): Bedroom Distribution
Distribution of Listings by Number of Bedrooms
Room Capacity Insights for Río Grande
- The dominant room capacity in Río Grande is 2 bedrooms listings, making up 28.1% of the market. This suggests a strong demand for properties suitable for couples or solo travelers.
- Together, 2 bedrooms and 3 bedrooms properties represent 54.5% of the active Airbnb listings in Río Grande, indicating a high concentration in these sizes.
- A significant 39.7% of listings offer 3+ bedrooms, catering to larger groups and families seeking more space in Río Grande.
Río Grande Vacation Rental Guest Capacity Trends (2026)
Distribution of Listings by Guest Capacity
Guest Capacity Insights for Río Grande
- The most common guest capacity trend in Río Grande vacation rentals is listings accommodating 6 guests (26.6%). This suggests the primary traveler segment is likely larger groups.
- Properties designed for 6 guests and 8+ guests dominate the Río Grande STR market, accounting for 52.9% of listings.
- 56.0% of properties accommodate 6+ guests, serving the market segment for larger families or group travel in Río Grande.
- On average, properties in Río Grande are equipped to host 5.4 guests.
Río Grande Airbnb Booking Patterns (2026): Available vs. Booked Days
Available Days Distribution
Booked Days Distribution
Booking Pattern Insights for Río Grande
- The most common availability pattern in Río Grande falls within the 271-366 days range, representing 36.6% of listings. This suggests many properties have significant open periods on their calendars.
- Approximately 71.4% of listings show high availability (181+ days open annually), indicating potential for increased bookings or specific owner usage patterns.
- For booked days, the 91-180 days range is most frequent in Río Grande (34%), reflecting common guest stay durations or potential owner blocking patterns.
- A notable 30.2% of properties secure long booking periods (181+ days booked per year), highlighting successful long-term rental strategies or significant owner usage.
Río Grande Airbnb Minimum Stay Requirements Analysis
Distribution of Listings by Minimum Night Requirement
1 Night
59 listings
9.7% of total
2 Nights
194 listings
31.9% of total
3 Nights
88 listings
14.4% of total
4-6 Nights
60 listings
9.9% of total
7-29 Nights
8 listings
1.3% of total
30+ Nights
200 listings
32.8% of total
Key Insights
- The most prevalent minimum stay requirement in Río Grande is 30+ Nights, adopted by 32.8% of listings. This highlights the market's preference for longer commitments.
- A significant segment (32.8%) caters to monthly stays (30+ nights) in Río Grande, pointing to opportunities in the extended-stay market.
Recommendations
- Align with the market by considering a 30+ Nights minimum stay, as 32.8% of Río Grande hosts use this setting.
- If feasible, allowing 1-night stays, especially midweek or during low season, could capture last-minute bookings, as only 9.7% currently do.
- A 2-night minimum appears standard (31.9%). Consider this for weekends or peak periods.
- Explore offering discounts for stays of 30+ nights to attract the 32.8% of the market seeking extended stays.
- Adjust minimum nights based on seasonality – potentially shorter during low season and longer during peak demand periods in Río Grande.
Río Grande Airbnb Cancellation Policy Trends Analysis (2026)
Super Strict 60 Days
2 listings
0.3% of total
Super Strict 30 Days
6 listings
1% of total
Limited
10 listings
1.6% of total
Flexible
109 listings
17.9% of total
Moderate
130 listings
21.3% of total
Firm
234 listings
38.4% of total
Strict
118 listings
19.4% of total
Cancellation Policy Insights for Río Grande
- The prevailing Airbnb cancellation policy trend in Río Grande is Firm, used by 38.4% of listings.
- A majority (57.8%) of hosts in Río Grande utilize Firm or Strict policies, indicating a market where hosts prioritize booking security.
Recommendations for Hosts
- Consider adopting a Firm policy to align with the 38.4% market standard in Río Grande.
- Regularly review your cancellation policy against competitors and market demand shifts in Río Grande.
Río Grande STR Booking Lead Time Analysis (2026)
Average Booking Lead Time by Month
Booking Lead Time Insights for Río Grande
- The overall average booking lead time for vacation rentals in Río Grande is 53 days.
- Guests book furthest in advance for stays during December (average 81 days), likely coinciding with peak travel demand or local events.
- The shortest booking windows occur for stays in September (average 38 days), indicating more last-minute travel plans during this time.
- Seasonally, Winter (68 days avg.) sees the longest lead times, while Fall (46 days avg.) has the shortest, reflecting typical travel planning cycles.
Recommendations for Hosts
- Use the overall average lead time (53 days) as a baseline for your pricing and availability strategy in Río Grande.
- For December stays, consider implementing length-of-stay discounts or slightly higher rates for bookings made less than 81 days out to capitalize on advance planning.
- Target marketing efforts for the Winter season well in advance (at least 68 days) to capture early planners.
- Monitor your own booking lead times against these Río Grande averages to identify opportunities for dynamic pricing adjustments.
Popular & Essential Airbnb Amenities in Río Grande (2026)
Amenity Prevalence
Amenity Insights for Río Grande
- Essential amenities in Río Grande that guests expect include: Wifi, Air conditioning, TV. Lacking these (any) could significantly impact bookings.
- Popular amenities like Kitchen, Free parking on premises, Hot water are common but not universal. Offering these can provide a competitive edge.
Recommendations for Hosts
- Ensure your listing includes all essential amenities for Río Grande: Wifi, Air conditioning, TV.
- Prioritize adding missing essentials: Wifi, Air conditioning, TV.
- Consider adding popular differentiators like Kitchen or Free parking on premises to increase appeal.
- Highlight unique or less common amenities you offer (e.g., hot tub, dedicated workspace, EV charger) in your listing description and photos.
- Regularly check competitor amenities in Río Grande to stay competitive.
Río Grande Airbnb Guest Demographics & Profile Analysis (2026)
Guest Profile Summary for Río Grande
- The typical guest profile for Airbnb in Río Grande consists of primarily domestic travelers (84%), often arriving from nearby New York, typically belonging to the Post-2000s (Gen Z/Alpha) group (50%), primarily speaking English or Spanish.
- Domestic travelers account for 83.5% of guests.
- Key international markets include United States (83.5%) and Puerto Rico (12.2%).
- Top languages spoken are English (56.4%) followed by Spanish (33%).
- A significant demographic segment is the Post-2000s (Gen Z/Alpha) group, representing 50% of guests.
Recommendations for Hosts
- Target domestic marketing efforts towards travelers from New York and San Juan.
- Tailor amenities and listing descriptions to appeal to the dominant Post-2000s (Gen Z/Alpha) demographic (e.g., highlight fast WiFi, smart home features, local guides).
- Highlight unique local experiences or amenities relevant to the primary guest profile.
- Consider seasonal promotions aligned with peak travel times for key origin markets.
Nearby Short-Term Rental Market Comparison
How does the Río Grande Airbnb market stack up against its neighbors? Compare key performance metrics like average monthly revenue, ADR, and occupancy rates in surrounding areas to understand the broader regional STR landscape.
| Market | Active Properties | Monthly Revenue | Daily Rate | Avg. Occupancy |
|---|---|---|---|---|
| Central | 15 | $7,894 | $1132.95 | 46% |
| Guánica | 16 | $6,050 | $468.80 | 33% |
| Cruz Bay | 399 | $6,017 | $618.02 | 46% |
| Sabana | 16 | $5,847 | $454.72 | 44% |
| Northside | 62 | $5,784 | $544.57 | 42% |
| Fortuna | 14 | $5,521 | $311.09 | 50% |
| Coral Harbour | 162 | $5,478 | $461.88 | 51% |
| Charlotte Amalie | 12 | $4,939 | $453.47 | 42% |
| Cruz Bay | 26 | $4,683 | $550.44 | 41% |
| Mameyes II | 17 | $4,242 | $349.18 | 48% |