Isabela Airbnb Market Analysis 2026: Short Term Rental Data & Vacation Rental Statistics in Puerto Rico, United States
Is Airbnb profitable in Isabela in 2026? Explore comprehensive Airbnb analytics for Isabela, Puerto Rico, United States to uncover income potential. This 2026 STR market report for Isabela, based on AirROI data from February 2025 to January 2026, reveals key trends in the market of 616 active listings.
Whether you're considering an Airbnb investment in Isabela, optimizing your existing vacation rental, or exploring rental arbitrage opportunities, understanding the Isabela Airbnb data is crucial. Leveraging the low regulation environment is key to maximizing your short term rental income potential. Let's dive into the specifics.
Key Isabela Airbnb Performance Metrics Overview
Monthly Airbnb Revenue Variations & Income Potential in Isabela (2026)
Understanding the monthly revenue variations for Airbnb listings in Isabela is key to maximizing your short term rental income potential. Seasonality significantly impacts earnings. Our analysis, based on data from the past 12 months, shows that the peak revenue month for STRs in Isabela is typically July, while September often presents the lowest earnings, highlighting opportunities for strategic pricing adjustments during shoulder and low seasons. Explore the typical Airbnb income in Isabela across different performance tiers:
- Best-in-class properties (Top 10%) achieve $5,409+ monthly, often utilizing dynamic pricing and superior guest experiences.
- Strong performing properties (Top 25%) earn $3,288 or more, indicating effective management and desirable locations/amenities.
- Typical properties (Median) generate around $1,792 per month, representing the average market performance.
- Entry-level properties (Bottom 25%) see earnings around $909, often with potential for optimization.
Average Monthly Airbnb Earnings Trend in Isabela
Isabela Airbnb Occupancy Rate Trends (2026)
Maximize your bookings by understanding the Isabela STR occupancy trends. Seasonal demand shifts significantly influence how often properties are booked. Typically, Julysees the highest demand (peak season occupancy), while September experiences the lowest (low season). Effective strategies, like adjusting minimum stays or offering promotions, can boost occupancy during slower periods. Here's how different property tiers perform in Isabela:
- Best-in-class properties (Top 10%) achieve 78%+ occupancy, indicating high desirability and potentially optimized availability.
- Strong performing properties (Top 25%) maintain 61% or higher occupancy, suggesting good market fit and guest satisfaction.
- Typical properties (Median) have an occupancy rate around 41%.
- Entry-level properties (Bottom 25%) average 22% occupancy, potentially facing higher vacancy.
Average Monthly Occupancy Rate Trend in Isabela
Average Daily Rate (ADR) Airbnb Trends in Isabela (2026)
Effective short term rental pricing strategy in Isabela involves understanding monthly ADR fluctuations. The Average Daily Rate (ADR) for Airbnb in Isabela typically peaks in December and dips lowest during April. Leveraging Airbnb dynamic pricing tools or strategies based on this seasonality can significantly boost revenue. Here's a look at the typical nightly rates achieved:
- Best-in-class properties (Top 10%) command rates of $318+ per night, often due to premium features or locations.
- Strong performing properties (Top 25%) achieve nightly rates of $203 or more.
- Typical properties (Median) charge around $146 per night.
- Entry-level properties (Bottom 25%) earn around $104 per night.
Average Daily Rate (ADR) Trend by Month in Isabela
Get Live Isabela Market Intelligence 👇

Explore Real-time Analytics
Airbnb Seasonality Analysis & Trends in Isabela (2026)
Peak Season (July, March, February)
- Revenue averages $3,333 per month
- Occupancy rates average 54.8%
- Daily rates average $186
Shoulder Season
- Revenue averages $2,612 per month
- Occupancy maintains around 41.9%
- Daily rates hold near $189
Low Season (September, October, November)
- Revenue drops to average $1,971 per month
- Occupancy decreases to average 32.6%
- Daily rates adjust to average $189
Seasonality Insights for Isabela
- The Airbnb seasonality in Isabela shows highly seasonal trends requiring careful strategy. While the sections above show seasonal averages, it's also insightful to look at the extremes:
- During the high season, the absolute peak month showcases Isabela's highest earning potential, with monthly revenues capable of climbing to $3,587, occupancy reaching a high of 55.7%, and ADRs peaking at $195.
- Conversely, the slowest single month of the year, typically falling within the low season, marks the market's lowest point. In this month, revenue might dip to $1,652, occupancy could drop to 28.5%, and ADRs may adjust down to $181.
- Understanding both the seasonal averages and these monthly peaks and troughs in revenue, occupancy, and ADR is crucial for maximizing your Airbnb profit potential in Isabela.
Seasonal Strategies for Maximizing Profit
- Peak Season: Maximize revenue through premium pricing and potentially longer minimum stays. Ensure high availability.
- Low Season: Offer competitive pricing, special promotions (e.g., extended stay discounts), and flexible cancellation policies. Target off-season travelers like remote workers or budget-conscious guests.
- Shoulder Seasons: Implement dynamic pricing that balances peak and low rates. Target weekend travelers or specific events. Offer slightly more flexible terms than peak season.
- Regularly analyze your own performance against these Isabela seasonality benchmarks and adjust your pricing and availability strategy accordingly.
Best Areas for Airbnb Investment in Isabela (2026)
Exploring the top neighborhoods for short-term rentals in Isabela? This section highlights key areas, outlining why they are attractive for hosts and guests, along with notable local attractions. Consider these locations based on your target guest profile and investment strategy.
| Neighborhood / Area | Why Host Here? (Target Guests & Appeal) | Key Attractions & Landmarks |
|---|---|---|
| Jobos Beach | Famous for its surf spots and laid-back vibe. A great choice for beach lovers and surfers looking for an adventurous getaway. | Jobos Beach, Rincon Surf School, Shacks Beach, Punta Higuero Light House, Rincón Art Walk |
| Isabela Beach | Known for its beautiful sandy beaches and crystal-clear waters, Isabela Beach attracts tourists who appreciate both relaxation and outdoor activities. | Isabela Beach, Melao Beach, Cueva de la Ventana, Punta Grossa, Isabela Town |
| Guajataca Beach | A picturesque beach with unique rock formations and great conditions for swimming and snorkeling. Ideal for families and nature enthusiasts. | Guajataca Beach, Guajataca Forest Preserve, Tunel de Guajataca, Pueblo de Quebradillas, Playa La Poza |
| Caves of Camuy | Located nearby, this incredible subterranean network offers a unique experience for adventurous visitors interested in nature and geology. | Caves of Camuy, Parque Nacional de las Cavernas del Río Camuy, Cueva del Indio, La Cueva de los Reyes, Cueva de los Muertos |
| Paseo Lineal de Isabela | A beautiful path for walking and biking along the coast, perfect for tourists looking to explore the scenic views of Isabela. | Paseo Lineal de Isabela, Rincón Marina, El Parque de la Libertad, La Tabla, Piscinas Naturales |
| Punta Santiago | A quiet area known for its stunning sunsets and serene beach experience, ideal for couples and families. | Punta Santiago Beach, Tamarindo Beach, Las Cascadas, Caguas Botanical Garden, Punta Santiago Cemetery |
| Playa La Boca | Less crowded beach, providing a calm atmosphere for relaxation, perfect for those looking to unwind away from busier tourist spots. | Playa La Boca, Playa El Bónfico, The Blue Room, Isabela Farmers Market, Casa de la Cultura |
| Rincón | Famous surfing destination with vibrant nightlife and a variety of local restaurants, suitable for those looking for both adventure and culture. | Rincón Beach, Domes Beach, Puntas Beach, Tamboo Tavern, Rincón Lighthouse |
Understanding Airbnb License Requirements & STR Laws in Isabela (2026)
While Isabela, Puerto Rico, United States currently shows low STR regulations, specific Airbnb license requirements might still exist or change. Always verify the latest short term rental regulations and Airbnb license requirements directly with local government authorities for Isabela to ensure full compliance before hosting.
(Source: AirROI data, 2026, finding no licensed listings among those analyzed)
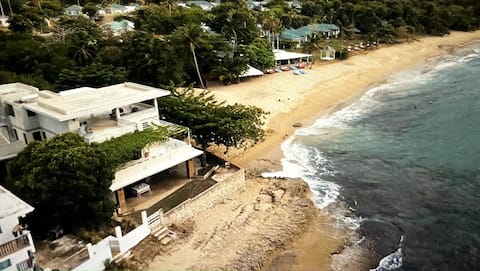
Top Performing Airbnb Properties in Isabela (2026)
Benchmark your potential! Explore examples of top-performing Airbnb properties in Isabelabased on Trailing Twelve Month (TTM) revenue. Analyze their characteristics, revenue, occupancy rate, and ADR to understand what drives success in this market.
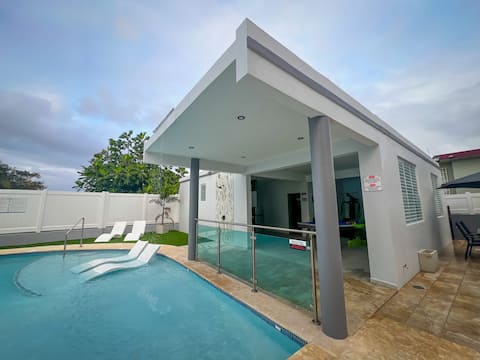
Isabela Luxury Escape
Entire Place • 9 bedrooms
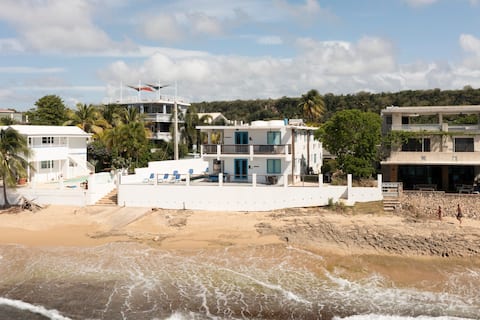
Villa Shacks Entire House
Entire Place • 8 bedrooms
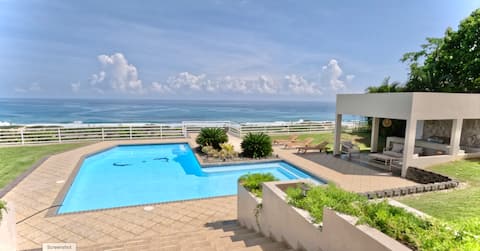
Casa Middles
Entire Place • 4 bedrooms
The Residence at Shacks Beach
Entire Place • 6 bedrooms

Caribbean Dream House
Entire Place • 3 bedrooms

Vacation and Destination Wedding Villa, Sleeps 50!
Entire Place • 9 bedrooms
Note: Performance varies based on location, size, amenities, seasonality, and management quality. Data reflects the past 12 months.
Top Performing Airbnb Hosts in Isabela (2026)
Learn from the best! This table showcases top-performing Airbnb hosts in Isabela based on the number of properties managed and estimated total revenue over the past year. Analyze their scale and performance metrics.
| Host Name | Properties | Grossing Revenue | Stay Reviews | Avg Rating |
|---|---|---|---|---|
| Arnaldo | 24 | $1,131,183 | 2355 | 4.77/5.0 |
| Mark | 8 | $607,560 | 725 | 4.94/5.0 |
| Kelda | 14 | $471,126 | 1548 | 4.69/5.0 |
| Leican Properties | 7 | $362,004 | 185 | 4.93/5.0 |
| Alexander | 3 | $293,239 | 24 | 4.26/5.0 |
| Elmira | 3 | $284,371 | 135 | 5.00/5.0 |
| Casa Cascada LLC | 2 | $246,267 | 47 | 4.96/5.0 |
| Luisa | 13 | $217,789 | 255 | 4.58/5.0 |
| David | 8 | $215,159 | 533 | 4.58/5.0 |
| Anika | 1 | $197,869 | 34 | 5.00/5.0 |
Analyzing the strategies of top hosts, such as their property selection, pricing, and guest communication, can offer valuable lessons for optimizing your own Airbnb operations in Isabela.
Dive Deeper: Advanced Isabela STR Market Data (2026)
Ready to unlock more insights? AirROI provides access to advanced metrics and comprehensive Airbnb data for Isabela. Explore detailed analytics beyond this report to refine your investment strategy, optimize pricing, and maximize your vacation rental profits.
Explore Advanced MetricsIsabela Short-Term Rental Market Composition (2026): Property & Room Types
Room Type Distribution
Property Type Distribution
Market Composition Insights for Isabela
- The Isabela Airbnb market composition is heavily skewed towards Entire Home/Apt listings, which make up 94.6% of the 616 active rentals. This indicates strong guest preference for privacy and space.
- Looking at the property type distribution in Isabela, Apartment/Condo properties are the most common (48.5%), reflecting the local real estate landscape.
- Houses represent a significant 37.8% portion, catering likely to families or larger groups.
- Smaller segments like outdoor/unique, unique stays, others (combined 8.6%) offer potential for unique stay experiences.
Isabela Airbnb Room Capacity Analysis (2026): Bedroom Distribution
Distribution of Listings by Number of Bedrooms
Room Capacity Insights for Isabela
- The dominant room capacity in Isabela is 1 bedroom listings, making up 34.3% of the market. This suggests a strong demand for properties suitable for couples or solo travelers.
- Together, 1 bedroom and 2 bedrooms properties represent 65.5% of the active Airbnb listings in Isabela, indicating a high concentration in these sizes.
- A significant 30.1% of listings offer 3+ bedrooms, catering to larger groups and families seeking more space in Isabela.
Isabela Vacation Rental Guest Capacity Trends (2026)
Distribution of Listings by Guest Capacity
Guest Capacity Insights for Isabela
- The most common guest capacity trend in Isabela vacation rentals is listings accommodating 4 guests (27.9%). This suggests the primary traveler segment is likely small families or groups.
- Properties designed for 4 guests and 2 guests dominate the Isabela STR market, accounting for 48.2% of listings.
- 40.6% of properties accommodate 6+ guests, serving the market segment for larger families or group travel in Isabela.
- On average, properties in Isabela are equipped to host 4.8 guests.
Isabela Airbnb Booking Patterns (2026): Available vs. Booked Days
Available Days Distribution
Booked Days Distribution
Booking Pattern Insights for Isabela
- The most common availability pattern in Isabela falls within the 181-270 days range, representing 39% of listings. This suggests many properties have significant open periods on their calendars.
- Approximately 75.4% of listings show high availability (181+ days open annually), indicating potential for increased bookings or specific owner usage patterns.
- For booked days, the 91-180 days range is most frequent in Isabela (40.7%), reflecting common guest stay durations or potential owner blocking patterns.
- A notable 25.8% of properties secure long booking periods (181+ days booked per year), highlighting successful long-term rental strategies or significant owner usage.
Isabela Airbnb Minimum Stay Requirements Analysis
Distribution of Listings by Minimum Night Requirement
1 Night
152 listings
24.7% of total
2 Nights
229 listings
37.2% of total
3 Nights
52 listings
8.4% of total
4-6 Nights
43 listings
7% of total
7-29 Nights
4 listings
0.6% of total
30+ Nights
136 listings
22.1% of total
Key Insights
- The most prevalent minimum stay requirement in Isabela is 2 Nights, adopted by 37.2% of listings. This highlights the market's preference for shorter, flexible bookings.
- A strong majority (61.9%) of the Isabela Airbnb data shows acceptance of very short stays (1-2 nights), indicating a dynamic, high-turnover market.
- A significant segment (22.1%) caters to monthly stays (30+ nights) in Isabela, pointing to opportunities in the extended-stay market.
Recommendations
- Align with the market by considering a 2 Nights minimum stay, as 37.2% of Isabela hosts use this setting.
- If feasible, allowing 1-night stays, especially midweek or during low season, could capture last-minute bookings, as only 24.7% currently do.
- Explore offering discounts for stays of 30+ nights to attract the 22.1% of the market seeking extended stays.
- Adjust minimum nights based on seasonality – potentially shorter during low season and longer during peak demand periods in Isabela.
Isabela Airbnb Cancellation Policy Trends Analysis (2026)
Limited
13 listings
2.1% of total
Super Strict 30 Days
1 listings
0.2% of total
Super Strict 60 Days
1 listings
0.2% of total
Flexible
118 listings
19.2% of total
Moderate
143 listings
23.3% of total
Firm
273 listings
44.5% of total
Strict
65 listings
10.6% of total
Cancellation Policy Insights for Isabela
- The prevailing Airbnb cancellation policy trend in Isabela is Firm, used by 44.5% of listings.
- A majority (55.1%) of hosts in Isabela utilize Firm or Strict policies, indicating a market where hosts prioritize booking security.
Recommendations for Hosts
- Consider adopting a Firm policy to align with the 44.5% market standard in Isabela.
- Using a Strict policy might deter some guests, as only 10.6% of listings use it. Evaluate if potential revenue protection outweighs possible lower booking rates.
- Regularly review your cancellation policy against competitors and market demand shifts in Isabela.
Isabela STR Booking Lead Time Analysis (2026)
Average Booking Lead Time by Month
Booking Lead Time Insights for Isabela
- The overall average booking lead time for vacation rentals in Isabela is 43 days.
- Guests book furthest in advance for stays during December (average 72 days), likely coinciding with peak travel demand or local events.
- The shortest booking windows occur for stays in September (average 28 days), indicating more last-minute travel plans during this time.
- Seasonally, Winter (58 days avg.) sees the longest lead times, while Spring (39 days avg.) has the shortest, reflecting typical travel planning cycles.
Recommendations for Hosts
- Use the overall average lead time (43 days) as a baseline for your pricing and availability strategy in Isabela.
- For December stays, consider implementing length-of-stay discounts or slightly higher rates for bookings made less than 72 days out to capitalize on advance planning.
- Target marketing efforts for the Winter season well in advance (at least 58 days) to capture early planners.
- Monitor your own booking lead times against these Isabela averages to identify opportunities for dynamic pricing adjustments.
Popular & Essential Airbnb Amenities in Isabela (2026)
Amenity Prevalence
Amenity Insights for Isabela
- Essential amenities in Isabela that guests expect include: Air conditioning, Wifi, TV, Free parking on premises. Lacking these (any) could significantly impact bookings.
- Popular amenities like Coffee maker, Hot water, Kitchen are common but not universal. Offering these can provide a competitive edge.
Recommendations for Hosts
- Ensure your listing includes all essential amenities for Isabela: Air conditioning, Wifi, TV, Free parking on premises.
- Prioritize adding missing essentials: Air conditioning, Wifi, TV, Free parking on premises.
- Consider adding popular differentiators like Coffee maker or Hot water to increase appeal.
- Highlight unique or less common amenities you offer (e.g., hot tub, dedicated workspace, EV charger) in your listing description and photos.
- Regularly check competitor amenities in Isabela to stay competitive.
Isabela Airbnb Guest Demographics & Profile Analysis (2026)
Guest Profile Summary for Isabela
- The typical guest profile for Airbnb in Isabela consists of primarily domestic travelers (67%), often arriving from nearby New York, typically belonging to the Post-2000s (Gen Z/Alpha) group (50%), primarily speaking English or Spanish.
- Domestic travelers account for 67.3% of guests.
- Key international markets include United States (67.3%) and Puerto Rico (29.1%).
- Top languages spoken are English (50.7%) followed by Spanish (41.5%).
- A significant demographic segment is the Post-2000s (Gen Z/Alpha) group, representing 50% of guests.
Recommendations for Hosts
- Target domestic marketing efforts towards travelers from New York and San Juan.
- Tailor amenities and listing descriptions to appeal to the dominant Post-2000s (Gen Z/Alpha) demographic (e.g., highlight fast WiFi, smart home features, local guides).
- Highlight unique local experiences or amenities relevant to the primary guest profile.
- Consider seasonal promotions aligned with peak travel times for key origin markets.
Nearby Short-Term Rental Market Comparison
How does the Isabela Airbnb market stack up against its neighbors? Compare key performance metrics like average monthly revenue, ADR, and occupancy rates in surrounding areas to understand the broader regional STR landscape.
| Market | Active Properties | Monthly Revenue | Daily Rate | Avg. Occupancy |
|---|---|---|---|---|
| Guánica | 16 | $6,050 | $468.80 | 33% |
| Sabana | 16 | $5,847 | $454.72 | 44% |
| Vega Alta | 78 | $4,082 | $336.12 | 46% |
| Dorado | 270 | $4,019 | $431.44 | 44% |
| Cayey | 40 | $3,836 | $255.45 | 49% |
| La Romana | 850 | $3,826 | $702.77 | 27% |
| Toa Alta | 15 | $3,687 | $299.01 | 45% |
| Dorado | 46 | $3,331 | $574.70 | 39% |
| Villalba | 13 | $3,224 | $204.61 | 54% |
| Naranjito | 11 | $3,135 | $265.77 | 45% |