Esperanza Airbnb Market Analysis 2026: Short Term Rental Data & Vacation Rental Statistics in Puerto Rico, United States
Is Airbnb profitable in Esperanza in 2026? Explore comprehensive Airbnb analytics for Esperanza, Puerto Rico, United States to uncover income potential. This 2026 STR market report for Esperanza, based on AirROI data from February 2025 to January 2026, reveals key trends in the niche market of 83 active listings.
Whether you're considering an Airbnb investment in Esperanza, optimizing your existing vacation rental, or exploring rental arbitrage opportunities, understanding the Esperanza Airbnb data is crucial. Leveraging the low regulation environment is key to maximizing your short term rental income potential. Let's dive into the specifics.
Key Esperanza Airbnb Performance Metrics Overview
Monthly Airbnb Revenue Variations & Income Potential in Esperanza (2026)
Understanding the monthly revenue variations for Airbnb listings in Esperanza is key to maximizing your short term rental income potential. Seasonality significantly impacts earnings. Our analysis, based on data from the past 12 months, shows that the peak revenue month for STRs in Esperanza is typically March, while September often presents the lowest earnings, highlighting opportunities for strategic pricing adjustments during shoulder and low seasons. Explore the typical Airbnb income in Esperanza across different performance tiers:
- Best-in-class properties (Top 10%) achieve $7,636+ monthly, often utilizing dynamic pricing and superior guest experiences.
- Strong performing properties (Top 25%) earn $4,703 or more, indicating effective management and desirable locations/amenities.
- Typical properties (Median) generate around $2,513 per month, representing the average market performance.
- Entry-level properties (Bottom 25%) see earnings around $1,318, often with potential for optimization.
Average Monthly Airbnb Earnings Trend in Esperanza
Esperanza Airbnb Occupancy Rate Trends (2026)
Maximize your bookings by understanding the Esperanza STR occupancy trends. Seasonal demand shifts significantly influence how often properties are booked. Typically, Februarysees the highest demand (peak season occupancy), while September experiences the lowest (low season). Effective strategies, like adjusting minimum stays or offering promotions, can boost occupancy during slower periods. Here's how different property tiers perform in Esperanza:
- Best-in-class properties (Top 10%) achieve 82%+ occupancy, indicating high desirability and potentially optimized availability.
- Strong performing properties (Top 25%) maintain 67% or higher occupancy, suggesting good market fit and guest satisfaction.
- Typical properties (Median) have an occupancy rate around 46%.
- Entry-level properties (Bottom 25%) average 27% occupancy, potentially facing higher vacancy.
Average Monthly Occupancy Rate Trend in Esperanza
Average Daily Rate (ADR) Airbnb Trends in Esperanza (2026)
Effective short term rental pricing strategy in Esperanza involves understanding monthly ADR fluctuations. The Average Daily Rate (ADR) for Airbnb in Esperanza typically peaks in January and dips lowest during September. Leveraging Airbnb dynamic pricing tools or strategies based on this seasonality can significantly boost revenue. Here's a look at the typical nightly rates achieved:
- Best-in-class properties (Top 10%) command rates of $497+ per night, often due to premium features or locations.
- Strong performing properties (Top 25%) achieve nightly rates of $283 or more.
- Typical properties (Median) charge around $182 per night.
- Entry-level properties (Bottom 25%) earn around $130 per night.
Average Daily Rate (ADR) Trend by Month in Esperanza
Get Live Esperanza Market Intelligence 👇

Explore Real-time Analytics
Airbnb Seasonality Analysis & Trends in Esperanza (2026)
Peak Season (March, February, April)
- Revenue averages $4,968 per month
- Occupancy rates average 67.3%
- Daily rates average $266
Shoulder Season
- Revenue averages $3,697 per month
- Occupancy maintains around 43.9%
- Daily rates hold near $267
Low Season (August, September, November)
- Revenue drops to average $2,611 per month
- Occupancy decreases to average 33.7%
- Daily rates adjust to average $252
Seasonality Insights for Esperanza
- The Airbnb seasonality in Esperanza shows highly seasonal trends requiring careful strategy. While the sections above show seasonal averages, it's also insightful to look at the extremes:
- During the high season, the absolute peak month showcases Esperanza's highest earning potential, with monthly revenues capable of climbing to $5,361, occupancy reaching a high of 71.0%, and ADRs peaking at $283.
- Conversely, the slowest single month of the year, typically falling within the low season, marks the market's lowest point. In this month, revenue might dip to $2,130, occupancy could drop to 29.9%, and ADRs may adjust down to $245.
- Understanding both the seasonal averages and these monthly peaks and troughs in revenue, occupancy, and ADR is crucial for maximizing your Airbnb profit potential in Esperanza.
Seasonal Strategies for Maximizing Profit
- Peak Season: Maximize revenue through premium pricing and potentially longer minimum stays. Ensure high availability.
- Low Season: Offer competitive pricing, special promotions (e.g., extended stay discounts), and flexible cancellation policies. Target off-season travelers like remote workers or budget-conscious guests.
- Shoulder Seasons: Implement dynamic pricing that balances peak and low rates. Target weekend travelers or specific events. Offer slightly more flexible terms than peak season.
- Regularly analyze your own performance against these Esperanza seasonality benchmarks and adjust your pricing and availability strategy accordingly.
Best Areas for Airbnb Investment in Esperanza (2026)
Exploring the top neighborhoods for short-term rentals in Esperanza? This section highlights key areas, outlining why they are attractive for hosts and guests, along with notable local attractions. Consider these locations based on your target guest profile and investment strategy.
| Neighborhood / Area | Why Host Here? (Target Guests & Appeal) | Key Attractions & Landmarks |
|---|---|---|
| Esperanza Beach | A beautiful beach area in Vieques, Puerto Rico, known for its stunning views and tranquil atmosphere. Perfect for tourists looking for relaxation and beach activities. | Esperanza Beach, Mosquito Pier, Bioluminescent Bay, Palomino Island, Snorkeling Tours |
| Cayo Blast | A popular destination for its picturesque beaches and marine life, attracting those seeking adventure and nature experiences. | Cayo Blast Beach, Wildlife Tours, Fishing Tours, Kayaking, Diving Spots |
| Isabel Segunda | The largest town in Vieques, offering local culture, restaurants, and shops. A great spot for guests wanting to experience Puerto Rican life. | Isabel Segunda Town Square, Local Cuisine, Art Galleries, Shopping, Cultural Events |
| Sun Bay Beach | A stunning beach known for its soft sand and clear waters, ideal for families and outdoor enthusiasts. Frequently visited by locals and tourists alike. | Sun Bay Beach, Hiking Trails, Camping Areas, Wildlife Viewing, Nearby Restaurants |
| Vieques National Wildlife Refuge | A national sanctuary that offers beautiful landscapes and the chance to see diverse wildlife. Perfect for eco-tourists and nature lovers. | Wildlife Trails, Beaches, Historic Sites, Bird Watching, Guided Tours |
| Puerto Ferro | A scenic area known for its historical significance and beautiful shorelines, appealing to both history buffs and beachgoers. | Puerto Ferro Beach, Historical Ruins, Scenic Trails, Local Flora and Fauna |
| Mosquito Bay | Famous for its bioluminescence, Mosquito Bay attracts many visitors at night to witness this natural wonder, making it a unique selling point for accommodations. | Mosquito Bay, Bioluminescence Tours, Kayaking, Night Tours, Local Legends |
| Red Beach (Playa Colorá) | Known for its vibrant red sand and picturesque views, this beach provides a unique experience for beach lovers and photographers. | Red Beach, Snorkeling, Scenic Views, Access to Local Flora, Relaxation Spots |
Understanding Airbnb License Requirements & STR Laws in Esperanza (2026)
While Esperanza, Puerto Rico, United States currently shows low STR regulations, specific Airbnb license requirements might still exist or change. Always verify the latest short term rental regulations and Airbnb license requirements directly with local government authorities for Esperanza to ensure full compliance before hosting.
(Source: AirROI data, 2026, finding no licensed listings among those analyzed)
Top Performing Airbnb Properties in Esperanza (2026)
Benchmark your potential! Explore examples of top-performing Airbnb properties in Esperanzabased on Trailing Twelve Month (TTM) revenue. Analyze their characteristics, revenue, occupancy rate, and ADR to understand what drives success in this market.
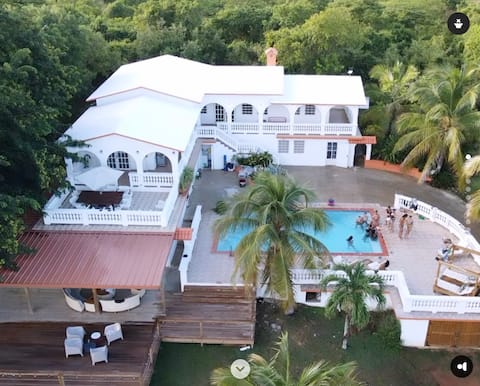
Hacienda Victoria Spanish Estate + Suites + Pool.
Entire Place • 6 bedrooms
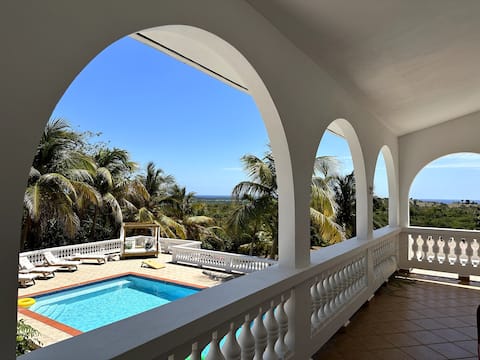
Hacienda Victoria, Spanish estate main villa.
Entire Place • 3 bedrooms

Meeshels Cabin at Finca Victoria
Private Room • 2 bedrooms

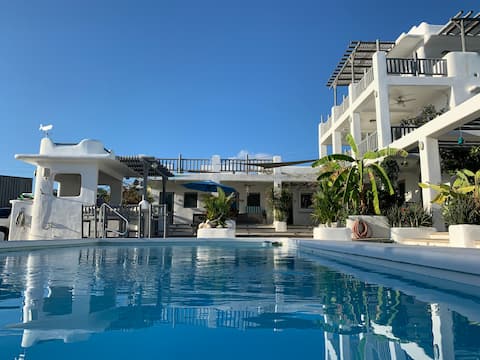
Casa Tesoro-pool home. Walk to beaches/restaurants
Entire Place • 3 bedrooms
Villa Casona Blanca, Green home with edible garden
Entire Place • 7 bedrooms

Oreanda – Casa Limon
Entire Place • 2 bedrooms
Note: Performance varies based on location, size, amenities, seasonality, and management quality. Data reflects the past 12 months.
Top Performing Airbnb Hosts in Esperanza (2026)
Learn from the best! This table showcases top-performing Airbnb hosts in Esperanza based on the number of properties managed and estimated total revenue over the past year. Analyze their scale and performance metrics.
| Host Name | Properties | Grossing Revenue | Stay Reviews | Avg Rating |
|---|---|---|---|---|
| Logan | 5 | $517,693 | 329 | 4.84/5.0 |
| Sylvia | 5 | $211,900 | 226 | 4.92/5.0 |
| Katherine | 4 | $154,264 | 113 | 4.99/5.0 |
| Stephanie | 2 | $132,210 | 289 | 4.92/5.0 |
| Clay | 1 | $104,565 | 134 | 4.99/5.0 |
| PR Short Rentals | 2 | $103,556 | 427 | 4.93/5.0 |
| Eva | 6 | $101,353 | 879 | 4.86/5.0 |
| Trade Winds | 8 | $97,720 | 1506 | 4.48/5.0 |
| Gaddiel | 1 | $97,048 | 23 | 4.96/5.0 |
| Jariel | 2 | $89,758 | 713 | 4.97/5.0 |
Analyzing the strategies of top hosts, such as their property selection, pricing, and guest communication, can offer valuable lessons for optimizing your own Airbnb operations in Esperanza.
Dive Deeper: Advanced Esperanza STR Market Data (2026)
Ready to unlock more insights? AirROI provides access to advanced metrics and comprehensive Airbnb data for Esperanza. Explore detailed analytics beyond this report to refine your investment strategy, optimize pricing, and maximize your vacation rental profits.
Explore Advanced MetricsEsperanza Short-Term Rental Market Composition (2026): Property & Room Types
Room Type Distribution
Property Type Distribution
Market Composition Insights for Esperanza
- The Esperanza Airbnb market composition is heavily skewed towards Entire Home/Apt listings, which make up 63.9% of the 83 active rentals. This indicates strong guest preference for privacy and space.
- However, a notable 36.1% share for Private Rooms suggests opportunities for budget-conscious travelers or hosts renting out spare rooms.
- Looking at the property type distribution in Esperanza, House properties are the most common (47%), reflecting the local real estate landscape.
- Houses represent a significant 47% portion, catering likely to families or larger groups.
- The presence of 33.7% Hotel/Boutique listings indicates integration with traditional hospitality.
- Smaller segments like unique stays, outdoor/unique, others (combined 7.2%) offer potential for unique stay experiences.
Esperanza Airbnb Room Capacity Analysis (2026): Bedroom Distribution
Distribution of Listings by Number of Bedrooms
Room Capacity Insights for Esperanza
- The dominant room capacity in Esperanza is 1 bedroom listings, making up 44.6% of the market. This suggests a strong demand for properties suitable for couples or solo travelers.
- Together, 1 bedroom and 2 bedrooms properties represent 66.3% of the active Airbnb listings in Esperanza, indicating a high concentration in these sizes.
- A significant 24.1% of listings offer 3+ bedrooms, catering to larger groups and families seeking more space in Esperanza.
Esperanza Vacation Rental Guest Capacity Trends (2026)
Distribution of Listings by Guest Capacity
Guest Capacity Insights for Esperanza
- The most common guest capacity trend in Esperanza vacation rentals is listings accommodating 2 guests (30.1%). This suggests the primary traveler segment is likely couples or solo travelers.
- Properties designed for 2 guests and 4 guests dominate the Esperanza STR market, accounting for 53.0% of listings.
- 31.3% of properties accommodate 6+ guests, serving the market segment for larger families or group travel in Esperanza.
- On average, properties in Esperanza are equipped to host 4.1 guests.
Esperanza Airbnb Booking Patterns (2026): Available vs. Booked Days
Available Days Distribution
Booked Days Distribution
Booking Pattern Insights for Esperanza
- The most common availability pattern in Esperanza falls within the 181-270 days range, representing 45.8% of listings. This suggests many properties have significant open periods on their calendars.
- Approximately 71.1% of listings show high availability (181+ days open annually), indicating potential for increased bookings or specific owner usage patterns.
- For booked days, the 91-180 days range is most frequent in Esperanza (47%), reflecting common guest stay durations or potential owner blocking patterns.
- A notable 30.1% of properties secure long booking periods (181+ days booked per year), highlighting successful long-term rental strategies or significant owner usage.
Esperanza Airbnb Minimum Stay Requirements Analysis
Distribution of Listings by Minimum Night Requirement
1 Night
25 listings
30.1% of total
2 Nights
16 listings
19.3% of total
3 Nights
7 listings
8.4% of total
4-6 Nights
5 listings
6% of total
7-29 Nights
1 listings
1.2% of total
30+ Nights
29 listings
34.9% of total
Key Insights
- The most prevalent minimum stay requirement in Esperanza is 30+ Nights, adopted by 34.9% of listings. This highlights the market's preference for longer commitments.
- A significant segment (34.9%) caters to monthly stays (30+ nights) in Esperanza, pointing to opportunities in the extended-stay market.
Recommendations
- Align with the market by considering a 30+ Nights minimum stay, as 34.9% of Esperanza hosts use this setting.
- Explore offering discounts for stays of 30+ nights to attract the 34.9% of the market seeking extended stays.
- Adjust minimum nights based on seasonality – potentially shorter during low season and longer during peak demand periods in Esperanza.
Esperanza Airbnb Cancellation Policy Trends Analysis (2026)
Limited
2 listings
2.4% of total
Super Strict 60 Days
1 listings
1.2% of total
Flexible
6 listings
7.2% of total
Moderate
22 listings
26.5% of total
Firm
28 listings
33.7% of total
Strict
24 listings
28.9% of total
Cancellation Policy Insights for Esperanza
- The prevailing Airbnb cancellation policy trend in Esperanza is Firm, used by 33.7% of listings.
- A majority (62.6%) of hosts in Esperanza utilize Firm or Strict policies, indicating a market where hosts prioritize booking security.
Recommendations for Hosts
- Consider adopting a Firm policy to align with the 33.7% market standard in Esperanza.
- Regularly review your cancellation policy against competitors and market demand shifts in Esperanza.
Esperanza STR Booking Lead Time Analysis (2026)
Average Booking Lead Time by Month
Booking Lead Time Insights for Esperanza
- The overall average booking lead time for vacation rentals in Esperanza is 65 days.
- Guests book furthest in advance for stays during January (average 91 days), likely coinciding with peak travel demand or local events.
- The shortest booking windows occur for stays in June (average 44 days), indicating more last-minute travel plans during this time.
- Seasonally, Winter (81 days avg.) sees the longest lead times, while Summer (47 days avg.) has the shortest, reflecting typical travel planning cycles.
Recommendations for Hosts
- Use the overall average lead time (65 days) as a baseline for your pricing and availability strategy in Esperanza.
- For January stays, consider implementing length-of-stay discounts or slightly higher rates for bookings made less than 91 days out to capitalize on advance planning.
- Target marketing efforts for the Winter season well in advance (at least 81 days) to capture early planners.
- Monitor your own booking lead times against these Esperanza averages to identify opportunities for dynamic pricing adjustments.
Popular & Essential Airbnb Amenities in Esperanza (2026)
Amenity Prevalence
Amenity Insights for Esperanza
- Essential amenities in Esperanza that guests expect include: Wifi, Hot water, Air conditioning. Lacking these (any) could significantly impact bookings.
- Popular amenities like Essentials, Patio or balcony, Free parking on premises are common but not universal. Offering these can provide a competitive edge.
Recommendations for Hosts
- Ensure your listing includes all essential amenities for Esperanza: Wifi, Hot water, Air conditioning.
- Prioritize adding missing essentials: Wifi, Hot water, Air conditioning.
- Consider adding popular differentiators like Essentials or Patio or balcony to increase appeal.
- Highlight unique or less common amenities you offer (e.g., hot tub, dedicated workspace, EV charger) in your listing description and photos.
- Regularly check competitor amenities in Esperanza to stay competitive.
Esperanza Airbnb Guest Demographics & Profile Analysis (2026)
Guest Profile Summary for Esperanza
- The typical guest profile for Airbnb in Esperanza consists of primarily domestic travelers (87%), often arriving from nearby New York, typically belonging to the Post-2000s (Gen Z/Alpha) group (50%), primarily speaking English or Spanish.
- Domestic travelers account for 86.9% of guests.
- Key international markets include United States (86.9%) and Puerto Rico (7.2%).
- Top languages spoken are English (54%) followed by Spanish (27.4%).
- A significant demographic segment is the Post-2000s (Gen Z/Alpha) group, representing 50% of guests.
Recommendations for Hosts
- Target domestic marketing efforts towards travelers from New York and San Juan.
- Tailor amenities and listing descriptions to appeal to the dominant Post-2000s (Gen Z/Alpha) demographic (e.g., highlight fast WiFi, smart home features, local guides).
- Highlight unique local experiences or amenities relevant to the primary guest profile.
- Consider seasonal promotions aligned with peak travel times for key origin markets.
Nearby Short-Term Rental Market Comparison
How does the Esperanza Airbnb market stack up against its neighbors? Compare key performance metrics like average monthly revenue, ADR, and occupancy rates in surrounding areas to understand the broader regional STR landscape.
| Market | Active Properties | Monthly Revenue | Daily Rate | Avg. Occupancy |
|---|---|---|---|---|
| Central | 15 | $7,894 | $1132.95 | 46% |
| Guánica | 16 | $6,050 | $468.80 | 33% |
| Cruz Bay | 399 | $6,017 | $618.02 | 46% |
| Sabana | 16 | $5,847 | $454.72 | 44% |
| Northside | 62 | $5,784 | $544.57 | 42% |
| Fortuna | 14 | $5,521 | $311.09 | 50% |
| Coral Harbour | 162 | $5,478 | $461.88 | 51% |
| Charlotte Amalie | 12 | $4,939 | $453.47 | 42% |
| Cruz Bay | 26 | $4,683 | $550.44 | 41% |
| Mameyes II | 17 | $4,242 | $349.18 | 48% |