Culebra Airbnb Market Analysis 2026: Short Term Rental Data & Vacation Rental Statistics in Puerto Rico, United States
Is Airbnb profitable in Culebra in 2026? Explore comprehensive Airbnb analytics for Culebra, Puerto Rico, United States to uncover income potential. This 2026 STR market report for Culebra, based on AirROI data from February 2025 to January 2026, reveals key trends in the market of 347 active listings.
Whether you're considering an Airbnb investment in Culebra, optimizing your existing vacation rental, or exploring rental arbitrage opportunities, understanding the Culebra Airbnb data is crucial. Leveraging the low regulation environment is key to maximizing your short term rental income potential. Let's dive into the specifics.
Key Culebra Airbnb Performance Metrics Overview
Monthly Airbnb Revenue Variations & Income Potential in Culebra (2026)
Understanding the monthly revenue variations for Airbnb listings in Culebra is key to maximizing your short term rental income potential. Seasonality significantly impacts earnings. Our analysis, based on data from the past 12 months, shows that the peak revenue month for STRs in Culebra is typically March, while September often presents the lowest earnings, highlighting opportunities for strategic pricing adjustments during shoulder and low seasons. Explore the typical Airbnb income in Culebra across different performance tiers:
- Best-in-class properties (Top 10%) achieve $7,174+ monthly, often utilizing dynamic pricing and superior guest experiences.
- Strong performing properties (Top 25%) earn $4,340 or more, indicating effective management and desirable locations/amenities.
- Typical properties (Median) generate around $2,337 per month, representing the average market performance.
- Entry-level properties (Bottom 25%) see earnings around $1,251, often with potential for optimization.
Average Monthly Airbnb Earnings Trend in Culebra
Culebra Airbnb Occupancy Rate Trends (2026)
Maximize your bookings by understanding the Culebra STR occupancy trends. Seasonal demand shifts significantly influence how often properties are booked. Typically, Marchsees the highest demand (peak season occupancy), while September experiences the lowest (low season). Effective strategies, like adjusting minimum stays or offering promotions, can boost occupancy during slower periods. Here's how different property tiers perform in Culebra:
- Best-in-class properties (Top 10%) achieve 79%+ occupancy, indicating high desirability and potentially optimized availability.
- Strong performing properties (Top 25%) maintain 63% or higher occupancy, suggesting good market fit and guest satisfaction.
- Typical properties (Median) have an occupancy rate around 43%.
- Entry-level properties (Bottom 25%) average 22% occupancy, potentially facing higher vacancy.
Average Monthly Occupancy Rate Trend in Culebra
Average Daily Rate (ADR) Airbnb Trends in Culebra (2026)
Effective short term rental pricing strategy in Culebra involves understanding monthly ADR fluctuations. The Average Daily Rate (ADR) for Airbnb in Culebra typically peaks in December and dips lowest during September. Leveraging Airbnb dynamic pricing tools or strategies based on this seasonality can significantly boost revenue. Here's a look at the typical nightly rates achieved:
- Best-in-class properties (Top 10%) command rates of $425+ per night, often due to premium features or locations.
- Strong performing properties (Top 25%) achieve nightly rates of $271 or more.
- Typical properties (Median) charge around $174 per night.
- Entry-level properties (Bottom 25%) earn around $136 per night.
Average Daily Rate (ADR) Trend by Month in Culebra
Get Live Culebra Market Intelligence 👇

Explore Real-time Analytics
Airbnb Seasonality Analysis & Trends in Culebra (2026)
Peak Season (March, July, February)
- Revenue averages $4,620 per month
- Occupancy rates average 58.2%
- Daily rates average $243
Shoulder Season
- Revenue averages $3,442 per month
- Occupancy maintains around 42.8%
- Daily rates hold near $247
Low Season (September, October, November)
- Revenue drops to average $2,625 per month
- Occupancy decreases to average 32.1%
- Daily rates adjust to average $240
Seasonality Insights for Culebra
- The Airbnb seasonality in Culebra shows highly seasonal trends requiring careful strategy. While the sections above show seasonal averages, it's also insightful to look at the extremes:
- During the high season, the absolute peak month showcases Culebra's highest earning potential, with monthly revenues capable of climbing to $4,955, occupancy reaching a high of 61.0%, and ADRs peaking at $257.
- Conversely, the slowest single month of the year, typically falling within the low season, marks the market's lowest point. In this month, revenue might dip to $2,305, occupancy could drop to 29.6%, and ADRs may adjust down to $238.
- Understanding both the seasonal averages and these monthly peaks and troughs in revenue, occupancy, and ADR is crucial for maximizing your Airbnb profit potential in Culebra.
Seasonal Strategies for Maximizing Profit
- Peak Season: Maximize revenue through premium pricing and potentially longer minimum stays. Ensure high availability.
- Low Season: Offer competitive pricing, special promotions (e.g., extended stay discounts), and flexible cancellation policies. Target off-season travelers like remote workers or budget-conscious guests.
- Shoulder Seasons: Implement dynamic pricing that balances peak and low rates. Target weekend travelers or specific events. Offer slightly more flexible terms than peak season.
- Regularly analyze your own performance against these Culebra seasonality benchmarks and adjust your pricing and availability strategy accordingly.
Best Areas for Airbnb Investment in Culebra (2026)
Exploring the top neighborhoods for short-term rentals in Culebra? This section highlights key areas, outlining why they are attractive for hosts and guests, along with notable local attractions. Consider these locations based on your target guest profile and investment strategy.
| Neighborhood / Area | Why Host Here? (Target Guests & Appeal) | Key Attractions & Landmarks |
|---|---|---|
| Flamenco Beach | Considered one of the most beautiful beaches in the world, Flamenco Beach is a prime spot for tourists seeking sun, sand, and sea. Its stunning turquoise waters make it a popular destination for beachgoers and water sports enthusiasts. | Flamenco Beach, Flamenco Lagoon, Snorkeling at the reef, Beachfront bars and restaurants, Sunrises and sunsets on the beach |
| Culebrita | A small uninhabited island off the coast of Culebra, Culebrita offers pristine beaches and nature trails. It's perfect for travelers looking for a secluded escape and beautiful natural landscapes. | Culebrita Beach, Turtle nesting sites, Hiking trails, Lighthouse observation area, Coral reef snorkeling |
| Carlos Rosario Beach | A quieter beach that's great for snorkeling and relaxing away from the crowds. This area attracts visitors looking for a more tranquil beach experience with beautiful scenery. | Carlos Rosario Beach, Snorkeling spots, Secluded swimming areas, Wildlife watching, Natural beach beauty |
| Dinghy Dock | A popular area for sailors and boating enthusiasts, Dinghy Dock is vibrant and full of life. It's a great spot for those looking to connect with the sailing community and enjoy waterfront dining. | Dinghy Dock restaurant, Boating and sailing, Marine activities, Fishing opportunities, Views of the harbor |
| La Chiva Beach | Known for its stunning views and colorful sunsets, La Chiva Beach is ideal for visitors wanting to experience Culebra's natural beauty. It’s less crowded, making it a perfect spot for relaxation. | La Chiva Beach, Sunset viewing, Bougainvillea flowers, Secluded picnic spots, Calm waters |
| Zoni Beach | A remote beach that offers a unique and pristine atmosphere, Zoni Beach attracts tourists looking to get away from the more populated areas of Culebra. | Zoni Beach, Natural tranquility, Beachcombing, Secluded picnic areas, Views of nearby islands |
| Culebra National Wildlife Refuge | This refuge protects the natural ecosystems of Culebra and attracts eco-tourists. It's ideal for those interested in hiking, bird watching, and experiencing biodiversity. | Wildlife observation, Nature trails, Unique ecosystems, Birdwatching opportunities, Educational tours |
| Town of Dewey | As the main town of Culebra, Dewey is bustling with local culture, shops, and eateries. It's an attractive location for tourists wanting to experience local life while still being close to beaches. | Local shops and restaurants, Culebra's history, Cultural experiences, Art galleries, Marina area |
Understanding Airbnb License Requirements & STR Laws in Culebra (2026)
While Culebra, Puerto Rico, United States currently shows low STR regulations, specific Airbnb license requirements might still exist or change. Always verify the latest short term rental regulations and Airbnb license requirements directly with local government authorities for Culebra to ensure full compliance before hosting.
(Source: AirROI data, 2026, finding no licensed listings among those analyzed)
Top Performing Airbnb Properties in Culebra (2026)
Benchmark your potential! Explore examples of top-performing Airbnb properties in Culebrabased on Trailing Twelve Month (TTM) revenue. Analyze their characteristics, revenue, occupancy rate, and ADR to understand what drives success in this market.
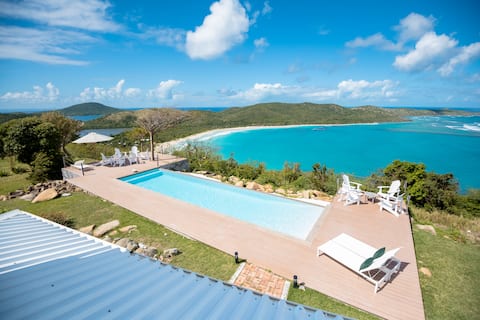
Oceanview Villa w. pool overlooking Flamenco
Entire Place • 3 bedrooms
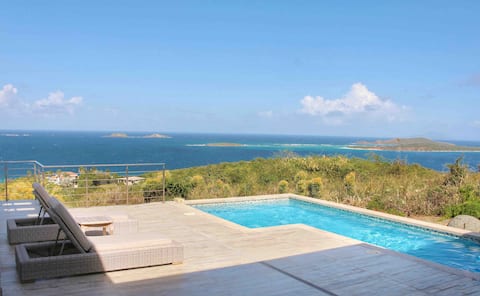
Casa Luar luxury Property, Heated Pool
Entire Place • 5 bedrooms

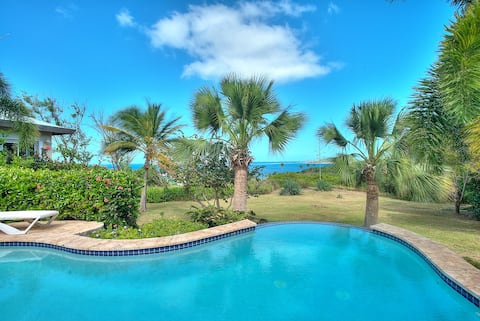
Culebra Sunrise - Villa del Alba (Villa of the Dawn)
Entire Place • 5 bedrooms

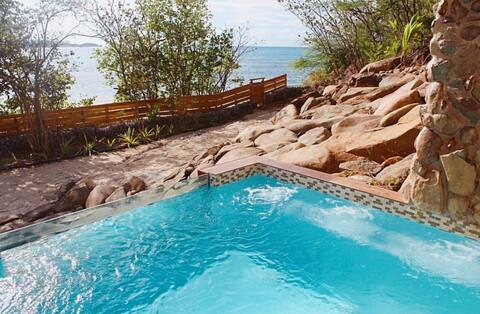
Beachfront retreat with heated pool @ Culebra
Entire Place • 5 bedrooms
Tropical villa overlooking Zoni beach
Entire Place • 4 bedrooms
Beachfront villa w. private pool at Flamenco Beach
Entire Place • 1 bedroom
Note: Performance varies based on location, size, amenities, seasonality, and management quality. Data reflects the past 12 months.
Top Performing Airbnb Hosts in Culebra (2026)
Learn from the best! This table showcases top-performing Airbnb hosts in Culebra based on the number of properties managed and estimated total revenue over the past year. Analyze their scale and performance metrics.
| Host Name | Properties | Grossing Revenue | Stay Reviews | Avg Rating |
|---|---|---|---|---|
| Meraki | 22 | $1,398,443 | 2537 | 4.65/5.0 |
| Roxana & Natalia By Roxco Mana | 5 | $1,107,730 | 362 | 4.98/5.0 |
| Paradise Island | 11 | $475,867 | 603 | 4.83/5.0 |
| Jim | 1 | $266,944 | 65 | 4.94/5.0 |
| Rafo | 1 | $261,719 | 72 | 4.96/5.0 |
| David & Christina | 3 | $257,739 | 30 | 4.70/5.0 |
| Kavita | 5 | $254,995 | 2209 | 4.89/5.0 |
| Ben | 2 | $248,679 | 91 | 4.98/5.0 |
| Norma | 9 | $240,012 | 1121 | 4.68/5.0 |
| Christian | 1 | $239,851 | 70 | 4.96/5.0 |
Analyzing the strategies of top hosts, such as their property selection, pricing, and guest communication, can offer valuable lessons for optimizing your own Airbnb operations in Culebra.
Dive Deeper: Advanced Culebra STR Market Data (2026)
Ready to unlock more insights? AirROI provides access to advanced metrics and comprehensive Airbnb data for Culebra. Explore detailed analytics beyond this report to refine your investment strategy, optimize pricing, and maximize your vacation rental profits.
Explore Advanced MetricsCulebra Short-Term Rental Market Composition (2026): Property & Room Types
Room Type Distribution
Property Type Distribution
Market Composition Insights for Culebra
- The Culebra Airbnb market composition is heavily skewed towards Entire Home/Apt listings, which make up 84.1% of the 347 active rentals. This indicates strong guest preference for privacy and space.
- Looking at the property type distribution in Culebra, Apartment/Condo properties are the most common (47.8%), reflecting the local real estate landscape.
- Houses represent a significant 36.9% portion, catering likely to families or larger groups.
- The presence of 10.7% Hotel/Boutique listings indicates integration with traditional hospitality.
- Smaller segments like outdoor/unique, others, unique stays (combined 4.6%) offer potential for unique stay experiences.
Culebra Airbnb Room Capacity Analysis (2026): Bedroom Distribution
Distribution of Listings by Number of Bedrooms
Room Capacity Insights for Culebra
- The dominant room capacity in Culebra is 1 bedroom listings, making up 50.7% of the market. This suggests a strong demand for properties suitable for couples or solo travelers.
- Together, 1 bedroom and 2 bedrooms properties represent 70.6% of the active Airbnb listings in Culebra, indicating a high concentration in these sizes.
- With over half the market (50.7%) consisting of studios or 1-bedroom units, Culebra is particularly well-suited for individuals or couples.
Culebra Vacation Rental Guest Capacity Trends (2026)
Distribution of Listings by Guest Capacity
Guest Capacity Insights for Culebra
- The most common guest capacity trend in Culebra vacation rentals is listings accommodating 4 guests (33.7%). This suggests the primary traveler segment is likely small families or groups.
- Properties designed for 4 guests and 2 guests dominate the Culebra STR market, accounting for 61.4% of listings.
- 23.3% of properties accommodate 6+ guests, serving the market segment for larger families or group travel in Culebra.
- On average, properties in Culebra are equipped to host 4.0 guests.
Culebra Airbnb Booking Patterns (2026): Available vs. Booked Days
Available Days Distribution
Booked Days Distribution
Booking Pattern Insights for Culebra
- The most common availability pattern in Culebra falls within the 271-366 days range, representing 34.3% of listings. This suggests many properties have significant open periods on their calendars.
- Approximately 68.6% of listings show high availability (181+ days open annually), indicating potential for increased bookings or specific owner usage patterns.
- For booked days, the 91-180 days range is most frequent in Culebra (36.3%), reflecting common guest stay durations or potential owner blocking patterns.
- A notable 32.0% of properties secure long booking periods (181+ days booked per year), highlighting successful long-term rental strategies or significant owner usage.
Culebra Airbnb Minimum Stay Requirements Analysis
Distribution of Listings by Minimum Night Requirement
1 Night
70 listings
20.2% of total
2 Nights
162 listings
46.7% of total
3 Nights
21 listings
6.1% of total
4-6 Nights
8 listings
2.3% of total
7-29 Nights
2 listings
0.6% of total
30+ Nights
84 listings
24.2% of total
Key Insights
- The most prevalent minimum stay requirement in Culebra is 2 Nights, adopted by 46.7% of listings. This highlights the market's preference for shorter, flexible bookings.
- A strong majority (66.9%) of the Culebra Airbnb data shows acceptance of very short stays (1-2 nights), indicating a dynamic, high-turnover market.
- A significant segment (24.2%) caters to monthly stays (30+ nights) in Culebra, pointing to opportunities in the extended-stay market.
Recommendations
- Align with the market by considering a 2 Nights minimum stay, as 46.7% of Culebra hosts use this setting.
- If feasible, allowing 1-night stays, especially midweek or during low season, could capture last-minute bookings, as only 20.2% currently do.
- Explore offering discounts for stays of 30+ nights to attract the 24.2% of the market seeking extended stays.
- Adjust minimum nights based on seasonality – potentially shorter during low season and longer during peak demand periods in Culebra.
Culebra Airbnb Cancellation Policy Trends Analysis (2026)
Limited
2 listings
0.6% of total
Super Strict 30 Days
11 listings
3.2% of total
Refundable
1 listings
0.3% of total
Flexible
49 listings
14.1% of total
Moderate
92 listings
26.5% of total
Firm
105 listings
30.3% of total
Strict
87 listings
25.1% of total
Cancellation Policy Insights for Culebra
- The prevailing Airbnb cancellation policy trend in Culebra is Firm, used by 30.3% of listings.
- A majority (55.4%) of hosts in Culebra utilize Firm or Strict policies, indicating a market where hosts prioritize booking security.
Recommendations for Hosts
- Consider adopting a Firm policy to align with the 30.3% market standard in Culebra.
- Regularly review your cancellation policy against competitors and market demand shifts in Culebra.
Culebra STR Booking Lead Time Analysis (2026)
Average Booking Lead Time by Month
Booking Lead Time Insights for Culebra
- The overall average booking lead time for vacation rentals in Culebra is 51 days.
- Guests book furthest in advance for stays during December (average 107 days), likely coinciding with peak travel demand or local events.
- The shortest booking windows occur for stays in September (average 36 days), indicating more last-minute travel plans during this time.
- Seasonally, Winter (75 days avg.) sees the longest lead times, while Spring (42 days avg.) has the shortest, reflecting typical travel planning cycles.
Recommendations for Hosts
- Use the overall average lead time (51 days) as a baseline for your pricing and availability strategy in Culebra.
- For December stays, consider implementing length-of-stay discounts or slightly higher rates for bookings made less than 107 days out to capitalize on advance planning.
- Target marketing efforts for the Winter season well in advance (at least 75 days) to capture early planners.
- Monitor your own booking lead times against these Culebra averages to identify opportunities for dynamic pricing adjustments.
Popular & Essential Airbnb Amenities in Culebra (2026)
Amenity Prevalence
Amenity Insights for Culebra
- Essential amenities in Culebra that guests expect include: Air conditioning. Lacking these (this) could significantly impact bookings.
- Popular amenities like Wifi, TV, Free parking on premises are common but not universal. Offering these can provide a competitive edge.
- Warning: Wifi is not universally provided but is considered essential globally. Ensure reliable Wifi is offered.
Recommendations for Hosts
- Ensure your listing includes all essential amenities for Culebra: Air conditioning.
- Prioritize adding missing essentials: Air conditioning.
- Consider adding popular differentiators like Wifi or TV to increase appeal.
- Highlight unique or less common amenities you offer (e.g., hot tub, dedicated workspace, EV charger) in your listing description and photos.
- Regularly check competitor amenities in Culebra to stay competitive.
Culebra Airbnb Guest Demographics & Profile Analysis (2026)
Guest Profile Summary for Culebra
- The typical guest profile for Airbnb in Culebra consists of primarily domestic travelers (73%), often arriving from nearby San Juan, typically belonging to the Post-2000s (Gen Z/Alpha) group (50%), primarily speaking English or Spanish.
- Domestic travelers account for 72.5% of guests.
- Key international markets include United States (72.5%) and Puerto Rico (21.2%).
- Top languages spoken are English (50.5%) followed by Spanish (36.8%).
- A significant demographic segment is the Post-2000s (Gen Z/Alpha) group, representing 50% of guests.
Recommendations for Hosts
- Target domestic marketing efforts towards travelers from San Juan and New York.
- Tailor amenities and listing descriptions to appeal to the dominant Post-2000s (Gen Z/Alpha) demographic (e.g., highlight fast WiFi, smart home features, local guides).
- Highlight unique local experiences or amenities relevant to the primary guest profile.
- Consider seasonal promotions aligned with peak travel times for key origin markets.
Nearby Short-Term Rental Market Comparison
How does the Culebra Airbnb market stack up against its neighbors? Compare key performance metrics like average monthly revenue, ADR, and occupancy rates in surrounding areas to understand the broader regional STR landscape.
| Market | Active Properties | Monthly Revenue | Daily Rate | Avg. Occupancy |
|---|---|---|---|---|
| Central | 15 | $7,894 | $1132.95 | 46% |
| Guánica | 16 | $6,050 | $468.80 | 33% |
| Cruz Bay | 399 | $6,017 | $618.02 | 46% |
| Sabana | 16 | $5,847 | $454.72 | 44% |
| Northside | 62 | $5,784 | $544.57 | 42% |
| Fortuna | 14 | $5,521 | $311.09 | 50% |
| Coral Harbour | 162 | $5,478 | $461.88 | 51% |
| Charlotte Amalie | 12 | $4,939 | $453.47 | 42% |
| Cruz Bay | 26 | $4,683 | $550.44 | 41% |
| Mameyes II | 17 | $4,242 | $349.18 | 48% |