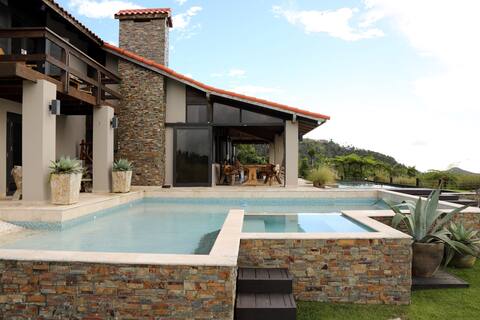
Cayey Airbnb Market Analysis 2026: Short Term Rental Data & Vacation Rental Statistics in Puerto Rico, United States
Is Airbnb profitable in Cayey in 2026? Explore comprehensive Airbnb analytics for Cayey, Puerto Rico, United States to uncover income potential. This 2026 STR market report for Cayey, based on AirROI data from February 2025 to January 2026, reveals key trends in the niche market of 40 active listings.
Whether you're considering an Airbnb investment in Cayey, optimizing your existing vacation rental, or exploring rental arbitrage opportunities, understanding the Cayey Airbnb data is crucial. Leveraging the low regulation environment is key to maximizing your short term rental income potential. Let's dive into the specifics.
Key Cayey Airbnb Performance Metrics Overview
Monthly Airbnb Revenue Variations & Income Potential in Cayey (2026)
Understanding the monthly revenue variations for Airbnb listings in Cayey is key to maximizing your short term rental income potential. Seasonality significantly impacts earnings. Our analysis, based on data from the past 12 months, shows that the peak revenue month for STRs in Cayey is typically March, while January often presents the lowest earnings, highlighting opportunities for strategic pricing adjustments during shoulder and low seasons. Explore the typical Airbnb income in Cayey across different performance tiers:
- Best-in-class properties (Top 10%) achieve $8,814+ monthly, often utilizing dynamic pricing and superior guest experiences.
- Strong performing properties (Top 25%) earn $6,185 or more, indicating effective management and desirable locations/amenities.
- Typical properties (Median) generate around $3,563 per month, representing the average market performance.
- Entry-level properties (Bottom 25%) see earnings around $1,227, often with potential for optimization.
Average Monthly Airbnb Earnings Trend in Cayey
Cayey Airbnb Occupancy Rate Trends (2026)
Maximize your bookings by understanding the Cayey STR occupancy trends. Seasonal demand shifts significantly influence how often properties are booked. Typically, Marchsees the highest demand (peak season occupancy), while January experiences the lowest (low season). Effective strategies, like adjusting minimum stays or offering promotions, can boost occupancy during slower periods. Here's how different property tiers perform in Cayey:
- Best-in-class properties (Top 10%) achieve 90%+ occupancy, indicating high desirability and potentially optimized availability.
- Strong performing properties (Top 25%) maintain 78% or higher occupancy, suggesting good market fit and guest satisfaction.
- Typical properties (Median) have an occupancy rate around 51%.
- Entry-level properties (Bottom 25%) average 24% occupancy, potentially facing higher vacancy.
Average Monthly Occupancy Rate Trend in Cayey
Average Daily Rate (ADR) Airbnb Trends in Cayey (2026)
Effective short term rental pricing strategy in Cayey involves understanding monthly ADR fluctuations. The Average Daily Rate (ADR) for Airbnb in Cayey typically peaks in December and dips lowest during April. Leveraging Airbnb dynamic pricing tools or strategies based on this seasonality can significantly boost revenue. Here's a look at the typical nightly rates achieved:
- Best-in-class properties (Top 10%) command rates of $404+ per night, often due to premium features or locations.
- Strong performing properties (Top 25%) achieve nightly rates of $293 or more.
- Typical properties (Median) charge around $198 per night.
- Entry-level properties (Bottom 25%) earn around $113 per night.
Average Daily Rate (ADR) Trend by Month in Cayey
Get Live Cayey Market Intelligence 👇

Explore Real-time Analytics
Airbnb Seasonality Analysis & Trends in Cayey (2026)
Peak Season (March, July, August)
- Revenue averages $4,868 per month
- Occupancy rates average 57.6%
- Daily rates average $224
Shoulder Season
- Revenue averages $4,292 per month
- Occupancy maintains around 49.5%
- Daily rates hold near $239
Low Season (January, May, September)
- Revenue drops to average $3,831 per month
- Occupancy decreases to average 47.4%
- Daily rates adjust to average $242
Seasonality Insights for Cayey
- The Airbnb seasonality in Cayey shows moderate seasonality with distinct peak and low periods. While the sections above show seasonal averages, it's also insightful to look at the extremes:
- During the high season, the absolute peak month showcases Cayey's highest earning potential, with monthly revenues capable of climbing to $5,399, occupancy reaching a high of 59.9%, and ADRs peaking at $258.
- Conversely, the slowest single month of the year, typically falling within the low season, marks the market's lowest point. In this month, revenue might dip to $3,530, occupancy could drop to 42.0%, and ADRs may adjust down to $215.
- Understanding both the seasonal averages and these monthly peaks and troughs in revenue, occupancy, and ADR is crucial for maximizing your Airbnb profit potential in Cayey.
Seasonal Strategies for Maximizing Profit
- Peak Season: Maximize revenue through premium pricing and potentially longer minimum stays. Ensure high availability.
- Low Season: Offer competitive pricing, special promotions (e.g., extended stay discounts), and flexible cancellation policies. Target off-season travelers like remote workers or budget-conscious guests.
- Shoulder Seasons: Implement dynamic pricing that balances peak and low rates. Target weekend travelers or specific events. Offer slightly more flexible terms than peak season.
- Regularly analyze your own performance against these Cayey seasonality benchmarks and adjust your pricing and availability strategy accordingly.
Best Areas for Airbnb Investment in Cayey (2026)
Exploring the top neighborhoods for short-term rentals in Cayey? This section highlights key areas, outlining why they are attractive for hosts and guests, along with notable local attractions. Consider these locations based on your target guest profile and investment strategy.
| Neighborhood / Area | Why Host Here? (Target Guests & Appeal) | Key Attractions & Landmarks |
|---|---|---|
| Cayey Town | The heart of Cayey, offering a mix of local culture and accessibility. Great for travelers looking to explore authentic Puerto Rican life and community. | Cayey Historic District, Plaza de Cayey, Museo de los Caudillos, Cayey River, Parque Julia de Burgos |
| La Ruta del Lechón | Known for its famous lechón (roast pork) eateries, this route attracts food enthusiasts and is a popular destination for local food tourism. | Lechonera Los Pinos, Lechonera Casa de Lechon, Cultural food festivals, Scenic views of the mountains |
| Cerro de Punta | The highest peak in Puerto Rico, attracting hikers and nature lovers. Offers stunning views and opportunities for eco-tourism. | Cerro de Punta, Toro Negro Forest, Hiking trails, Scenic lookout points |
| Bosque Estatal de Carite | A dense forest area with rich biodiversity, perfect for nature enthusiasts and those looking for a peaceful retreat away from the city. | Hiking trails, Bird watching, Scenic picnic areas, Nature tours |
| Finca de Café | Coffee farms near Cayey offer unique experiences for coffee lovers, including tours and tastings. Ideal for experiential stays. | Coffee tours, Tasting experiences, Coffee plantations, Cultural immersion |
| Cerro Maravilla | Famous for its scenic beauty and historical significance. Appeals to history buffs and those looking for picturesque landscapes. | Historical sites, Scenic views, Nature walks |
| Parque de los Niños | A family-friendly park in Cayey, perfect for families traveling with children. Offers recreational activities and green spaces. | Playgrounds, Sports facilities, Picnic areas |
| Cayey Waterfalls | A natural attraction with beautiful waterfalls, ideal for hiking and enjoying nature. Popular with outdoor enthusiasts. | Hiking to waterfalls, Swimming spots, Natural pools |
Understanding Airbnb License Requirements & STR Laws in Cayey (2026)
While Cayey, Puerto Rico, United States currently shows low STR regulations, specific Airbnb license requirements might still exist or change. Always verify the latest short term rental regulations and Airbnb license requirements directly with local government authorities for Cayey to ensure full compliance before hosting.
(Source: AirROI data, 2026, finding no licensed listings among those analyzed)
Top Performing Airbnb Properties in Cayey (2026)
Benchmark your potential! Explore examples of top-performing Airbnb properties in Cayeybased on Trailing Twelve Month (TTM) revenue. Analyze their characteristics, revenue, occupancy rate, and ADR to understand what drives success in this market.
CASAMERICA - Luxury Private Villa
Entire Place • 4 bedrooms
El Pretexto: Villa 1C
Entire Place • 1 bedroom

Escape Puerto Rico | Luxury Dome + Pool + Views
Entire Place • 1 bedroom

El Pretexto: Villa 2C
Entire Place • 2 bedrooms
Blessed Paradise (Country House)
Entire Place • 2 bedrooms

Mountain Retreat • Private Pool • Nature + Peace
Entire Place • 2 bedrooms
Note: Performance varies based on location, size, amenities, seasonality, and management quality. Data reflects the past 12 months.
Top Performing Airbnb Hosts in Cayey (2026)
Learn from the best! This table showcases top-performing Airbnb hosts in Cayey based on the number of properties managed and estimated total revenue over the past year. Analyze their scale and performance metrics.
| Host Name | Properties | Grossing Revenue | Stay Reviews | Avg Rating |
|---|---|---|---|---|
| Crystal | 4 | $371,445 | 604 | 4.98/5.0 |
| Alexander | 1 | $200,248 | 201 | 4.91/5.0 |
| Robert | 2 | $137,423 | 593 | 4.90/5.0 |
| Alexandra | 1 | $114,545 | 573 | 4.99/5.0 |
| Mayra | 1 | $92,339 | 102 | 4.91/5.0 |
| Edgardo | 1 | $82,640 | 132 | 4.98/5.0 |
| Marilyn | 1 | $76,468 | 197 | 4.87/5.0 |
| Abdiel | 1 | $65,702 | 229 | 4.92/5.0 |
| Kiara | 1 | $59,707 | 230 | 4.94/5.0 |
| Fernando | 1 | $59,487 | 108 | 4.67/5.0 |
Analyzing the strategies of top hosts, such as their property selection, pricing, and guest communication, can offer valuable lessons for optimizing your own Airbnb operations in Cayey.
Dive Deeper: Advanced Cayey STR Market Data (2026)
Ready to unlock more insights? AirROI provides access to advanced metrics and comprehensive Airbnb data for Cayey. Explore detailed analytics beyond this report to refine your investment strategy, optimize pricing, and maximize your vacation rental profits.
Explore Advanced MetricsCayey Short-Term Rental Market Composition (2026): Property & Room Types
Room Type Distribution
Property Type Distribution
Market Composition Insights for Cayey
- The Cayey Airbnb market composition is heavily skewed towards Entire Home/Apt listings, which make up 95% of the 40 active rentals. This indicates strong guest preference for privacy and space.
- Looking at the property type distribution in Cayey, House properties are the most common (57.5%), reflecting the local real estate landscape.
- Houses represent a significant 57.5% portion, catering likely to families or larger groups.
- Smaller segments like others, hotel/boutique (combined 5.0%) offer potential for unique stay experiences.
Cayey Airbnb Room Capacity Analysis (2026): Bedroom Distribution
Distribution of Listings by Number of Bedrooms
Room Capacity Insights for Cayey
- The dominant room capacity in Cayey is 1 bedroom listings, making up 37.5% of the market. This suggests a strong demand for properties suitable for couples or solo travelers.
- Together, 1 bedroom and 2 bedrooms properties represent 67.5% of the active Airbnb listings in Cayey, indicating a high concentration in these sizes.
- A significant 27.5% of listings offer 3+ bedrooms, catering to larger groups and families seeking more space in Cayey.
Cayey Vacation Rental Guest Capacity Trends (2026)
Distribution of Listings by Guest Capacity
Guest Capacity Insights for Cayey
- The most common guest capacity trend in Cayey vacation rentals is listings accommodating 2 guests (30%). This suggests the primary traveler segment is likely couples or solo travelers.
- Properties designed for 2 guests and 8+ guests dominate the Cayey STR market, accounting for 52.5% of listings.
- 37.5% of properties accommodate 6+ guests, serving the market segment for larger families or group travel in Cayey.
- On average, properties in Cayey are equipped to host 4.5 guests.
Cayey Airbnb Booking Patterns (2026): Available vs. Booked Days
Available Days Distribution
Booked Days Distribution
Booking Pattern Insights for Cayey
- The most common availability pattern in Cayey falls within the 181-270 days range, representing 32.5% of listings. This suggests many properties have significant open periods on their calendars.
- Approximately 60.0% of listings show high availability (181+ days open annually), indicating potential for increased bookings or specific owner usage patterns.
- For booked days, the 91-180 days range is most frequent in Cayey (30%), reflecting common guest stay durations or potential owner blocking patterns.
- A notable 42.5% of properties secure long booking periods (181+ days booked per year), highlighting successful long-term rental strategies or significant owner usage.
Cayey Airbnb Minimum Stay Requirements Analysis
Distribution of Listings by Minimum Night Requirement
1 Night
13 listings
32.5% of total
2 Nights
16 listings
40% of total
3 Nights
4 listings
10% of total
30+ Nights
7 listings
17.5% of total
Key Insights
- The most prevalent minimum stay requirement in Cayey is 2 Nights, adopted by 40% of listings. This highlights the market's preference for shorter, flexible bookings.
- A strong majority (72.5%) of the Cayey Airbnb data shows acceptance of very short stays (1-2 nights), indicating a dynamic, high-turnover market.
- A significant segment (17.5%) caters to monthly stays (30+ nights) in Cayey, pointing to opportunities in the extended-stay market.
Recommendations
- Align with the market by considering a 2 Nights minimum stay, as 40% of Cayey hosts use this setting.
- Explore offering discounts for stays of 30+ nights to attract the 17.5% of the market seeking extended stays.
- Adjust minimum nights based on seasonality – potentially shorter during low season and longer during peak demand periods in Cayey.
Cayey Airbnb Cancellation Policy Trends Analysis (2026)
Flexible
5 listings
12.5% of total
Moderate
16 listings
40% of total
Firm
12 listings
30% of total
Strict
7 listings
17.5% of total
Cancellation Policy Insights for Cayey
- The prevailing Airbnb cancellation policy trend in Cayey is Moderate, used by 40% of listings.
- There's a relatively balanced mix between guest-friendly (52.5%) and stricter (47.5%) policies, offering choices for different guest needs.
Recommendations for Hosts
- Consider adopting a Moderate policy to align with the 40% market standard in Cayey.
- Regularly review your cancellation policy against competitors and market demand shifts in Cayey.
Cayey STR Booking Lead Time Analysis (2026)
Average Booking Lead Time by Month
Booking Lead Time Insights for Cayey
- The overall average booking lead time for vacation rentals in Cayey is 48 days.
- Guests book furthest in advance for stays during December (average 69 days), likely coinciding with peak travel demand or local events.
- The shortest booking windows occur for stays in March (average 40 days), indicating more last-minute travel plans during this time.
- Seasonally, Summer (55 days avg.) sees the longest lead times, while Spring (48 days avg.) has the shortest, reflecting typical travel planning cycles.
Recommendations for Hosts
- Use the overall average lead time (48 days) as a baseline for your pricing and availability strategy in Cayey.
- For December stays, consider implementing length-of-stay discounts or slightly higher rates for bookings made less than 69 days out to capitalize on advance planning.
- Target marketing efforts for the Summer season well in advance (at least 55 days) to capture early planners.
- Monitor your own booking lead times against these Cayey averages to identify opportunities for dynamic pricing adjustments.
Popular & Essential Airbnb Amenities in Cayey (2026)
Amenity Prevalence
Amenity Insights for Cayey
- Essential amenities in Cayey that guests expect include: Free parking on premises, Wifi, Hot water. Lacking these (any) could significantly impact bookings.
- Popular amenities like Dishes and silverware, Air conditioning, Kitchen are common but not universal. Offering these can provide a competitive edge.
Recommendations for Hosts
- Ensure your listing includes all essential amenities for Cayey: Free parking on premises, Wifi, Hot water.
- Prioritize adding missing essentials: Free parking on premises, Wifi, Hot water.
- Consider adding popular differentiators like Dishes and silverware or Air conditioning to increase appeal.
- Highlight unique or less common amenities you offer (e.g., hot tub, dedicated workspace, EV charger) in your listing description and photos.
- Regularly check competitor amenities in Cayey to stay competitive.
Cayey Airbnb Guest Demographics & Profile Analysis (2026)
Guest Profile Summary for Cayey
- The typical guest profile for Airbnb in Cayey consists of a mix of domestic (64%) and international guests, often arriving from nearby San Juan, typically belonging to the Post-2000s (Gen Z/Alpha) group (50%), primarily speaking English or Spanish.
- Domestic travelers account for 64.4% of guests.
- Key international markets include United States (64.4%) and Puerto Rico (31.6%).
- Top languages spoken are English (52.6%) followed by Spanish (41.5%).
- A significant demographic segment is the Post-2000s (Gen Z/Alpha) group, representing 50% of guests.
Recommendations for Hosts
- Target domestic marketing efforts towards travelers from San Juan and New York.
- Tailor amenities and listing descriptions to appeal to the dominant Post-2000s (Gen Z/Alpha) demographic (e.g., highlight fast WiFi, smart home features, local guides).
- Highlight unique local experiences or amenities relevant to the primary guest profile.
- Consider seasonal promotions aligned with peak travel times for key origin markets.
Nearby Short-Term Rental Market Comparison
How does the Cayey Airbnb market stack up against its neighbors? Compare key performance metrics like average monthly revenue, ADR, and occupancy rates in surrounding areas to understand the broader regional STR landscape.
| Market | Active Properties | Monthly Revenue | Daily Rate | Avg. Occupancy |
|---|---|---|---|---|
| Guánica | 16 | $6,050 | $468.80 | 33% |
| Sabana | 16 | $5,847 | $454.72 | 44% |
| Fortuna | 14 | $5,521 | $311.09 | 50% |
| Mameyes II | 17 | $4,242 | $349.18 | 48% |
| Vega Alta | 78 | $4,082 | $336.12 | 46% |
| Río Grande | 100 | $4,068 | $457.29 | 44% |
| Río Grande | 609 | $4,033 | $368.55 | 43% |
| Dorado | 270 | $4,019 | $431.44 | 44% |
| Playa Fortuna | 14 | $3,994 | $256.75 | 49% |
| Isabel Segunda | 237 | $3,740 | $319.74 | 45% |