Bayamón Airbnb Market Analysis 2026: Short Term Rental Data & Vacation Rental Statistics in Puerto Rico, United States
Is Airbnb profitable in Bayamón in 2026? Explore comprehensive Airbnb analytics for Bayamón, Puerto Rico, United States to uncover income potential. This 2026 STR market report for Bayamón, based on AirROI data from February 2025 to January 2026, reveals key trends in the niche market of 113 active listings.
Whether you're considering an Airbnb investment in Bayamón, optimizing your existing vacation rental, or exploring rental arbitrage opportunities, understanding the Bayamón Airbnb data is crucial. Leveraging the low regulation environment is key to maximizing your short term rental income potential. Let's dive into the specifics.
Key Bayamón Airbnb Performance Metrics Overview
Monthly Airbnb Revenue Variations & Income Potential in Bayamón (2026)
Understanding the monthly revenue variations for Airbnb listings in Bayamón is key to maximizing your short term rental income potential. Seasonality significantly impacts earnings. Our analysis, based on data from the past 12 months, shows that the peak revenue month for STRs in Bayamón is typically August, while October often presents the lowest earnings, highlighting opportunities for strategic pricing adjustments during shoulder and low seasons. Explore the typical Airbnb income in Bayamón across different performance tiers:
- Best-in-class properties (Top 10%) achieve $4,640+ monthly, often utilizing dynamic pricing and superior guest experiences.
- Strong performing properties (Top 25%) earn $2,808 or more, indicating effective management and desirable locations/amenities.
- Typical properties (Median) generate around $1,748 per month, representing the average market performance.
- Entry-level properties (Bottom 25%) see earnings around $1,019, often with potential for optimization.
Average Monthly Airbnb Earnings Trend in Bayamón
Bayamón Airbnb Occupancy Rate Trends (2026)
Maximize your bookings by understanding the Bayamón STR occupancy trends. Seasonal demand shifts significantly influence how often properties are booked. Typically, Marchsees the highest demand (peak season occupancy), while October experiences the lowest (low season). Effective strategies, like adjusting minimum stays or offering promotions, can boost occupancy during slower periods. Here's how different property tiers perform in Bayamón:
- Best-in-class properties (Top 10%) achieve 88%+ occupancy, indicating high desirability and potentially optimized availability.
- Strong performing properties (Top 25%) maintain 76% or higher occupancy, suggesting good market fit and guest satisfaction.
- Typical properties (Median) have an occupancy rate around 55%.
- Entry-level properties (Bottom 25%) average 32% occupancy, potentially facing higher vacancy.
Average Monthly Occupancy Rate Trend in Bayamón
Average Daily Rate (ADR) Airbnb Trends in Bayamón (2026)
Effective short term rental pricing strategy in Bayamón involves understanding monthly ADR fluctuations. The Average Daily Rate (ADR) for Airbnb in Bayamón typically peaks in July and dips lowest during February. Leveraging Airbnb dynamic pricing tools or strategies based on this seasonality can significantly boost revenue. Here's a look at the typical nightly rates achieved:
- Best-in-class properties (Top 10%) command rates of $263+ per night, often due to premium features or locations.
- Strong performing properties (Top 25%) achieve nightly rates of $156 or more.
- Typical properties (Median) charge around $108 per night.
- Entry-level properties (Bottom 25%) earn around $83 per night.
Average Daily Rate (ADR) Trend by Month in Bayamón
Get Live Bayamón Market Intelligence 👇

Explore Real-time Analytics
Airbnb Seasonality Analysis & Trends in Bayamón (2026)
Peak Season (August, July, March)
- Revenue averages $2,791 per month
- Occupancy rates average 63.4%
- Daily rates average $149
Shoulder Season
- Revenue averages $2,228 per month
- Occupancy maintains around 53.3%
- Daily rates hold near $143
Low Season (September, October, November)
- Revenue drops to average $1,814 per month
- Occupancy decreases to average 44.1%
- Daily rates adjust to average $142
Seasonality Insights for Bayamón
- The Airbnb seasonality in Bayamón shows moderate seasonality with distinct peak and low periods. While the sections above show seasonal averages, it's also insightful to look at the extremes:
- During the high season, the absolute peak month showcases Bayamón's highest earning potential, with monthly revenues capable of climbing to $2,861, occupancy reaching a high of 68.0%, and ADRs peaking at $155.
- Conversely, the slowest single month of the year, typically falling within the low season, marks the market's lowest point. In this month, revenue might dip to $1,653, occupancy could drop to 39.4%, and ADRs may adjust down to $139.
- Understanding both the seasonal averages and these monthly peaks and troughs in revenue, occupancy, and ADR is crucial for maximizing your Airbnb profit potential in Bayamón.
Seasonal Strategies for Maximizing Profit
- Peak Season: Maximize revenue through premium pricing and potentially longer minimum stays. Ensure high availability.
- Low Season: Offer competitive pricing, special promotions (e.g., extended stay discounts), and flexible cancellation policies. Target off-season travelers like remote workers or budget-conscious guests.
- Shoulder Seasons: Implement dynamic pricing that balances peak and low rates. Target weekend travelers or specific events. Offer slightly more flexible terms than peak season.
- Regularly analyze your own performance against these Bayamón seasonality benchmarks and adjust your pricing and availability strategy accordingly.
Best Areas for Airbnb Investment in Bayamón (2026)
Exploring the top neighborhoods for short-term rentals in Bayamón? This section highlights key areas, outlining why they are attractive for hosts and guests, along with notable local attractions. Consider these locations based on your target guest profile and investment strategy.
| Neighborhood / Area | Why Host Here? (Target Guests & Appeal) | Key Attractions & Landmarks |
|---|---|---|
| Bayamón Centro | The vibrant downtown area is rich in local culture, restaurants, and nightlife. It attracts both locals and visitors looking for an authentic Puerto Rican experience. | Plaza del Valle, Museo del Deporte, Iglesia San Antonio de Padua, Parque de las Ciencias, Restaurantes Típicos |
| Bayamón Golf Course | This area offers access to beautiful green spaces and recreational activities, appealing to golf enthusiasts and families. | Bayamón Golf Course, Parque de las Ciencias, Café Bayamón |
| Tropical Plaza | A shopping and entertainment hub with a variety of dining and shopping options, ideal for tourists looking for convenience. | Tropical Plaza, Cine Vista Bayamón, Supermercados |
| Hato Tejas | A residential neighborhood with a local vibe, close to amenities and services. It’s attractive for longer stays for families or business travelers. | Parque de la Ciudad, Iglesia Santa Cruz, Playa de Bayamón |
| Caguas Avenue | A major thoroughfare with easy access to Bayamón and San Juan, making it convenient for travelers who want to explore both cities. | Centro Comercial Bayá, Cafeterías, Salas de entretenimiento |
| Calle San Jose | This street is known for its historical significance and charm, making it a unique place for visitors who want to experience the culture of Bayamón. | Casa de la Cultura, Galería de Arte de Bayamón, Historia de Bayamón |
| La Libertad | A neighborhood with a mix of residential and commercial properties, attracting families and business professionals. It offers a unique glimpse into the everyday life of Bayamón residents. | Parque Urbano, Biblioteca Municipal, Mercados Locales |
| Su Municipio | An area featuring government buildings and public parks, showcasing the civic life of Bayamón. It's an ideal location for travelers interested in local governance and community events. | Centro de Bellas Artes, Municipio de Bayamón, Actividades Culturales |
Understanding Airbnb License Requirements & STR Laws in Bayamón (2026)
While Bayamón, Puerto Rico, United States currently shows low STR regulations, specific Airbnb license requirements might still exist or change. Always verify the latest short term rental regulations and Airbnb license requirements directly with local government authorities for Bayamón to ensure full compliance before hosting.
(Source: AirROI data, 2026, finding no licensed listings among those analyzed)
Top Performing Airbnb Properties in Bayamón (2026)
Benchmark your potential! Explore examples of top-performing Airbnb properties in Bayamónbased on Trailing Twelve Month (TTM) revenue. Analyze their characteristics, revenue, occupancy rate, and ADR to understand what drives success in this market.
Casalta: A Unique Villa Experience in Puerto Rico
Entire Place • 5 bedrooms
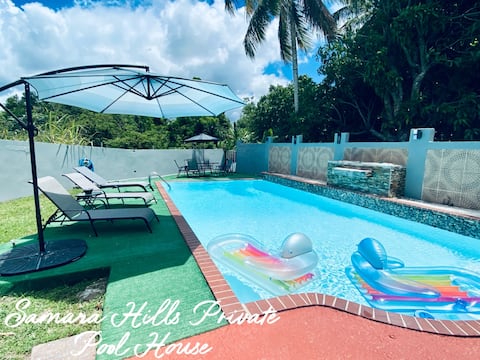
Samara Hills Private Pool House
Entire Place • 3 bedrooms

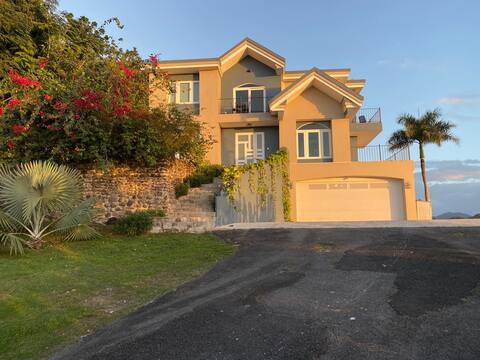
Cassablanca On The Hill: Pool & Amazing Views
Entire Place • 2 bedrooms
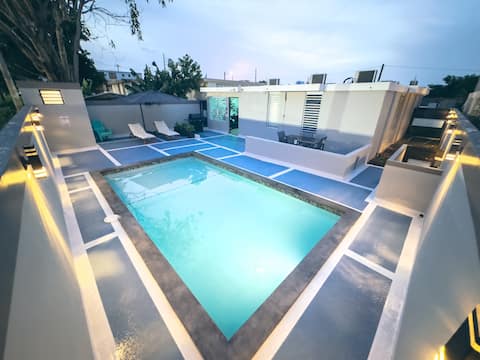
House, Private Pool, Barbecue, Wi-Fi, Laundry.
Entire Place • 4 bedrooms

Prestine and Modern home w/ office - 30 min SJU
Entire Place • 4 bedrooms

Green Sunset Dome
Entire Place • 1 bedroom
Note: Performance varies based on location, size, amenities, seasonality, and management quality. Data reflects the past 12 months.
Top Performing Airbnb Hosts in Bayamón (2026)
Learn from the best! This table showcases top-performing Airbnb hosts in Bayamón based on the number of properties managed and estimated total revenue over the past year. Analyze their scale and performance metrics.
| Host Name | Properties | Grossing Revenue | Stay Reviews | Avg Rating |
|---|---|---|---|---|
| Venvenido Spaces | 2 | $126,443 | 114 | 4.82/5.0 |
| Antonio Dario | 1 | $111,261 | 175 | 4.95/5.0 |
| Adelina | 1 | $109,475 | 58 | 4.90/5.0 |
| Yohandra | 3 | $93,739 | 25 | 5.00/5.0 |
| Jose | 3 | $82,173 | 503 | 4.86/5.0 |
| Joan M | 4 | $81,666 | 323 | 4.99/5.0 |
| Glamor Inc | 1 | $76,433 | 43 | 4.58/5.0 |
| Jan | 1 | $67,270 | 117 | 4.83/5.0 |
| Javier | 3 | $65,986 | 467 | 4.91/5.0 |
| Mirelys | 1 | $65,873 | 124 | 4.98/5.0 |
Analyzing the strategies of top hosts, such as their property selection, pricing, and guest communication, can offer valuable lessons for optimizing your own Airbnb operations in Bayamón.
Dive Deeper: Advanced Bayamón STR Market Data (2026)
Ready to unlock more insights? AirROI provides access to advanced metrics and comprehensive Airbnb data for Bayamón. Explore detailed analytics beyond this report to refine your investment strategy, optimize pricing, and maximize your vacation rental profits.
Explore Advanced MetricsBayamón Short-Term Rental Market Composition (2026): Property & Room Types
Room Type Distribution
Property Type Distribution
Market Composition Insights for Bayamón
- The Bayamón Airbnb market composition is heavily skewed towards Entire Home/Apt listings, which make up 92% of the 113 active rentals. This indicates strong guest preference for privacy and space.
- Looking at the property type distribution in Bayamón, Apartment/Condo properties are the most common (48.7%), reflecting the local real estate landscape.
- Houses represent a significant 41.6% portion, catering likely to families or larger groups.
- Smaller segments like others, hotel/boutique, outdoor/unique, unique stays (combined 9.7%) offer potential for unique stay experiences.
Bayamón Airbnb Room Capacity Analysis (2026): Bedroom Distribution
Distribution of Listings by Number of Bedrooms
Room Capacity Insights for Bayamón
- The dominant room capacity in Bayamón is 1 bedroom listings, making up 36.3% of the market. This suggests a strong demand for properties suitable for couples or solo travelers.
- Together, 1 bedroom and 2 bedrooms properties represent 63.7% of the active Airbnb listings in Bayamón, indicating a high concentration in these sizes.
- A significant 30.1% of listings offer 3+ bedrooms, catering to larger groups and families seeking more space in Bayamón.
Bayamón Vacation Rental Guest Capacity Trends (2026)
Distribution of Listings by Guest Capacity
Guest Capacity Insights for Bayamón
- The most common guest capacity trend in Bayamón vacation rentals is listings accommodating 2 guests (29.2%). This suggests the primary traveler segment is likely couples or solo travelers.
- Properties designed for 2 guests and 4 guests dominate the Bayamón STR market, accounting for 54.9% of listings.
- 36.3% of properties accommodate 6+ guests, serving the market segment for larger families or group travel in Bayamón.
- On average, properties in Bayamón are equipped to host 4.3 guests.
Bayamón Airbnb Booking Patterns (2026): Available vs. Booked Days
Available Days Distribution
Booked Days Distribution
Booking Pattern Insights for Bayamón
- The most common availability pattern in Bayamón falls within the 91-180 days range, representing 32.7% of listings. This suggests many properties have significant open periods on their calendars.
- Approximately 53.1% of listings show high availability (181+ days open annually), indicating potential for increased bookings or specific owner usage patterns.
- For booked days, the 181-270 days range is most frequent in Bayamón (33.6%), reflecting common guest stay durations or potential owner blocking patterns.
- A notable 49.5% of properties secure long booking periods (181+ days booked per year), highlighting successful long-term rental strategies or significant owner usage.
Bayamón Airbnb Minimum Stay Requirements Analysis
Distribution of Listings by Minimum Night Requirement
1 Night
23 listings
20.4% of total
2 Nights
44 listings
38.9% of total
3 Nights
7 listings
6.2% of total
4-6 Nights
4 listings
3.5% of total
30+ Nights
35 listings
31% of total
Key Insights
- The most prevalent minimum stay requirement in Bayamón is 2 Nights, adopted by 38.9% of listings. This highlights the market's preference for shorter, flexible bookings.
- A significant segment (31%) caters to monthly stays (30+ nights) in Bayamón, pointing to opportunities in the extended-stay market.
Recommendations
- Align with the market by considering a 2 Nights minimum stay, as 38.9% of Bayamón hosts use this setting.
- If feasible, allowing 1-night stays, especially midweek or during low season, could capture last-minute bookings, as only 20.4% currently do.
- Explore offering discounts for stays of 30+ nights to attract the 31% of the market seeking extended stays.
- Adjust minimum nights based on seasonality – potentially shorter during low season and longer during peak demand periods in Bayamón.
Bayamón Airbnb Cancellation Policy Trends Analysis (2026)
Limited
1 listings
0.9% of total
Flexible
36 listings
31.9% of total
Moderate
26 listings
23% of total
Firm
33 listings
29.2% of total
Strict
17 listings
15% of total
Cancellation Policy Insights for Bayamón
- The prevailing Airbnb cancellation policy trend in Bayamón is Flexible, used by 31.9% of listings.
- There's a relatively balanced mix between guest-friendly (54.9%) and stricter (44.2%) policies, offering choices for different guest needs.
Recommendations for Hosts
- Consider adopting a Flexible policy to align with the 31.9% market standard in Bayamón.
- Regularly review your cancellation policy against competitors and market demand shifts in Bayamón.
Bayamón STR Booking Lead Time Analysis (2026)
Average Booking Lead Time by Month
Booking Lead Time Insights for Bayamón
- The overall average booking lead time for vacation rentals in Bayamón is 38 days.
- Guests book furthest in advance for stays during August (average 47 days), likely coinciding with peak travel demand or local events.
- The shortest booking windows occur for stays in March (average 21 days), indicating more last-minute travel plans during this time.
- Seasonally, Summer (43 days avg.) sees the longest lead times, while Spring (25 days avg.) has the shortest, reflecting typical travel planning cycles.
Recommendations for Hosts
- Use the overall average lead time (38 days) as a baseline for your pricing and availability strategy in Bayamón.
- Target marketing efforts for the Summer season well in advance (at least 43 days) to capture early planners.
- Monitor your own booking lead times against these Bayamón averages to identify opportunities for dynamic pricing adjustments.
Popular & Essential Airbnb Amenities in Bayamón (2026)
Amenity Prevalence
Amenity Insights for Bayamón
- Essential amenities in Bayamón that guests expect include: Air conditioning, Wifi, TV. Lacking these (any) could significantly impact bookings.
- Popular amenities like Hot water, Free parking on premises, Kitchen are common but not universal. Offering these can provide a competitive edge.
Recommendations for Hosts
- Ensure your listing includes all essential amenities for Bayamón: Air conditioning, Wifi, TV.
- Prioritize adding missing essentials: Air conditioning, Wifi, TV.
- Consider adding popular differentiators like Hot water or Free parking on premises to increase appeal.
- Highlight unique or less common amenities you offer (e.g., hot tub, dedicated workspace, EV charger) in your listing description and photos.
- Regularly check competitor amenities in Bayamón to stay competitive.
Bayamón Airbnb Guest Demographics & Profile Analysis (2026)
Guest Profile Summary for Bayamón
- The typical guest profile for Airbnb in Bayamón consists of primarily domestic travelers (76%), often arriving from nearby New York, typically belonging to the Post-2000s (Gen Z/Alpha) group (50%), primarily speaking English or Spanish.
- Domestic travelers account for 76.2% of guests.
- Key international markets include United States (76.2%) and Puerto Rico (17.1%).
- Top languages spoken are English (52.4%) followed by Spanish (42.4%).
- A significant demographic segment is the Post-2000s (Gen Z/Alpha) group, representing 50% of guests.
Recommendations for Hosts
- Target domestic marketing efforts towards travelers from New York and Orlando.
- Tailor amenities and listing descriptions to appeal to the dominant Post-2000s (Gen Z/Alpha) demographic (e.g., highlight fast WiFi, smart home features, local guides).
- Highlight unique local experiences or amenities relevant to the primary guest profile.
- Consider seasonal promotions aligned with peak travel times for key origin markets.
Nearby Short-Term Rental Market Comparison
How does the Bayamón Airbnb market stack up against its neighbors? Compare key performance metrics like average monthly revenue, ADR, and occupancy rates in surrounding areas to understand the broader regional STR landscape.
| Market | Active Properties | Monthly Revenue | Daily Rate | Avg. Occupancy |
|---|---|---|---|---|
| Guánica | 16 | $6,050 | $468.80 | 33% |
| Sabana | 16 | $5,847 | $454.72 | 44% |
| Fortuna | 14 | $5,521 | $311.09 | 50% |
| Mameyes II | 17 | $4,242 | $349.18 | 48% |
| Vega Alta | 78 | $4,082 | $336.12 | 46% |
| Río Grande | 100 | $4,068 | $457.29 | 44% |
| Río Grande | 609 | $4,033 | $368.55 | 43% |
| Dorado | 270 | $4,019 | $431.44 | 44% |
| Playa Fortuna | 14 | $3,994 | $256.75 | 49% |
| Cayey | 40 | $3,836 | $255.45 | 49% |