West End Airbnb Market Analysis 2026: Short Term Rental Data & Vacation Rental Statistics in New York, United States
Is Airbnb profitable in West End in 2026? Explore comprehensive Airbnb analytics for West End, New York, United States to uncover income potential. This 2026 STR market report for West End, based on AirROI data from February 2025 to January 2026, reveals key trends in the niche market of 34 active listings.
Whether you're considering an Airbnb investment in West End, optimizing your existing vacation rental, or exploring rental arbitrage opportunities, understanding the West End Airbnb data is crucial. Leveraging the low regulation environment is key to maximizing your short term rental income potential. Let's dive into the specifics.
Key West End Airbnb Performance Metrics Overview
Monthly Airbnb Revenue Variations & Income Potential in West End (2026)
Understanding the monthly revenue variations for Airbnb listings in West End is key to maximizing your short term rental income potential. Seasonality significantly impacts earnings. Our analysis, based on data from the past 12 months, shows that the peak revenue month for STRs in West End is typically July, while March often presents the lowest earnings, highlighting opportunities for strategic pricing adjustments during shoulder and low seasons. Explore the typical Airbnb income in West End across different performance tiers:
- Best-in-class properties (Top 10%) achieve $8,454+ monthly, often utilizing dynamic pricing and superior guest experiences.
- Strong performing properties (Top 25%) earn $5,429 or more, indicating effective management and desirable locations/amenities.
- Typical properties (Median) generate around $3,328 per month, representing the average market performance.
- Entry-level properties (Bottom 25%) see earnings around $1,855, often with potential for optimization.
Average Monthly Airbnb Earnings Trend in West End
West End Airbnb Occupancy Rate Trends (2026)
Maximize your bookings by understanding the West End STR occupancy trends. Seasonal demand shifts significantly influence how often properties are booked. Typically, Augustsees the highest demand (peak season occupancy), while March experiences the lowest (low season). Effective strategies, like adjusting minimum stays or offering promotions, can boost occupancy during slower periods. Here's how different property tiers perform in West End:
- Best-in-class properties (Top 10%) achieve 78%+ occupancy, indicating high desirability and potentially optimized availability.
- Strong performing properties (Top 25%) maintain 59% or higher occupancy, suggesting good market fit and guest satisfaction.
- Typical properties (Median) have an occupancy rate around 36%.
- Entry-level properties (Bottom 25%) average 24% occupancy, potentially facing higher vacancy.
Average Monthly Occupancy Rate Trend in West End
Average Daily Rate (ADR) Airbnb Trends in West End (2026)
Effective short term rental pricing strategy in West End involves understanding monthly ADR fluctuations. The Average Daily Rate (ADR) for Airbnb in West End typically peaks in July and dips lowest during February. Leveraging Airbnb dynamic pricing tools or strategies based on this seasonality can significantly boost revenue. Here's a look at the typical nightly rates achieved:
- Best-in-class properties (Top 10%) command rates of $388+ per night, often due to premium features or locations.
- Strong performing properties (Top 25%) achieve nightly rates of $316 or more.
- Typical properties (Median) charge around $237 per night.
- Entry-level properties (Bottom 25%) earn around $162 per night.
Average Daily Rate (ADR) Trend by Month in West End
Get Live West End Market Intelligence 👇

Explore Real-time Analytics
Airbnb Seasonality Analysis & Trends in West End (2026)
Peak Season (July, August, June)
- Revenue averages $7,650 per month
- Occupancy rates average 69.5%
- Daily rates average $273
Shoulder Season
- Revenue averages $3,600 per month
- Occupancy maintains around 34.0%
- Daily rates hold near $257
Low Season (February, March, April)
- Revenue drops to average $1,631 per month
- Occupancy decreases to average 26.3%
- Daily rates adjust to average $237
Seasonality Insights for West End
- The Airbnb seasonality in West End shows highly seasonal trends requiring careful strategy. While the sections above show seasonal averages, it's also insightful to look at the extremes:
- During the high season, the absolute peak month showcases West End's highest earning potential, with monthly revenues capable of climbing to $8,569, occupancy reaching a high of 75.0%, and ADRs peaking at $275.
- Conversely, the slowest single month of the year, typically falling within the low season, marks the market's lowest point. In this month, revenue might dip to $903, occupancy could drop to 17.2%, and ADRs may adjust down to $233.
- Understanding both the seasonal averages and these monthly peaks and troughs in revenue, occupancy, and ADR is crucial for maximizing your Airbnb profit potential in West End.
Seasonal Strategies for Maximizing Profit
- Peak Season: Maximize revenue through premium pricing and potentially longer minimum stays. Ensure high availability.
- Low Season: Offer competitive pricing, special promotions (e.g., extended stay discounts), and flexible cancellation policies. Target off-season travelers like remote workers or budget-conscious guests.
- Shoulder Seasons: Implement dynamic pricing that balances peak and low rates. Target weekend travelers or specific events. Offer slightly more flexible terms than peak season.
- Regularly analyze your own performance against these West End seasonality benchmarks and adjust your pricing and availability strategy accordingly.
Best Areas for Airbnb Investment in West End (2026)
Exploring the top neighborhoods for short-term rentals in West End? This section highlights key areas, outlining why they are attractive for hosts and guests, along with notable local attractions. Consider these locations based on your target guest profile and investment strategy.
| Neighborhood / Area | Why Host Here? (Target Guests & Appeal) | Key Attractions & Landmarks |
|---|---|---|
| West End | A historic neighborhood that offers a unique blend of culture and community spirit, with a vibrant local scene. It attracts visitors with its proximity to Broadway shows and various dining options, making it a prime location for tourists. | Broadway Theaters, Central Park, The Metropolitan Museum of Art, The American Museum of Natural History, The High Line, Columbus Circle |
| Hudson Yards | A modern and rapidly developing part of Manhattan, Hudson Yards boasts luxury shopping, dining, and stunning views. It is ideal for both business travelers and leisure visitors looking for a contemporary experience. | The Vessel, Hudson Yards Park, The Edge Observation Deck, High Line, Chelsea Market, Whitney Museum of American Art |
| Hell's Kitchen | Known for its diverse restaurant scene and vibrant nightlife, Hell's Kitchen is in close proximity to many tourist attractions. It's a hotspot for theater lovers and food enthusiasts alike. | Restaurant Row, The Intrepid Sea, Air & Space Museum, Theater District, Times Square, Central Park, Barclays Center |
| Chelsea | Famous for its art galleries and historic architecture, Chelsea also offers easy access to the High Line and the Hudson River Park, appealing to both cultural tourists and families. | The High Line, Chelsea Market, Whitney Museum of American Art, Chelsea Piers, Hudson River Park, Various art galleries |
| Greenwich Village | Known for its bohemian past and rich history, this charming neighborhood features tree-lined streets and is famous for its lively atmosphere and cultural significance. | Washington Square Park, New York University, Jazz Clubs, The Stonewall Inn, The Village Vanguard, Chabad of Greenwich Village |
| SoHo | A fashionable area filled with upscale shops, art galleries, and trendy restaurants, SoHo attracts both affluent tourists and local shoppers making it a paradise for those who appreciate art and style. | Cast Iron Historic District, Shopping boutiques, Art galleries, Restaurants, The Drawing Center, Designer stores |
| Upper West Side | A scenic, residential neighborhood filled with historic buildings and close proximity to Central Park, making it great for families and tourists looking for a more relaxed atmosphere. | Central Park, American Museum of Natural History, Columbia University, Lincoln Center, The Dakota, The New York Historical Society |
| Financial District | Once known primarily for business, the Financial District is now home to historical sites and vibrant spaces, making it appealing for tourists who want to explore Wall Street and Battery Park. | One World Trade Center, 9/11 Memorial, Wall Street, Battery Park, The Charging Bull, Brookfield Place |
Understanding Airbnb License Requirements & STR Laws in West End (2026)
While West End, New York, United States currently shows low STR regulations, specific Airbnb license requirements might still exist or change. Always verify the latest short term rental regulations and Airbnb license requirements directly with local government authorities for West End to ensure full compliance before hosting.
(Source: AirROI data, 2026, finding no licensed listings among those analyzed)
Top Performing Airbnb Properties in West End (2026)
Benchmark your potential! Explore examples of top-performing Airbnb properties in West Endbased on Trailing Twelve Month (TTM) revenue. Analyze their characteristics, revenue, occupancy rate, and ADR to understand what drives success in this market.
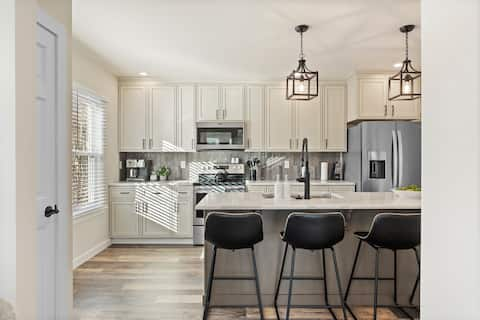
The Short Stop *1 mile to CASV*
Entire Place • 4 bedrooms

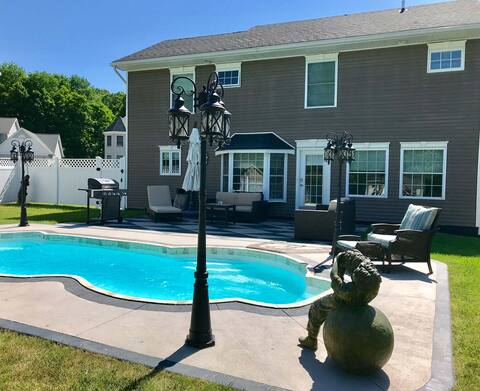
Alexia
Entire Place • 4 bedrooms
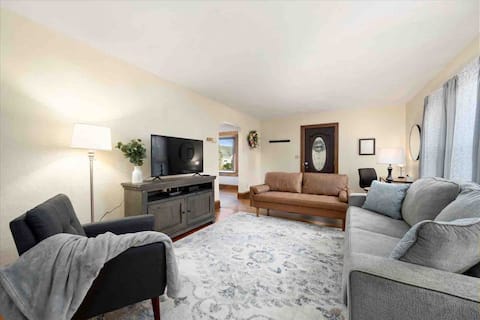
Arianna
Entire Place • 3 bedrooms
Maple Cove
Entire Place • 3 bedrooms

Home Base *Only 1/2 mile from All Star Village*
Entire Place • 4 bedrooms

Blue Cottage
Entire Place • 3 bedrooms
Note: Performance varies based on location, size, amenities, seasonality, and management quality. Data reflects the past 12 months.
Top Performing Airbnb Hosts in West End (2026)
Learn from the best! This table showcases top-performing Airbnb hosts in West End based on the number of properties managed and estimated total revenue over the past year. Analyze their scale and performance metrics.
| Host Name | Properties | Grossing Revenue | Stay Reviews | Avg Rating |
|---|---|---|---|---|
| Monica | 2 | $157,347 | 53 | 4.97/5.0 |
| Melissa | 3 | $151,642 | 75 | 4.98/5.0 |
| Lesley | 1 | $88,863 | 29 | 5.00/5.0 |
| Cooperstown Stay | 3 | $73,284 | 9 | 5.00/5.0 |
| Steve | 2 | $72,480 | 32 | 4.94/5.0 |
| Craig | 2 | $61,010 | 72 | 4.99/5.0 |
| Michael | 1 | $57,122 | 78 | 4.96/5.0 |
| Dave | 3 | $54,969 | 345 | 4.86/5.0 |
| Ryan | 1 | $50,316 | 24 | 5.00/5.0 |
| Mekayla | 1 | $41,000 | 40 | 4.88/5.0 |
Analyzing the strategies of top hosts, such as their property selection, pricing, and guest communication, can offer valuable lessons for optimizing your own Airbnb operations in West End.
Dive Deeper: Advanced West End STR Market Data (2026)
Ready to unlock more insights? AirROI provides access to advanced metrics and comprehensive Airbnb data for West End. Explore detailed analytics beyond this report to refine your investment strategy, optimize pricing, and maximize your vacation rental profits.
Explore Advanced MetricsWest End Short-Term Rental Market Composition (2026): Property & Room Types
Room Type Distribution
Property Type Distribution
Market Composition Insights for West End
- The West End Airbnb market composition is heavily skewed towards Entire Home/Apt listings, which make up 100% of the 34 active rentals. This indicates strong guest preference for privacy and space.
- Looking at the property type distribution in West End, House properties are the most common (58.8%), reflecting the local real estate landscape.
- Houses represent a significant 58.8% portion, catering likely to families or larger groups.
- The presence of 5.9% Hotel/Boutique listings indicates integration with traditional hospitality.
West End Airbnb Room Capacity Analysis (2026): Bedroom Distribution
Distribution of Listings by Number of Bedrooms
Room Capacity Insights for West End
- The dominant room capacity in West End is 2 bedrooms listings, making up 35.3% of the market. This suggests a strong demand for properties suitable for couples or solo travelers.
- Together, 2 bedrooms and 3 bedrooms properties represent 64.7% of the active Airbnb listings in West End, indicating a high concentration in these sizes.
- A significant 50.0% of listings offer 3+ bedrooms, catering to larger groups and families seeking more space in West End.
West End Vacation Rental Guest Capacity Trends (2026)
Distribution of Listings by Guest Capacity
Guest Capacity Insights for West End
- The most common guest capacity trend in West End vacation rentals is listings accommodating 8+ guests (29.4%). This suggests the primary traveler segment is likely larger groups.
- Properties designed for 8+ guests and 6 guests dominate the West End STR market, accounting for 58.8% of listings.
- 67.6% of properties accommodate 6+ guests, serving the market segment for larger families or group travel in West End.
- On average, properties in West End are equipped to host 6.1 guests.
West End Airbnb Booking Patterns (2026): Available vs. Booked Days
Available Days Distribution
Booked Days Distribution
Booking Pattern Insights for West End
- The most common availability pattern in West End falls within the 181-270 days range, representing 61.8% of listings. This suggests many properties have significant open periods on their calendars.
- Approximately 94.2% of listings show high availability (181+ days open annually), indicating potential for increased bookings or specific owner usage patterns.
- For booked days, the 91-180 days range is most frequent in West End (64.7%), reflecting common guest stay durations or potential owner blocking patterns.
- A notable 5.9% of properties secure long booking periods (181+ days booked per year), highlighting successful long-term rental strategies or significant owner usage.
West End Airbnb Minimum Stay Requirements Analysis
Distribution of Listings by Minimum Night Requirement
1 Night
5 listings
14.7% of total
2 Nights
3 listings
8.8% of total
3 Nights
3 listings
8.8% of total
4-6 Nights
6 listings
17.6% of total
7-29 Nights
1 listings
2.9% of total
30+ Nights
16 listings
47.1% of total
Key Insights
- The most prevalent minimum stay requirement in West End is 30+ Nights, adopted by 47.1% of listings. This highlights the market's preference for longer commitments.
- A significant segment (47.1%) caters to monthly stays (30+ nights) in West End, pointing to opportunities in the extended-stay market.
Recommendations
- Align with the market by considering a 30+ Nights minimum stay, as 47.1% of West End hosts use this setting.
- If feasible, allowing 1-night stays, especially midweek or during low season, could capture last-minute bookings, as only 14.7% currently do.
- Explore offering discounts for stays of 30+ nights to attract the 47.1% of the market seeking extended stays.
- Adjust minimum nights based on seasonality – potentially shorter during low season and longer during peak demand periods in West End.
West End Airbnb Cancellation Policy Trends Analysis (2026)
Super Strict 30 Days
5 listings
14.7% of total
Flexible
3 listings
8.8% of total
Moderate
7 listings
20.6% of total
Firm
17 listings
50% of total
Strict
2 listings
5.9% of total
Cancellation Policy Insights for West End
- The prevailing Airbnb cancellation policy trend in West End is Firm, used by 50% of listings.
- A majority (55.9%) of hosts in West End utilize Firm or Strict policies, indicating a market where hosts prioritize booking security.
- Strict cancellation policies are quite rare (5.9%), potentially making listings with this policy less competitive unless justified by high demand or property type.
Recommendations for Hosts
- Consider adopting a Firm policy to align with the 50% market standard in West End.
- Using a Strict policy might deter some guests, as only 5.9% of listings use it. Evaluate if potential revenue protection outweighs possible lower booking rates.
- Regularly review your cancellation policy against competitors and market demand shifts in West End.
West End STR Booking Lead Time Analysis (2026)
Average Booking Lead Time by Month
Booking Lead Time Insights for West End
- The overall average booking lead time for vacation rentals in West End is 120 days.
- Guests book furthest in advance for stays during July (average 203 days), likely coinciding with peak travel demand or local events.
- The shortest booking windows occur for stays in November (average 11 days), indicating more last-minute travel plans during this time.
- Seasonally, Summer (181 days avg.) sees the longest lead times, while Fall (39 days avg.) has the shortest, reflecting typical travel planning cycles.
Recommendations for Hosts
- Use the overall average lead time (120 days) as a baseline for your pricing and availability strategy in West End.
- For July stays, consider implementing length-of-stay discounts or slightly higher rates for bookings made less than 203 days out to capitalize on advance planning.
- During November, focus on last-minute booking availability and promotions, as guests book with very short notice (11 days avg.).
- Target marketing efforts for the Summer season well in advance (at least 181 days) to capture early planners.
- Monitor your own booking lead times against these West End averages to identify opportunities for dynamic pricing adjustments.
Popular & Essential Airbnb Amenities in West End (2026)
Amenity Prevalence
Amenity Insights for West End
- Essential amenities in West End that guests expect include: Free parking on premises, Smoke alarm, Fire extinguisher, TV, Kitchen, Hot water, Wifi, Air conditioning. Lacking these (any) could significantly impact bookings.
- Popular amenities like Dryer, Carbon monoxide alarm are common but not universal. Offering these can provide a competitive edge.
Recommendations for Hosts
- Ensure your listing includes all essential amenities for West End: Free parking on premises, Smoke alarm, Fire extinguisher, TV, Kitchen, Hot water, Wifi, Air conditioning.
- Consider adding popular differentiators like Dryer or Carbon monoxide alarm to increase appeal.
- Highlight unique or less common amenities you offer (e.g., hot tub, dedicated workspace, EV charger) in your listing description and photos.
- Regularly check competitor amenities in West End to stay competitive.
West End Airbnb Guest Demographics & Profile Analysis (2026)
Guest Profile Summary for West End
- The typical guest profile for Airbnb in West End consists of primarily domestic travelers (99%), often arriving from nearby New York, typically belonging to the Post-2000s (Gen Z/Alpha) group (50%), primarily speaking English or Spanish.
- Domestic travelers account for 99.2% of guests.
- Key international markets include United States (99.2%) and DC (0.8%).
- Top languages spoken are English (90.2%) followed by Spanish (7.3%).
- A significant demographic segment is the Post-2000s (Gen Z/Alpha) group, representing 50% of guests.
Recommendations for Hosts
- Target domestic marketing efforts towards travelers from New York and Las Vegas.
- Tailor amenities and listing descriptions to appeal to the dominant Post-2000s (Gen Z/Alpha) demographic (e.g., highlight fast WiFi, smart home features, local guides).
- Highlight unique local experiences or amenities relevant to the primary guest profile.
- Consider seasonal promotions aligned with peak travel times for key origin markets.
Nearby Short-Term Rental Market Comparison
How does the West End Airbnb market stack up against its neighbors? Compare key performance metrics like average monthly revenue, ADR, and occupancy rates in surrounding areas to understand the broader regional STR landscape.
| Market | Active Properties | Monthly Revenue | Daily Rate | Avg. Occupancy |
|---|---|---|---|---|
| Freeland | 11 | $8,436 | $684.29 | 42% |
| Town of Trenton | 13 | $7,410 | $484.59 | 43% |
| Berlin Township | 15 | $7,208 | $729.10 | 35% |
| Town of Kingston | 10 | $6,470 | $473.76 | 49% |
| Frankford Township | 11 | $6,329 | $505.19 | 41% |
| Stroud Township | 137 | $5,728 | $478.40 | 40% |
| Town of Monroe | 22 | $5,690 | $720.52 | 37% |
| Town of Torrey | 34 | $5,535 | $437.35 | 50% |
| Mount Pocono | 22 | $5,346 | $485.18 | 45% |
| Pocono Summit | 11 | $5,114 | $548.58 | 43% |