Wells Airbnb Market Analysis 2026: Short Term Rental Data & Vacation Rental Statistics in New York, United States
Is Airbnb profitable in Wells in 2026? Explore comprehensive Airbnb analytics for Wells, New York, United States to uncover income potential. This 2026 STR market report for Wells, based on AirROI data from February 2025 to January 2026, reveals key trends in the niche market of 25 active listings.
Whether you're considering an Airbnb investment in Wells, optimizing your existing vacation rental, or exploring rental arbitrage opportunities, understanding the Wells Airbnb data is crucial. Leveraging the low regulation environment is key to maximizing your short term rental income potential. Let's dive into the specifics.
Key Wells Airbnb Performance Metrics Overview
Monthly Airbnb Revenue Variations & Income Potential in Wells (2026)
Understanding the monthly revenue variations for Airbnb listings in Wells is key to maximizing your short term rental income potential. Seasonality significantly impacts earnings. Our analysis, based on data from the past 12 months, shows that the peak revenue month for STRs in Wells is typically July, while March often presents the lowest earnings, highlighting opportunities for strategic pricing adjustments during shoulder and low seasons. Explore the typical Airbnb income in Wells across different performance tiers:
- Best-in-class properties (Top 10%) achieve $4,124+ monthly, often utilizing dynamic pricing and superior guest experiences.
- Strong performing properties (Top 25%) earn $3,313 or more, indicating effective management and desirable locations/amenities.
- Typical properties (Median) generate around $2,040 per month, representing the average market performance.
- Entry-level properties (Bottom 25%) see earnings around $1,085, often with potential for optimization.
Average Monthly Airbnb Earnings Trend in Wells
Wells Airbnb Occupancy Rate Trends (2026)
Maximize your bookings by understanding the Wells STR occupancy trends. Seasonal demand shifts significantly influence how often properties are booked. Typically, Julysees the highest demand (peak season occupancy), while March experiences the lowest (low season). Effective strategies, like adjusting minimum stays or offering promotions, can boost occupancy during slower periods. Here's how different property tiers perform in Wells:
- Best-in-class properties (Top 10%) achieve 71%+ occupancy, indicating high desirability and potentially optimized availability.
- Strong performing properties (Top 25%) maintain 54% or higher occupancy, suggesting good market fit and guest satisfaction.
- Typical properties (Median) have an occupancy rate around 35%.
- Entry-level properties (Bottom 25%) average 19% occupancy, potentially facing higher vacancy.
Average Monthly Occupancy Rate Trend in Wells
Average Daily Rate (ADR) Airbnb Trends in Wells (2026)
Effective short term rental pricing strategy in Wells involves understanding monthly ADR fluctuations. The Average Daily Rate (ADR) for Airbnb in Wells typically peaks in October and dips lowest during February. Leveraging Airbnb dynamic pricing tools or strategies based on this seasonality can significantly boost revenue. Here's a look at the typical nightly rates achieved:
- Best-in-class properties (Top 10%) command rates of $318+ per night, often due to premium features or locations.
- Strong performing properties (Top 25%) achieve nightly rates of $235 or more.
- Typical properties (Median) charge around $189 per night.
- Entry-level properties (Bottom 25%) earn around $152 per night.
Average Daily Rate (ADR) Trend by Month in Wells
Get Live Wells Market Intelligence 👇

Explore Real-time Analytics
Airbnb Seasonality Analysis & Trends in Wells (2026)
Peak Season (July, August, June)
- Revenue averages $3,616 per month
- Occupancy rates average 55.6%
- Daily rates average $200
Shoulder Season
- Revenue averages $2,095 per month
- Occupancy maintains around 34.8%
- Daily rates hold near $212
Low Season (February, March, April)
- Revenue drops to average $1,283 per month
- Occupancy decreases to average 26.4%
- Daily rates adjust to average $181
Seasonality Insights for Wells
- The Airbnb seasonality in Wells shows highly seasonal trends requiring careful strategy. While the sections above show seasonal averages, it's also insightful to look at the extremes:
- During the high season, the absolute peak month showcases Wells's highest earning potential, with monthly revenues capable of climbing to $4,122, occupancy reaching a high of 60.8%, and ADRs peaking at $222.
- Conversely, the slowest single month of the year, typically falling within the low season, marks the market's lowest point. In this month, revenue might dip to $970, occupancy could drop to 17.9%, and ADRs may adjust down to $180.
- Understanding both the seasonal averages and these monthly peaks and troughs in revenue, occupancy, and ADR is crucial for maximizing your Airbnb profit potential in Wells.
Seasonal Strategies for Maximizing Profit
- Peak Season: Maximize revenue through premium pricing and potentially longer minimum stays. Ensure high availability.
- Low Season: Offer competitive pricing, special promotions (e.g., extended stay discounts), and flexible cancellation policies. Target off-season travelers like remote workers or budget-conscious guests.
- Shoulder Seasons: Implement dynamic pricing that balances peak and low rates. Target weekend travelers or specific events. Offer slightly more flexible terms than peak season.
- Regularly analyze your own performance against these Wells seasonality benchmarks and adjust your pricing and availability strategy accordingly.
Best Areas for Airbnb Investment in Wells (2026)
Exploring the top neighborhoods for short-term rentals in Wells? This section highlights key areas, outlining why they are attractive for hosts and guests, along with notable local attractions. Consider these locations based on your target guest profile and investment strategy.
| Neighborhood / Area | Why Host Here? (Target Guests & Appeal) | Key Attractions & Landmarks |
|---|---|---|
| Lake George Region | A popular vacation destination known for its stunning lake views, outdoor activities, and summer tourism. It attracts tourists looking to enjoy boating, fishing, and hiking all year round. | Lake George, Fort William Henry, Million Dollar Beach, Lake George Village, Great Escape and Splashwater Kingdom, Prospect Mountain |
| Wells Beach | A scenic beach destination with a mix of relaxation and outdoor recreation. Visitors come for the tranquil atmosphere and the picturesque views, making it ideal for vacation rentals. | Wells Beach, Drakes Island, Wells National Estuarine Research Reserve, Rachel Carson National Wildlife Refuge, Wells Harbor, Ogunquit Beach |
| Southern Maine | Known for its charming seaside towns and beautiful beaches. Attracts families and tourists interested in outdoor activities, arts, and culture. | Ogunquit Playhouse, Perkins Cove, Kennebunkport, Moody Beach, Cape Neddick Lighthouse, Marginal Way |
| Saratoga Springs | Famous for its horse racing and cultural heritage. A growing destination for those seeking a vibrant dining and arts scene, with numerous events throughout the year. | Saratoga Race Course, Saratoga Spa State Park, National Museum of Racing and Hall of Fame, Saratoga Performing Arts Center, SPAC, Historic downtown Saratoga |
| Adirondack Mountains | An outdoor enthusiast's paradise with hiking, skiing, and nature activities. Attracts visitors year-round looking for adventure and natural beauty. | High Peaks Region, Lake Placid, Saranac Lake, Adirondack Museum, Whiteface Mountain, Mirror Lake |
| Glens Falls | A historic city close to the Adirondacks offering various cultural and outdoor activities. It serves as a gateway to the region and is popular for its festivals and arts. | The Charles R. Wood Theater, Feeder Canal, Crandall Park, Cooper’s Cave, Glen Falls Civic Center, Art in the Park |
| Albany | The capital of New York State with rich history and a vibrant cultural scene. A hub for business travel and tourists looking for historical sites and government tours. | New York State Capitol, Empire State Plaza, Albany Institute of History & Art, Washington Park, Times Union Center, The Egg |
| Lake Bomoseen | A beautiful lake in Vermont near the New York border, popular for summer retreats and water activities. Great for those looking for a quieter getaway. | Lake Bomoseen State Park, Green Mountain National Forest, Bomoseen Marina, Quechee Gorge, Local hiking and biking trails, Bed and breakfasts |
Understanding Airbnb License Requirements & STR Laws in Wells (2026)
While Wells, New York, United States currently shows low STR regulations, specific Airbnb license requirements might still exist or change. Always verify the latest short term rental regulations and Airbnb license requirements directly with local government authorities for Wells to ensure full compliance before hosting.
(Source: AirROI data, 2026, finding no licensed listings among those analyzed)
Top Performing Airbnb Properties in Wells (2026)
Benchmark your potential! Explore examples of top-performing Airbnb properties in Wellsbased on Trailing Twelve Month (TTM) revenue. Analyze their characteristics, revenue, occupancy rate, and ADR to understand what drives success in this market.
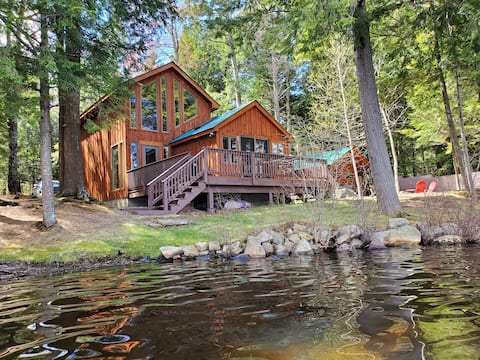
Charley Lake Camp
Entire Place • 3 bedrooms
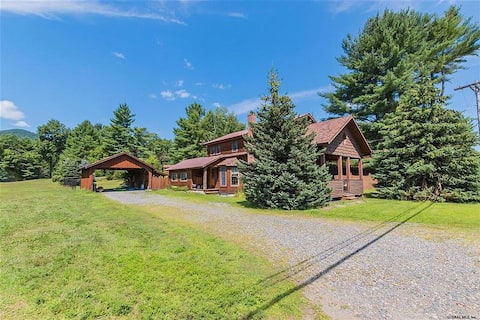
Route 30 Retreat
Entire Place • 3 bedrooms

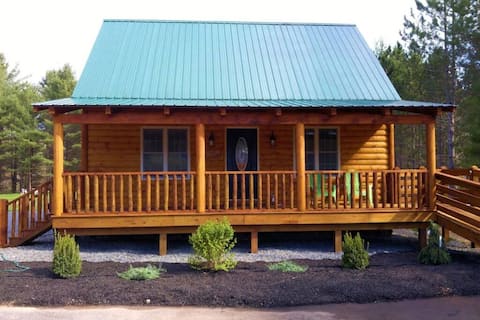
The Dakota, Dog Friendly Cabin at Lake Algonquin
Entire Place • 2 bedrooms

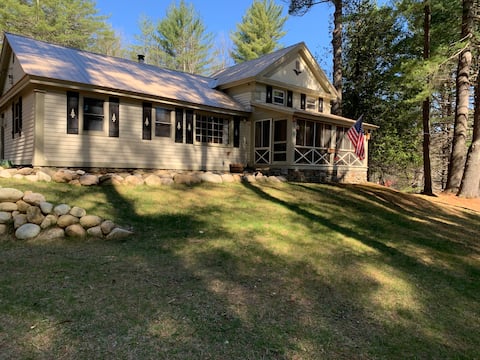
Lake House Cabin next to lake with hot tub
Entire Place • 4 bedrooms
The Yogi, Dog Friendly Cabin at Lake Algonquin
Entire Place • 3 bedrooms
Rustic Lake Home Nestled in the Pines
Entire Place • 3 bedrooms
Note: Performance varies based on location, size, amenities, seasonality, and management quality. Data reflects the past 12 months.
Top Performing Airbnb Hosts in Wells (2026)
Learn from the best! This table showcases top-performing Airbnb hosts in Wells based on the number of properties managed and estimated total revenue over the past year. Analyze their scale and performance metrics.
| Host Name | Properties | Grossing Revenue | Stay Reviews | Avg Rating |
|---|---|---|---|---|
| John | 2 | $71,529 | 70 | 4.92/5.0 |
| Danielle | 1 | $41,553 | 49 | 4.80/5.0 |
| Jennifer | 1 | $39,825 | 166 | 4.92/5.0 |
| Dana | 1 | $37,140 | 61 | 4.80/5.0 |
| Tara | 2 | $29,823 | 8 | 5.00/5.0 |
| Gerry | 2 | $26,432 | 306 | 4.93/5.0 |
| Suzanne | 1 | $25,259 | 30 | 4.97/5.0 |
| John | 1 | $24,473 | 226 | 4.97/5.0 |
| Mary Pat | 1 | $23,982 | 29 | 4.86/5.0 |
| Marie | 1 | $21,573 | 64 | 4.88/5.0 |
Analyzing the strategies of top hosts, such as their property selection, pricing, and guest communication, can offer valuable lessons for optimizing your own Airbnb operations in Wells.
Dive Deeper: Advanced Wells STR Market Data (2026)
Ready to unlock more insights? AirROI provides access to advanced metrics and comprehensive Airbnb data for Wells. Explore detailed analytics beyond this report to refine your investment strategy, optimize pricing, and maximize your vacation rental profits.
Explore Advanced MetricsWells Short-Term Rental Market Composition (2026): Property & Room Types
Room Type Distribution
Property Type Distribution
Market Composition Insights for Wells
- The Wells Airbnb market composition is heavily skewed towards Entire Home/Apt listings, which make up 100% of the 25 active rentals. This indicates strong guest preference for privacy and space.
- Looking at the property type distribution in Wells, House properties are the most common (44%), reflecting the local real estate landscape.
- Houses represent a significant 44% portion, catering likely to families or larger groups.
Wells Airbnb Room Capacity Analysis (2026): Bedroom Distribution
Distribution of Listings by Number of Bedrooms
Room Capacity Insights for Wells
- The dominant room capacity in Wells is 3 bedrooms listings, making up 40% of the market. This suggests a strong demand for properties suitable for families or small groups.
- Together, 3 bedrooms and 2 bedrooms properties represent 64.0% of the active Airbnb listings in Wells, indicating a high concentration in these sizes.
- A significant 56.0% of listings offer 3+ bedrooms, catering to larger groups and families seeking more space in Wells.
Wells Vacation Rental Guest Capacity Trends (2026)
Distribution of Listings by Guest Capacity
Guest Capacity Insights for Wells
- The most common guest capacity trend in Wells vacation rentals is listings accommodating 4 guests (44%). This suggests the primary traveler segment is likely small families or groups.
- Properties designed for 4 guests and 6 guests dominate the Wells STR market, accounting for 68.0% of listings.
- 40.0% of properties accommodate 6+ guests, serving the market segment for larger families or group travel in Wells.
- On average, properties in Wells are equipped to host 5.2 guests.
Wells Airbnb Booking Patterns (2026): Available vs. Booked Days
Available Days Distribution
Booked Days Distribution
Booking Pattern Insights for Wells
- The most common availability pattern in Wells falls within the 271-366 days range, representing 48% of listings. This suggests many properties have significant open periods on their calendars.
- Approximately 96.0% of listings show high availability (181+ days open annually), indicating potential for increased bookings or specific owner usage patterns.
- For booked days, the 91-180 days range is most frequent in Wells (44%), reflecting common guest stay durations or potential owner blocking patterns.
- A notable 8.0% of properties secure long booking periods (181+ days booked per year), highlighting successful long-term rental strategies or significant owner usage.
Wells Airbnb Minimum Stay Requirements Analysis
Distribution of Listings by Minimum Night Requirement
2 Nights
11 listings
44% of total
3 Nights
7 listings
28% of total
4-6 Nights
1 listings
4% of total
30+ Nights
6 listings
24% of total
Key Insights
- The most prevalent minimum stay requirement in Wells is 2 Nights, adopted by 44% of listings. This highlights the market's preference for shorter, flexible bookings.
- A significant segment (24%) caters to monthly stays (30+ nights) in Wells, pointing to opportunities in the extended-stay market.
Recommendations
- Align with the market by considering a 2 Nights minimum stay, as 44% of Wells hosts use this setting.
- A 2-night minimum appears standard (44%). Consider this for weekends or peak periods.
- Explore offering discounts for stays of 30+ nights to attract the 24% of the market seeking extended stays.
- Adjust minimum nights based on seasonality – potentially shorter during low season and longer during peak demand periods in Wells.
Wells Airbnb Cancellation Policy Trends Analysis (2026)
Super Strict 30 Days
2 listings
8% of total
Flexible
4 listings
16% of total
Moderate
5 listings
20% of total
Firm
13 listings
52% of total
Strict
1 listings
4% of total
Cancellation Policy Insights for Wells
- The prevailing Airbnb cancellation policy trend in Wells is Firm, used by 52% of listings.
- A majority (56.0%) of hosts in Wells utilize Firm or Strict policies, indicating a market where hosts prioritize booking security.
- Strict cancellation policies are quite rare (4%), potentially making listings with this policy less competitive unless justified by high demand or property type.
Recommendations for Hosts
- Consider adopting a Firm policy to align with the 52% market standard in Wells.
- Using a Strict policy might deter some guests, as only 4% of listings use it. Evaluate if potential revenue protection outweighs possible lower booking rates.
- Regularly review your cancellation policy against competitors and market demand shifts in Wells.
Wells STR Booking Lead Time Analysis (2026)
Average Booking Lead Time by Month
Booking Lead Time Insights for Wells
- The overall average booking lead time for vacation rentals in Wells is 72 days.
- Guests book furthest in advance for stays during July (average 120 days), likely coinciding with peak travel demand or local events.
- The shortest booking windows occur for stays in March (average 18 days), indicating more last-minute travel plans during this time.
- Seasonally, Summer (94 days avg.) sees the longest lead times, while Winter (32 days avg.) has the shortest, reflecting typical travel planning cycles.
Recommendations for Hosts
- Use the overall average lead time (72 days) as a baseline for your pricing and availability strategy in Wells.
- For July stays, consider implementing length-of-stay discounts or slightly higher rates for bookings made less than 120 days out to capitalize on advance planning.
- Target marketing efforts for the Summer season well in advance (at least 94 days) to capture early planners.
- Monitor your own booking lead times against these Wells averages to identify opportunities for dynamic pricing adjustments.
Popular & Essential Airbnb Amenities in Wells (2026)
Amenity Prevalence
Amenity Insights for Wells
- Essential amenities in Wells that guests expect include: Kitchen, Smoke alarm, Heating, Hot water, TV, Free parking on premises. Lacking these (any) could significantly impact bookings.
- Popular amenities like Cooking basics, Carbon monoxide alarm, Refrigerator are common but not universal. Offering these can provide a competitive edge.
- Warning: Wifi is not universally provided but is considered essential globally. Ensure reliable Wifi is offered.
Recommendations for Hosts
- Ensure your listing includes all essential amenities for Wells: Kitchen, Smoke alarm, Heating, Hot water, TV, Free parking on premises.
- Prioritize adding missing essentials: TV, Free parking on premises.
- Consider adding popular differentiators like Cooking basics or Carbon monoxide alarm to increase appeal.
- Highlight unique or less common amenities you offer (e.g., hot tub, dedicated workspace, EV charger) in your listing description and photos.
- Regularly check competitor amenities in Wells to stay competitive.
Wells Airbnb Guest Demographics & Profile Analysis (2026)
Guest Profile Summary for Wells
- The typical guest profile for Airbnb in Wells consists of primarily domestic travelers (99%), often arriving from nearby New York, typically belonging to the Post-2000s (Gen Z/Alpha) group (50%), primarily speaking English or Spanish.
- Domestic travelers account for 99.0% of guests.
- Key international markets include United States (99%) and United Kingdom (1%).
- Top languages spoken are English (73.8%) followed by Spanish (7.1%).
- A significant demographic segment is the Post-2000s (Gen Z/Alpha) group, representing 50% of guests.
Recommendations for Hosts
- Target domestic marketing efforts towards travelers from New York and Albany.
- Tailor amenities and listing descriptions to appeal to the dominant Post-2000s (Gen Z/Alpha) demographic (e.g., highlight fast WiFi, smart home features, local guides).
- Highlight unique local experiences or amenities relevant to the primary guest profile.
- Consider seasonal promotions aligned with peak travel times for key origin markets.
Nearby Short-Term Rental Market Comparison
How does the Wells Airbnb market stack up against its neighbors? Compare key performance metrics like average monthly revenue, ADR, and occupancy rates in surrounding areas to understand the broader regional STR landscape.
| Market | Active Properties | Monthly Revenue | Daily Rate | Avg. Occupancy |
|---|---|---|---|---|
| Town of Trenton | 13 | $7,410 | $484.59 | 43% |
| Middletown Springs | 13 | $6,843 | $507.55 | 32% |
| Fort Ann | 35 | $6,238 | $790.41 | 37% |
| Town of Ancram | 22 | $5,616 | $512.55 | 38% |
| Town of Schodack | 11 | $5,158 | $555.89 | 29% |
| Town of Stillwater | 55 | $5,153 | $564.54 | 42% |
| Monterey | 41 | $5,089 | $470.60 | 44% |
| Malletts Bay | 51 | $4,842 | $444.86 | 41% |
| Town of Wilton | 103 | $4,841 | $862.83 | 38% |
| Colebrook | 10 | $4,710 | $601.82 | 28% |