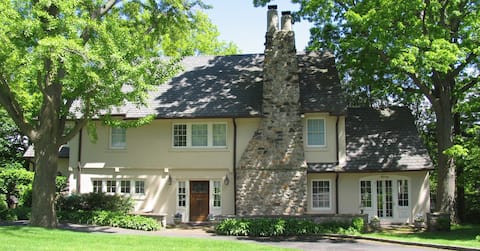
Village of Mamaroneck Airbnb Market Analysis 2026: Short Term Rental Data & Vacation Rental Statistics in New York, United States
Is Airbnb profitable in Village of Mamaroneck in 2026? Explore comprehensive Airbnb analytics for Village of Mamaroneck, New York, United States to uncover income potential. This 2026 STR market report for Village of Mamaroneck, based on AirROI data from February 2025 to January 2026, reveals key trends in the niche market of 31 active listings.
Whether you're considering an Airbnb investment in Village of Mamaroneck, optimizing your existing vacation rental, or exploring rental arbitrage opportunities, understanding the Village of Mamaroneck Airbnb data is crucial. Leveraging the low regulation environment is key to maximizing your short term rental income potential. Let's dive into the specifics.
Key Village of Mamaroneck Airbnb Performance Metrics Overview
Monthly Airbnb Revenue Variations & Income Potential in Village of Mamaroneck (2026)
Understanding the monthly revenue variations for Airbnb listings in Village of Mamaroneck is key to maximizing your short term rental income potential. Seasonality significantly impacts earnings. Our analysis, based on data from the past 12 months, shows that the peak revenue month for STRs in Village of Mamaroneck is typically July, while February often presents the lowest earnings, highlighting opportunities for strategic pricing adjustments during shoulder and low seasons. Explore the typical Airbnb income in Village of Mamaroneck across different performance tiers:
- Best-in-class properties (Top 10%) achieve $10,451+ monthly, often utilizing dynamic pricing and superior guest experiences.
- Strong performing properties (Top 25%) earn $6,084 or more, indicating effective management and desirable locations/amenities.
- Typical properties (Median) generate around $3,227 per month, representing the average market performance.
- Entry-level properties (Bottom 25%) see earnings around $1,644, often with potential for optimization.
Average Monthly Airbnb Earnings Trend in Village of Mamaroneck
Village of Mamaroneck Airbnb Occupancy Rate Trends (2026)
Maximize your bookings by understanding the Village of Mamaroneck STR occupancy trends. Seasonal demand shifts significantly influence how often properties are booked. Typically, Julysees the highest demand (peak season occupancy), while January experiences the lowest (low season). Effective strategies, like adjusting minimum stays or offering promotions, can boost occupancy during slower periods. Here's how different property tiers perform in Village of Mamaroneck:
- Best-in-class properties (Top 10%) achieve 85%+ occupancy, indicating high desirability and potentially optimized availability.
- Strong performing properties (Top 25%) maintain 70% or higher occupancy, suggesting good market fit and guest satisfaction.
- Typical properties (Median) have an occupancy rate around 46%.
- Entry-level properties (Bottom 25%) average 21% occupancy, potentially facing higher vacancy.
Average Monthly Occupancy Rate Trend in Village of Mamaroneck
Average Daily Rate (ADR) Airbnb Trends in Village of Mamaroneck (2026)
Effective short term rental pricing strategy in Village of Mamaroneck involves understanding monthly ADR fluctuations. The Average Daily Rate (ADR) for Airbnb in Village of Mamaroneck typically peaks in December and dips lowest during February. Leveraging Airbnb dynamic pricing tools or strategies based on this seasonality can significantly boost revenue. Here's a look at the typical nightly rates achieved:
- Best-in-class properties (Top 10%) command rates of $1,118+ per night, often due to premium features or locations.
- Strong performing properties (Top 25%) achieve nightly rates of $424 or more.
- Typical properties (Median) charge around $230 per night.
- Entry-level properties (Bottom 25%) earn around $126 per night.
Average Daily Rate (ADR) Trend by Month in Village of Mamaroneck
Get Live Village of Mamaroneck Market Intelligence 👇

Explore Real-time Analytics
Airbnb Seasonality Analysis & Trends in Village of Mamaroneck (2026)
Peak Season (July, September, August)
- Revenue averages $7,955 per month
- Occupancy rates average 58.1%
- Daily rates average $480
Shoulder Season
- Revenue averages $5,627 per month
- Occupancy maintains around 47.3%
- Daily rates hold near $476
Low Season (January, February, March)
- Revenue drops to average $3,038 per month
- Occupancy decreases to average 37.0%
- Daily rates adjust to average $452
Seasonality Insights for Village of Mamaroneck
- The Airbnb seasonality in Village of Mamaroneck shows highly seasonal trends requiring careful strategy. While the sections above show seasonal averages, it's also insightful to look at the extremes:
- During the high season, the absolute peak month showcases Village of Mamaroneck's highest earning potential, with monthly revenues capable of climbing to $8,301, occupancy reaching a high of 60.5%, and ADRs peaking at $499.
- Conversely, the slowest single month of the year, typically falling within the low season, marks the market's lowest point. In this month, revenue might dip to $2,195, occupancy could drop to 25.8%, and ADRs may adjust down to $430.
- Understanding both the seasonal averages and these monthly peaks and troughs in revenue, occupancy, and ADR is crucial for maximizing your Airbnb profit potential in Village of Mamaroneck.
Seasonal Strategies for Maximizing Profit
- Peak Season: Maximize revenue through premium pricing and potentially longer minimum stays. Ensure high availability.
- Low Season: Offer competitive pricing, special promotions (e.g., extended stay discounts), and flexible cancellation policies. Target off-season travelers like remote workers or budget-conscious guests.
- Shoulder Seasons: Implement dynamic pricing that balances peak and low rates. Target weekend travelers or specific events. Offer slightly more flexible terms than peak season.
- Regularly analyze your own performance against these Village of Mamaroneck seasonality benchmarks and adjust your pricing and availability strategy accordingly.
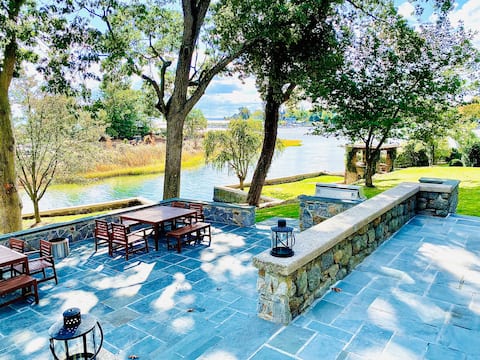
Best Areas for Airbnb Investment in Village of Mamaroneck (2026)
Exploring the top neighborhoods for short-term rentals in Village of Mamaroneck? This section highlights key areas, outlining why they are attractive for hosts and guests, along with notable local attractions. Consider these locations based on your target guest profile and investment strategy.
| Neighborhood / Area | Why Host Here? (Target Guests & Appeal) | Key Attractions & Landmarks |
|---|---|---|
| Harbor Island | Scenic waterfront location known for its marina and beautiful views. Attracts tourists looking for a relaxing getaway with water activities and charming local dining. | Harbor Island Park, Mamaroneck Beach Park, Mamaroneck Yacht Club, Marina Del Rey, Hommel Park |
| Mamaroneck Avenue | The heart of the village, filled with shops, cafes, and local businesses. A bustling area loved by both locals and visitors, providing a true sense of community. | Shops on Mamaroneck Avenue, Local restaurants, Movie theaters, Parks nearby |
| North Mamaroneck | A quiet residential area offering a peaceful retreat close to nature, perfect for families and visitors wanting a calm environment while still being near the village activities. | Brentwood Park, Mamaroneck Nature Preserve, Local schools and playgrounds |
| Mamaroneck Harbor | A picturesque harbor area that draws visitors for its scenic views and water activities, ideal for those seeking a coastal experience. | Mamaroneck Harbor, Waterfront dining, Historic boats and marina |
| Orienta | An affluent residential neighborhood known for its historic homes and quiet streets, attracting visitors looking for a charming and upscale atmosphere. | Orienta Beach Club, Scenic waterfront views, Historic architecture |
| Westchester Avenue | A key throughway that connects various neighborhoods, providing easy access to amenities, shops, and services, appealing to visitors looking for convenience. | Local shops and restaurants, Westchester County Center, Parks nearby |
| Mamaroneck Village Center | The cultural and social hub of the Village, featuring nightlife, restaurants, and community events, perfect for young adults and nightlife seekers. | Community events, Local bars and restaurants, Cultural festivals |
| Larchmont | Adjacent to Mamaroneck, a charming village with a suburban feel, known for its vibrant downtown area and beautiful parks, great for family-oriented stays. | Larchmont Harbor, Parks and playgrounds, Shops and restaurants on Larchmont Avenue |
Understanding Airbnb License Requirements & STR Laws in Village of Mamaroneck (2026)
While Village of Mamaroneck, New York, United States currently shows low STR regulations, specific Airbnb license requirements might still exist or change. Always verify the latest short term rental regulations and Airbnb license requirements directly with local government authorities for Village of Mamaroneck to ensure full compliance before hosting.
(Source: AirROI data, 2026, finding no licensed listings among those analyzed)
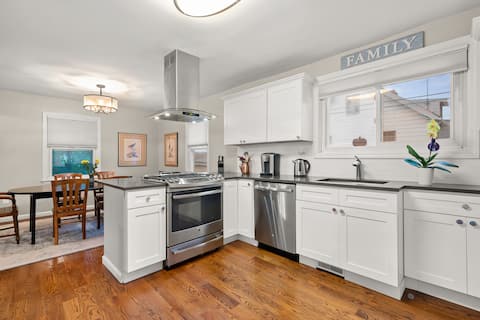
Top Performing Airbnb Properties in Village of Mamaroneck (2026)
Benchmark your potential! Explore examples of top-performing Airbnb properties in Village of Mamaroneckbased on Trailing Twelve Month (TTM) revenue. Analyze their characteristics, revenue, occupancy rate, and ADR to understand what drives success in this market.
Luxury 5 Star Home with Amazing Water Views
Entire Place • 5 bedrooms
WATERFRONT HOUSE / HUGE GARDEN & SEA ACCESS
Entire Place • 9 bedrooms
3 Bed/2 Bath Private Home in Mamaroneck
Entire Place • 3 bedrooms
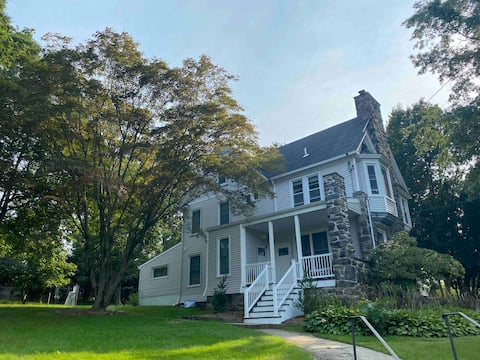
Bright & Modern Victorian in NY Suburbs
Entire Place • 3 bedrooms

Fully renovated 3 bedroom, 2 bath private home
Entire Place • 3 bedrooms

Modern home near NYC, perfect for extended stays
Entire Place • 3 bedrooms
Note: Performance varies based on location, size, amenities, seasonality, and management quality. Data reflects the past 12 months.
Top Performing Airbnb Hosts in Village of Mamaroneck (2026)
Learn from the best! This table showcases top-performing Airbnb hosts in Village of Mamaroneck based on the number of properties managed and estimated total revenue over the past year. Analyze their scale and performance metrics.
| Host Name | Properties | Grossing Revenue | Stay Reviews | Avg Rating |
|---|---|---|---|---|
| Dana | 4 | $362,517 | 226 | 4.99/5.0 |
| Alex | 1 | $249,972 | 17 | 4.76/5.0 |
| Elizabeth | 2 | $138,875 | 422 | 4.92/5.0 |
| Shay | 5 | $113,955 | 253 | 4.89/5.0 |
| Oren | 1 | $83,463 | 135 | 4.99/5.0 |
| Lillian | 1 | $77,537 | 146 | 4.95/5.0 |
| Sue | 1 | $64,885 | 27 | 5.00/5.0 |
| Evolve | 2 | $59,091 | 29 | 4.52/5.0 |
| Elsa | 1 | $50,426 | 61 | 4.93/5.0 |
| Pierre-Antoine | 1 | $46,684 | 9 | 5.00/5.0 |
Analyzing the strategies of top hosts, such as their property selection, pricing, and guest communication, can offer valuable lessons for optimizing your own Airbnb operations in Village of Mamaroneck.
Dive Deeper: Advanced Village of Mamaroneck STR Market Data (2026)
Ready to unlock more insights? AirROI provides access to advanced metrics and comprehensive Airbnb data for Village of Mamaroneck. Explore detailed analytics beyond this report to refine your investment strategy, optimize pricing, and maximize your vacation rental profits.
Explore Advanced MetricsVillage of Mamaroneck Short-Term Rental Market Composition (2026): Property & Room Types
Room Type Distribution
Property Type Distribution
Market Composition Insights for Village of Mamaroneck
- The Village of Mamaroneck Airbnb market composition is heavily skewed towards Entire Home/Apt listings, which make up 71% of the 31 active rentals. This indicates strong guest preference for privacy and space.
- Looking at the property type distribution in Village of Mamaroneck, House properties are the most common (74.2%), reflecting the local real estate landscape.
- Houses represent a significant 74.2% portion, catering likely to families or larger groups.
- Smaller segments like hotel/boutique (combined 3.2%) offer potential for unique stay experiences.
Village of Mamaroneck Airbnb Room Capacity Analysis (2026): Bedroom Distribution
Distribution of Listings by Number of Bedrooms
Room Capacity Insights for Village of Mamaroneck
- The dominant room capacity in Village of Mamaroneck is 3 bedrooms listings, making up 25.8% of the market. This suggests a strong demand for properties suitable for families or small groups.
- Together, 3 bedrooms and 1 bedroom properties represent 45.2% of the active Airbnb listings in Village of Mamaroneck, indicating a high concentration in these sizes.
- A significant 45.2% of listings offer 3+ bedrooms, catering to larger groups and families seeking more space in Village of Mamaroneck.
Village of Mamaroneck Vacation Rental Guest Capacity Trends (2026)
Distribution of Listings by Guest Capacity
Guest Capacity Insights for Village of Mamaroneck
- The most common guest capacity trend in Village of Mamaroneck vacation rentals is listings accommodating 8+ guests (22.6%). This suggests the primary traveler segment is likely larger groups.
- Properties designed for 8+ guests and 4 guests dominate the Village of Mamaroneck STR market, accounting for 35.5% of listings.
- 38.7% of properties accommodate 6+ guests, serving the market segment for larger families or group travel in Village of Mamaroneck.
- On average, properties in Village of Mamaroneck are equipped to host 4.1 guests.
Village of Mamaroneck Airbnb Booking Patterns (2026): Available vs. Booked Days
Available Days Distribution
Booked Days Distribution
Booking Pattern Insights for Village of Mamaroneck
- The most common availability pattern in Village of Mamaroneck falls within the 271-366 days range, representing 41.9% of listings. This suggests many properties have significant open periods on their calendars.
- Approximately 74.2% of listings show high availability (181+ days open annually), indicating potential for increased bookings or specific owner usage patterns.
- For booked days, the 91-180 days range is most frequent in Village of Mamaroneck (35.5%), reflecting common guest stay durations or potential owner blocking patterns.
- A notable 29.1% of properties secure long booking periods (181+ days booked per year), highlighting successful long-term rental strategies or significant owner usage.
Village of Mamaroneck Airbnb Minimum Stay Requirements Analysis
Distribution of Listings by Minimum Night Requirement
1 Night
2 listings
6.5% of total
2 Nights
9 listings
29% of total
3 Nights
3 listings
9.7% of total
4-6 Nights
8 listings
25.8% of total
30+ Nights
9 listings
29% of total
Key Insights
- The most prevalent minimum stay requirement in Village of Mamaroneck is 2 Nights, adopted by 29% of listings. This highlights the market's preference for shorter, flexible bookings.
- A significant segment (29%) caters to monthly stays (30+ nights) in Village of Mamaroneck, pointing to opportunities in the extended-stay market.
Recommendations
- Align with the market by considering a 2 Nights minimum stay, as 29% of Village of Mamaroneck hosts use this setting.
- If feasible, allowing 1-night stays, especially midweek or during low season, could capture last-minute bookings, as only 6.5% currently do.
- Explore offering discounts for stays of 30+ nights to attract the 29% of the market seeking extended stays.
- Adjust minimum nights based on seasonality – potentially shorter during low season and longer during peak demand periods in Village of Mamaroneck.
Village of Mamaroneck Airbnb Cancellation Policy Trends Analysis (2026)
Limited
1 listings
3.2% of total
Flexible
4 listings
12.9% of total
Moderate
5 listings
16.1% of total
Firm
13 listings
41.9% of total
Strict
8 listings
25.8% of total
Cancellation Policy Insights for Village of Mamaroneck
- The prevailing Airbnb cancellation policy trend in Village of Mamaroneck is Firm, used by 41.9% of listings.
- A majority (67.7%) of hosts in Village of Mamaroneck utilize Firm or Strict policies, indicating a market where hosts prioritize booking security.
Recommendations for Hosts
- Consider adopting a Firm policy to align with the 41.9% market standard in Village of Mamaroneck.
- Regularly review your cancellation policy against competitors and market demand shifts in Village of Mamaroneck.
Village of Mamaroneck STR Booking Lead Time Analysis (2026)
Average Booking Lead Time by Month
Booking Lead Time Insights for Village of Mamaroneck
- The overall average booking lead time for vacation rentals in Village of Mamaroneck is 55 days.
- Guests book furthest in advance for stays during December (average 77 days), likely coinciding with peak travel demand or local events.
- The shortest booking windows occur for stays in February (average 12 days), indicating more last-minute travel plans during this time.
- Seasonally, Fall (63 days avg.) sees the longest lead times, while Winter (43 days avg.) has the shortest, reflecting typical travel planning cycles.
Recommendations for Hosts
- Use the overall average lead time (55 days) as a baseline for your pricing and availability strategy in Village of Mamaroneck.
- For December stays, consider implementing length-of-stay discounts or slightly higher rates for bookings made less than 77 days out to capitalize on advance planning.
- During February, focus on last-minute booking availability and promotions, as guests book with very short notice (12 days avg.).
- Target marketing efforts for the Fall season well in advance (at least 63 days) to capture early planners.
- Monitor your own booking lead times against these Village of Mamaroneck averages to identify opportunities for dynamic pricing adjustments.
Popular & Essential Airbnb Amenities in Village of Mamaroneck (2026)
Amenity Prevalence
Amenity Insights for Village of Mamaroneck
- Essential amenities in Village of Mamaroneck that guests expect include: Wifi, Smoke alarm, Air conditioning, Hot water, Carbon monoxide alarm. Lacking these (any) could significantly impact bookings.
- Popular amenities like Heating, Hair dryer, TV are common but not universal. Offering these can provide a competitive edge.
Recommendations for Hosts
- Ensure your listing includes all essential amenities for Village of Mamaroneck: Wifi, Smoke alarm, Air conditioning, Hot water, Carbon monoxide alarm.
- Prioritize adding missing essentials: Hot water, Carbon monoxide alarm.
- Consider adding popular differentiators like Heating or Hair dryer to increase appeal.
- Highlight unique or less common amenities you offer (e.g., hot tub, dedicated workspace, EV charger) in your listing description and photos.
- Regularly check competitor amenities in Village of Mamaroneck to stay competitive.
Village of Mamaroneck Airbnb Guest Demographics & Profile Analysis (2026)
Guest Profile Summary for Village of Mamaroneck
- The typical guest profile for Airbnb in Village of Mamaroneck consists of primarily domestic travelers (85%), often arriving from nearby New York, typically belonging to the Post-2000s (Gen Z/Alpha) group (50%), primarily speaking English or Spanish.
- Domestic travelers account for 84.9% of guests.
- Key international markets include United States (84.9%) and United Kingdom (2.6%).
- Top languages spoken are English (60.7%) followed by Spanish (12.5%).
- A significant demographic segment is the Post-2000s (Gen Z/Alpha) group, representing 50% of guests.
Recommendations for Hosts
- Target domestic marketing efforts towards travelers from New York and Miami.
- Tailor amenities and listing descriptions to appeal to the dominant Post-2000s (Gen Z/Alpha) demographic (e.g., highlight fast WiFi, smart home features, local guides).
- Highlight unique local experiences or amenities relevant to the primary guest profile.
- Consider seasonal promotions aligned with peak travel times for key origin markets.
Nearby Short-Term Rental Market Comparison
How does the Village of Mamaroneck Airbnb market stack up against its neighbors? Compare key performance metrics like average monthly revenue, ADR, and occupancy rates in surrounding areas to understand the broader regional STR landscape.
| Market | Active Properties | Monthly Revenue | Daily Rate | Avg. Occupancy |
|---|---|---|---|---|
| Town of Kingston | 10 | $6,470 | $473.76 | 49% |
| Frankford Township | 11 | $6,329 | $505.19 | 41% |
| Sag Harbor | 15 | $6,129 | $1280.84 | 40% |
| Town of East Hampton | 1,327 | $5,945 | $986.02 | 36% |
| Spring Lake Heights | 16 | $5,785 | $725.20 | 40% |
| Town of Monroe | 22 | $5,690 | $720.52 | 37% |
| Town of Southampton | 1,201 | $5,620 | $1002.45 | 33% |
| Stone Harbor | 42 | $5,467 | $785.22 | 39% |
| Southampton | 19 | $5,405 | $1456.43 | 30% |
| Neptune City | 12 | $5,299 | $531.14 | 45% |