Village of Fredonia Airbnb Market Analysis 2026: Short Term Rental Data & Vacation Rental Statistics in New York, United States
Is Airbnb profitable in Village of Fredonia in 2026? Explore comprehensive Airbnb analytics for Village of Fredonia, New York, United States to uncover income potential. This 2026 STR market report for Village of Fredonia, based on AirROI data from February 2025 to January 2026, reveals key trends in the niche market of 25 active listings.
Whether you're considering an Airbnb investment in Village of Fredonia, optimizing your existing vacation rental, or exploring rental arbitrage opportunities, understanding the Village of Fredonia Airbnb data is crucial. Leveraging the low regulation environment is key to maximizing your short term rental income potential. Let's dive into the specifics.
Key Village of Fredonia Airbnb Performance Metrics Overview
Monthly Airbnb Revenue Variations & Income Potential in Village of Fredonia (2026)
Understanding the monthly revenue variations for Airbnb listings in Village of Fredonia is key to maximizing your short term rental income potential. Seasonality significantly impacts earnings. Our analysis, based on data from the past 12 months, shows that the peak revenue month for STRs in Village of Fredonia is typically July, while January often presents the lowest earnings, highlighting opportunities for strategic pricing adjustments during shoulder and low seasons. Explore the typical Airbnb income in Village of Fredonia across different performance tiers:
- Best-in-class properties (Top 10%) achieve $4,247+ monthly, often utilizing dynamic pricing and superior guest experiences.
- Strong performing properties (Top 25%) earn $2,766 or more, indicating effective management and desirable locations/amenities.
- Typical properties (Median) generate around $1,777 per month, representing the average market performance.
- Entry-level properties (Bottom 25%) see earnings around $1,284, often with potential for optimization.
Average Monthly Airbnb Earnings Trend in Village of Fredonia
Village of Fredonia Airbnb Occupancy Rate Trends (2026)
Maximize your bookings by understanding the Village of Fredonia STR occupancy trends. Seasonal demand shifts significantly influence how often properties are booked. Typically, Julysees the highest demand (peak season occupancy), while January experiences the lowest (low season). Effective strategies, like adjusting minimum stays or offering promotions, can boost occupancy during slower periods. Here's how different property tiers perform in Village of Fredonia:
- Best-in-class properties (Top 10%) achieve 72%+ occupancy, indicating high desirability and potentially optimized availability.
- Strong performing properties (Top 25%) maintain 63% or higher occupancy, suggesting good market fit and guest satisfaction.
- Typical properties (Median) have an occupancy rate around 40%.
- Entry-level properties (Bottom 25%) average 25% occupancy, potentially facing higher vacancy.
Average Monthly Occupancy Rate Trend in Village of Fredonia
Average Daily Rate (ADR) Airbnb Trends in Village of Fredonia (2026)
Effective short term rental pricing strategy in Village of Fredonia involves understanding monthly ADR fluctuations. The Average Daily Rate (ADR) for Airbnb in Village of Fredonia typically peaks in September and dips lowest during March. Leveraging Airbnb dynamic pricing tools or strategies based on this seasonality can significantly boost revenue. Here's a look at the typical nightly rates achieved:
- Best-in-class properties (Top 10%) command rates of $337+ per night, often due to premium features or locations.
- Strong performing properties (Top 25%) achieve nightly rates of $225 or more.
- Typical properties (Median) charge around $153 per night.
- Entry-level properties (Bottom 25%) earn around $126 per night.
Average Daily Rate (ADR) Trend by Month in Village of Fredonia
Get Live Village of Fredonia Market Intelligence 👇

Explore Real-time Analytics
Airbnb Seasonality Analysis & Trends in Village of Fredonia (2026)
Peak Season (July, August, May)
- Revenue averages $4,030 per month
- Occupancy rates average 53.2%
- Daily rates average $208
Shoulder Season
- Revenue averages $2,815 per month
- Occupancy maintains around 41.4%
- Daily rates hold near $204
Low Season (January, November, December)
- Revenue drops to average $1,599 per month
- Occupancy decreases to average 37.8%
- Daily rates adjust to average $221
Seasonality Insights for Village of Fredonia
- The Airbnb seasonality in Village of Fredonia shows highly seasonal trends requiring careful strategy. While the sections above show seasonal averages, it's also insightful to look at the extremes:
- During the high season, the absolute peak month showcases Village of Fredonia's highest earning potential, with monthly revenues capable of climbing to $4,189, occupancy reaching a high of 56.7%, and ADRs peaking at $226.
- Conversely, the slowest single month of the year, typically falling within the low season, marks the market's lowest point. In this month, revenue might dip to $1,330, occupancy could drop to 33.0%, and ADRs may adjust down to $185.
- Understanding both the seasonal averages and these monthly peaks and troughs in revenue, occupancy, and ADR is crucial for maximizing your Airbnb profit potential in Village of Fredonia.
Seasonal Strategies for Maximizing Profit
- Peak Season: Maximize revenue through premium pricing and potentially longer minimum stays. Ensure high availability.
- Low Season: Offer competitive pricing, special promotions (e.g., extended stay discounts), and flexible cancellation policies. Target off-season travelers like remote workers or budget-conscious guests.
- Shoulder Seasons: Implement dynamic pricing that balances peak and low rates. Target weekend travelers or specific events. Offer slightly more flexible terms than peak season.
- Regularly analyze your own performance against these Village of Fredonia seasonality benchmarks and adjust your pricing and availability strategy accordingly.
Best Areas for Airbnb Investment in Village of Fredonia (2026)
Exploring the top neighborhoods for short-term rentals in Village of Fredonia? This section highlights key areas, outlining why they are attractive for hosts and guests, along with notable local attractions. Consider these locations based on your target guest profile and investment strategy.
| Neighborhood / Area | Why Host Here? (Target Guests & Appeal) | Key Attractions & Landmarks |
|---|---|---|
| Downtown Fredonia | The historic center of Fredonia with charming architecture and accessibility to local shops and restaurants. Attracts visitors interested in local culture and history. | Fredonia Opera House, SUNY Fredonia, Candlewood Lake, Fredonia Historical Society, Lakeshore Railway Museum |
| Pine Valley | A scenic area just outside of Fredonia, perfect for nature lovers who want to enjoy outdoor activities like hiking, fishing, and relaxing by the lakes. | Lake Erie, Pine Valley Trail, Camp Hero, Woodlands Nature Center |
| Dunkirk waterfront | Adjacent to Fredonia, the Dunkirk waterfront offers beautiful lake views and recreational opportunities, making it appealing for beachgoers and water sports enthusiasts. | Dunkirk City Pier, Dunkirk Lighthouse, Dunkirk Beach, Lakeside Park |
| Fredonia Heights | A residential area that's quiet and family-friendly, popular among travelers who want a peaceful stay while still being close to the action in Fredonia. | Fredonia Heights Park, Walking trails, Local shops |
| Chautauqua Institution | A unique community known for its cultural and educational activities during the summer season, attracting a diverse array of visitors looking for a special experience. | Chautauqua Lake, Art galleries, Performing arts venues, Chautauqua Amphitheater |
| Cassadaga | Just a short drive from Fredonia, Cassadaga is known for its spiritual community and serene lake settings, perfect for those looking for a relaxing retreat. | Cassadaga Lakes, Spiritualist Church, Nature trails |
| Lake Erie State Park | A great destination for outdoor enthusiasts, offering camping, fishing, and hiking, and attracting nature lovers year-round. | Lake Erie beaches, Fishing spots, Nature trails, Picnic areas |
| Silver Creek | Nearby Silver Creek is a charming village that offers a rural setting but is still close to Fredonia, appealing to those looking for affordable accommodations and a small-town atmosphere. | Silver Creek Beach, Local parks, Historic sites |
Understanding Airbnb License Requirements & STR Laws in Village of Fredonia (2026)
While Village of Fredonia, New York, United States currently shows low STR regulations, specific Airbnb license requirements might still exist or change. Always verify the latest short term rental regulations and Airbnb license requirements directly with local government authorities for Village of Fredonia to ensure full compliance before hosting.
(Source: AirROI data, 2026, finding no licensed listings among those analyzed)
Top Performing Airbnb Properties in Village of Fredonia (2026)
Benchmark your potential! Explore examples of top-performing Airbnb properties in Village of Fredoniabased on Trailing Twelve Month (TTM) revenue. Analyze their characteristics, revenue, occupancy rate, and ADR to understand what drives success in this market.
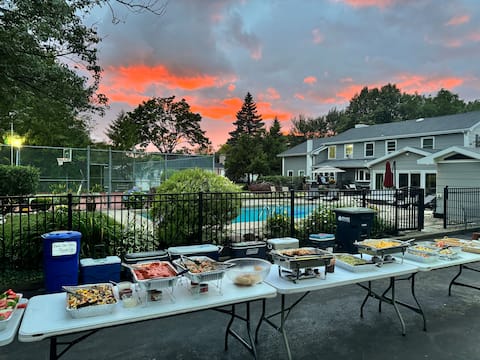
Family Estate - pool-tennis-hot tub-hoops-games
Entire Place • 9 bedrooms
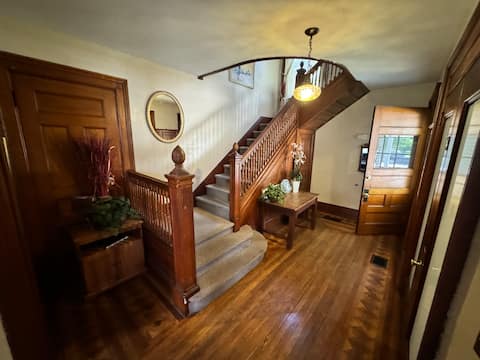
Summer Mansion -7 King Beds-sleeps 16+ @60 Central
Entire Place • 8 bedrooms
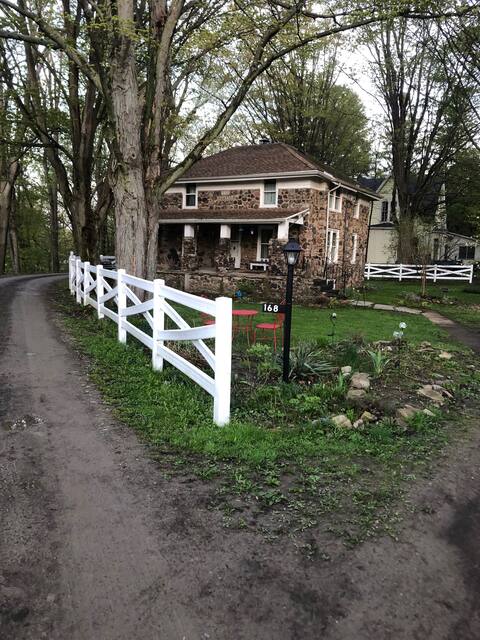
Rock Cottage Getaway
Entire Place • 3 bedrooms

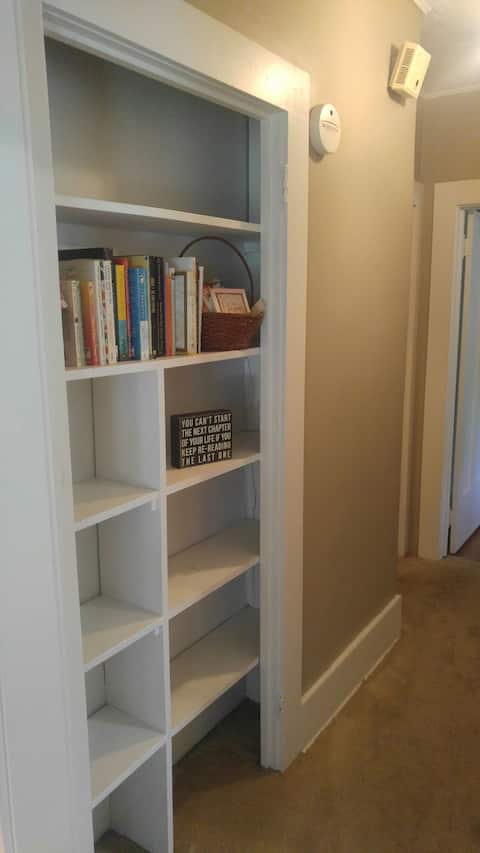
Large Bakery Apartment - Central Downtown Location
Entire Place • 2 bedrooms

Cush
Entire Place • 2 bedrooms
Cozy Fredonia Apartment
Entire Place • 1 bedroom
Note: Performance varies based on location, size, amenities, seasonality, and management quality. Data reflects the past 12 months.
Top Performing Airbnb Hosts in Village of Fredonia (2026)
Learn from the best! This table showcases top-performing Airbnb hosts in Village of Fredonia based on the number of properties managed and estimated total revenue over the past year. Analyze their scale and performance metrics.
| Host Name | Properties | Grossing Revenue | Stay Reviews | Avg Rating |
|---|---|---|---|---|
| Michael And Christine | 11 | $317,719 | 312 | 4.65/5.0 |
| Laurel | 2 | $48,464 | 213 | 4.96/5.0 |
| Michael | 1 | $28,641 | 222 | 4.94/5.0 |
| Matthew | 1 | $26,055 | 135 | 4.96/5.0 |
| Dakota | 1 | $26,049 | 71 | 4.99/5.0 |
| Gina | 1 | $25,549 | 81 | 4.93/5.0 |
| Laine | 1 | $24,761 | 114 | 4.96/5.0 |
| Courtney | 1 | $22,717 | 90 | 4.99/5.0 |
| Char | 1 | $20,080 | 38 | 4.89/5.0 |
| Elaine | 1 | $19,844 | 168 | 4.85/5.0 |
Analyzing the strategies of top hosts, such as their property selection, pricing, and guest communication, can offer valuable lessons for optimizing your own Airbnb operations in Village of Fredonia.
Dive Deeper: Advanced Village of Fredonia STR Market Data (2026)
Ready to unlock more insights? AirROI provides access to advanced metrics and comprehensive Airbnb data for Village of Fredonia. Explore detailed analytics beyond this report to refine your investment strategy, optimize pricing, and maximize your vacation rental profits.
Explore Advanced MetricsVillage of Fredonia Short-Term Rental Market Composition (2026): Property & Room Types
Room Type Distribution
Property Type Distribution
Market Composition Insights for Village of Fredonia
- The Village of Fredonia Airbnb market composition is heavily skewed towards Entire Home/Apt listings, which make up 100% of the 25 active rentals. This indicates strong guest preference for privacy and space.
- Looking at the property type distribution in Village of Fredonia, Apartment/Condo properties are the most common (64%), reflecting the local real estate landscape.
- Houses represent a significant 36% portion, catering likely to families or larger groups.
Village of Fredonia Airbnb Room Capacity Analysis (2026): Bedroom Distribution
Distribution of Listings by Number of Bedrooms
Room Capacity Insights for Village of Fredonia
- The dominant room capacity in Village of Fredonia is 2 bedrooms listings, making up 36% of the market. This suggests a strong demand for properties suitable for couples or solo travelers.
- Together, 2 bedrooms and 5+ bedrooms properties represent 60.0% of the active Airbnb listings in Village of Fredonia, indicating a high concentration in these sizes.
- A significant 48.0% of listings offer 3+ bedrooms, catering to larger groups and families seeking more space in Village of Fredonia.
Village of Fredonia Vacation Rental Guest Capacity Trends (2026)
Distribution of Listings by Guest Capacity
Guest Capacity Insights for Village of Fredonia
- The most common guest capacity trend in Village of Fredonia vacation rentals is listings accommodating 4 guests (36%). This suggests the primary traveler segment is likely small families or groups.
- Properties designed for 4 guests and 8+ guests dominate the Village of Fredonia STR market, accounting for 64.0% of listings.
- 40.0% of properties accommodate 6+ guests, serving the market segment for larger families or group travel in Village of Fredonia.
- On average, properties in Village of Fredonia are equipped to host 5.4 guests.
Village of Fredonia Airbnb Booking Patterns (2026): Available vs. Booked Days
Available Days Distribution
Booked Days Distribution
Booking Pattern Insights for Village of Fredonia
- The most common availability pattern in Village of Fredonia falls within the 271-366 days range, representing 44% of listings. This suggests many properties have significant open periods on their calendars.
- Approximately 84.0% of listings show high availability (181+ days open annually), indicating potential for increased bookings or specific owner usage patterns.
- For booked days, the 91-180 days range is most frequent in Village of Fredonia (40%), reflecting common guest stay durations or potential owner blocking patterns.
- A notable 20.0% of properties secure long booking periods (181+ days booked per year), highlighting successful long-term rental strategies or significant owner usage.
Village of Fredonia Airbnb Minimum Stay Requirements Analysis
Distribution of Listings by Minimum Night Requirement
1 Night
9 listings
36% of total
2 Nights
12 listings
48% of total
3 Nights
1 listings
4% of total
30+ Nights
3 listings
12% of total
Key Insights
- The most prevalent minimum stay requirement in Village of Fredonia is 2 Nights, adopted by 48% of listings. This highlights the market's preference for shorter, flexible bookings.
- A strong majority (84.0%) of the Village of Fredonia Airbnb data shows acceptance of very short stays (1-2 nights), indicating a dynamic, high-turnover market.
- A significant segment (12%) caters to monthly stays (30+ nights) in Village of Fredonia, pointing to opportunities in the extended-stay market.
Recommendations
- Align with the market by considering a 2 Nights minimum stay, as 48% of Village of Fredonia hosts use this setting.
- Explore offering discounts for stays of 30+ nights to attract the 12% of the market seeking extended stays.
- Adjust minimum nights based on seasonality – potentially shorter during low season and longer during peak demand periods in Village of Fredonia.
Village of Fredonia Airbnb Cancellation Policy Trends Analysis (2026)
Flexible
6 listings
24% of total
Moderate
4 listings
16% of total
Firm
14 listings
56% of total
Strict
1 listings
4% of total
Cancellation Policy Insights for Village of Fredonia
- The prevailing Airbnb cancellation policy trend in Village of Fredonia is Firm, used by 56% of listings.
- A majority (60.0%) of hosts in Village of Fredonia utilize Firm or Strict policies, indicating a market where hosts prioritize booking security.
- Strict cancellation policies are quite rare (4%), potentially making listings with this policy less competitive unless justified by high demand or property type.
Recommendations for Hosts
- Consider adopting a Firm policy to align with the 56% market standard in Village of Fredonia.
- Using a Strict policy might deter some guests, as only 4% of listings use it. Evaluate if potential revenue protection outweighs possible lower booking rates.
- Regularly review your cancellation policy against competitors and market demand shifts in Village of Fredonia.
Village of Fredonia STR Booking Lead Time Analysis (2026)
Average Booking Lead Time by Month
Booking Lead Time Insights for Village of Fredonia
- The overall average booking lead time for vacation rentals in Village of Fredonia is 87 days.
- Guests book furthest in advance for stays during May (average 171 days), likely coinciding with peak travel demand or local events.
- The shortest booking windows occur for stays in January (average 10 days), indicating more last-minute travel plans during this time.
- Seasonally, Spring (98 days avg.) sees the longest lead times, while Winter (30 days avg.) has the shortest, reflecting typical travel planning cycles.
Recommendations for Hosts
- Use the overall average lead time (87 days) as a baseline for your pricing and availability strategy in Village of Fredonia.
- For May stays, consider implementing length-of-stay discounts or slightly higher rates for bookings made less than 171 days out to capitalize on advance planning.
- During January, focus on last-minute booking availability and promotions, as guests book with very short notice (10 days avg.).
- Target marketing efforts for the Spring season well in advance (at least 98 days) to capture early planners.
- Monitor your own booking lead times against these Village of Fredonia averages to identify opportunities for dynamic pricing adjustments.
Popular & Essential Airbnb Amenities in Village of Fredonia (2026)
Amenity Prevalence
No amenities with partial availability (less than 100%) were found to display in the chart. All essential amenities might be present in all listings. Check insights below.
Amenity Insights for Village of Fredonia
- Essential amenities in Village of Fredonia that guests expect include: Kitchen, Hot water, Refrigerator, Cooking basics, Wifi, Smoke alarm, Bed linens, TV, Coffee maker, Dishes and silverware. Lacking these (any) could significantly impact bookings.
Recommendations for Hosts
- Ensure your listing includes all essential amenities for Village of Fredonia: Kitchen, Hot water, Refrigerator, Cooking basics, Wifi, Smoke alarm, Bed linens, TV, Coffee maker, Dishes and silverware.
- Highlight unique or less common amenities you offer (e.g., hot tub, dedicated workspace, EV charger) in your listing description and photos.
- Regularly check competitor amenities in Village of Fredonia to stay competitive.
Village of Fredonia Airbnb Guest Demographics & Profile Analysis (2026)
Guest Profile Summary for Village of Fredonia
- The typical guest profile for Airbnb in Village of Fredonia consists of primarily domestic travelers (97%), often arriving from nearby New York, typically belonging to the Post-2000s (Gen Z/Alpha) group (50%), primarily speaking English or Spanish.
- Domestic travelers account for 97.2% of guests.
- Key international markets include United States (97.2%) and Canada (0.8%).
- Top languages spoken are English (75%) followed by Spanish (13.5%).
- A significant demographic segment is the Post-2000s (Gen Z/Alpha) group, representing 50% of guests.
Recommendations for Hosts
- Target domestic marketing efforts towards travelers from New York and Buffalo.
- Tailor amenities and listing descriptions to appeal to the dominant Post-2000s (Gen Z/Alpha) demographic (e.g., highlight fast WiFi, smart home features, local guides).
- Highlight unique local experiences or amenities relevant to the primary guest profile.
- Consider seasonal promotions aligned with peak travel times for key origin markets.
Nearby Short-Term Rental Market Comparison
How does the Village of Fredonia Airbnb market stack up against its neighbors? Compare key performance metrics like average monthly revenue, ADR, and occupancy rates in surrounding areas to understand the broader regional STR landscape.
| Market | Active Properties | Monthly Revenue | Daily Rate | Avg. Occupancy |
|---|---|---|---|---|
| Town of Mansfield | 61 | $4,782 | $517.31 | 32% |
| Town of Porter | 22 | $4,724 | $331.03 | 54% |
| Town of Elma | 11 | $3,973 | $445.95 | 44% |
| Pine Creek Township | 10 | $3,889 | $230.94 | 57% |
| Town of West Seneca | 19 | $3,674 | $277.29 | 47% |
| Clinton Township | 13 | $3,493 | $330.11 | 33% |
| North East Township | 41 | $3,444 | $313.39 | 42% |
| Saybrook Township | 42 | $3,401 | $290.10 | 42% |
| Summit Township | 33 | $3,330 | $236.38 | 49% |
| Niagara-on-the-Lake | 441 | $3,266 | $287.63 | 43% |