Town of Wheatfield Airbnb Market Analysis 2025: Short Term Rental Data & Vacation Rental Statistics in New York, United States
Is Airbnb profitable in Town of Wheatfield in 2025? Explore comprehensive Airbnb analytics for Town of Wheatfield, New York, United States to uncover income potential. This 2025 STR market report for Town of Wheatfield, based on AirROI data from November 2024 to October 2025, reveals key trends in the niche market of 22 active listings.
Whether you're considering an Airbnb investment in Town of Wheatfield, optimizing your existing vacation rental, or exploring rental arbitrage opportunities, understanding the Town of Wheatfield Airbnb data is crucial. Leveraging the low regulation environment is key to maximizing your short term rental income potential. Let's dive into the specifics.
Key Town of Wheatfield Airbnb Performance Metrics Overview
Monthly Airbnb Revenue Variations & Income Potential in Town of Wheatfield (2025)
Understanding the monthly revenue variations for Airbnb listings in Town of Wheatfield is key to maximizing your short term rental income potential. Seasonality significantly impacts earnings. Our analysis, based on data from the past 12 months, shows that the peak revenue month for STRs in Town of Wheatfield is typically April, while February often presents the lowest earnings, highlighting opportunities for strategic pricing adjustments during shoulder and low seasons. Explore the typical Airbnb income in Town of Wheatfield across different performance tiers:
- Best-in-class properties (Top 10%) achieve $4,689+ monthly, often utilizing dynamic pricing and superior guest experiences.
- Strong performing properties (Top 25%) earn $3,017 or more, indicating effective management and desirable locations/amenities.
- Typical properties (Median) generate around $1,650 per month, representing the average market performance.
- Entry-level properties (Bottom 25%) see earnings around $697, often with potential for optimization.
Average Monthly Airbnb Earnings Trend in Town of Wheatfield
Town of Wheatfield Airbnb Occupancy Rate Trends (2025)
Maximize your bookings by understanding the Town of Wheatfield STR occupancy trends. Seasonal demand shifts significantly influence how often properties are booked. Typically, Aprilsees the highest demand (peak season occupancy), while February experiences the lowest (low season). Effective strategies, like adjusting minimum stays or offering promotions, can boost occupancy during slower periods. Here's how different property tiers perform in Town of Wheatfield:
- Best-in-class properties (Top 10%) achieve 75%+ occupancy, indicating high desirability and potentially optimized availability.
- Strong performing properties (Top 25%) maintain 53% or higher occupancy, suggesting good market fit and guest satisfaction.
- Typical properties (Median) have an occupancy rate around 26%.
- Entry-level properties (Bottom 25%) average 13% occupancy, potentially facing higher vacancy.
Average Monthly Occupancy Rate Trend in Town of Wheatfield
Average Daily Rate (ADR) Airbnb Trends in Town of Wheatfield (2025)
Effective short term rental pricing strategy in Town of Wheatfield involves understanding monthly ADR fluctuations. The Average Daily Rate (ADR) for Airbnb in Town of Wheatfield typically peaks in August and dips lowest during February. Leveraging Airbnb dynamic pricing tools or strategies based on this seasonality can significantly boost revenue. Here's a look at the typical nightly rates achieved:
- Best-in-class properties (Top 10%) command rates of $265+ per night, often due to premium features or locations.
- Strong performing properties (Top 25%) achieve nightly rates of $234 or more.
- Typical properties (Median) charge around $190 per night.
- Entry-level properties (Bottom 25%) earn around $136 per night.
Average Daily Rate (ADR) Trend by Month in Town of Wheatfield
Get Live Town of Wheatfield Market Intelligence 👇

Explore Real-time Analytics
Airbnb Seasonality Analysis & Trends in Town of Wheatfield (2025)
Peak Season (April, June, July)
- Revenue averages $3,166 per month
- Occupancy rates average 49.5%
- Daily rates average $194
Shoulder Season
- Revenue averages $1,984 per month
- Occupancy maintains around 32.7%
- Daily rates hold near $194
Low Season (January, February, March)
- Revenue drops to average $1,005 per month
- Occupancy decreases to average 27.4%
- Daily rates adjust to average $172
Seasonality Insights for Town of Wheatfield
- The Airbnb seasonality in Town of Wheatfield shows highly seasonal trends requiring careful strategy. While the sections above show seasonal averages, it's also insightful to look at the extremes:
- During the high season, the absolute peak month showcases Town of Wheatfield's highest earning potential, with monthly revenues capable of climbing to $3,680, occupancy reaching a high of 59.2%, and ADRs peaking at $217.
- Conversely, the slowest single month of the year, typically falling within the low season, marks the market's lowest point. In this month, revenue might dip to $800, occupancy could drop to 25.0%, and ADRs may adjust down to $169.
- Understanding both the seasonal averages and these monthly peaks and troughs in revenue, occupancy, and ADR is crucial for maximizing your Airbnb profit potential in Town of Wheatfield.
Seasonal Strategies for Maximizing Profit
- Peak Season: Maximize revenue through premium pricing and potentially longer minimum stays. Ensure high availability.
- Low Season: Offer competitive pricing, special promotions (e.g., extended stay discounts), and flexible cancellation policies. Target off-season travelers like remote workers or budget-conscious guests.
- Shoulder Seasons: Implement dynamic pricing that balances peak and low rates. Target weekend travelers or specific events. Offer slightly more flexible terms than peak season.
- Regularly analyze your own performance against these Town of Wheatfield seasonality benchmarks and adjust your pricing and availability strategy accordingly.
Best Areas for Airbnb Investment in Town of Wheatfield (2025)
Exploring the top neighborhoods for short-term rentals in Town of Wheatfield? This section highlights key areas, outlining why they are attractive for hosts and guests, along with notable local attractions. Consider these locations based on your target guest profile and investment strategy.
| Neighborhood / Area | Why Host Here? (Target Guests & Appeal) | Key Attractions & Landmarks |
|---|---|---|
| Niagara Falls | Famous for its breathtaking waterfalls, Niagara Falls attracts millions of tourists each year. It's ideal for Airbnb hosts due to the continuous flow of visitors looking for nearby accommodations and experiences. | Niagara Falls State Park, Maid of the Mist, Cave of the Winds, Niagara SkyWheel, Old Fort Niagara |
| Buffalo | As the second-largest city in New York State, Buffalo boasts a rich history, cultural attractions, and proximity to Niagara Falls. It's perfect for both leisure and business travelers. | Buffalo Museum of Science, Albright-Knox Art Gallery, Canalside, Buffalo and Erie County Naval & Military Park, Frank Lloyd Wright's Darwin D. Martin House |
| Lockport | Known for its historic sites and the Erie Canal, Lockport is an appealing destination for those seeking a charming small-town experience while being close to Niagara Falls. | Lockport Cave and Underground Boat Ride, Erie Canal Discovery Center, Historic Lock 34, Lockport Locks, The Kenan Center |
| Amherst | A suburban community with attractions like the Amherst Museum and proximity to larger cities, Amherst is an attractive area for families and business travelers alike. | Amherst State Park, Buffalo Niagara Heritage Village, Ellicott Creek Park, Island Park, Northtown Center |
| Lewiston | Historic Lewiston, known for its quaint downtown and scenic views along the Niagara River, offers a picturesque spot for tourists looking for unique stay options. | Lewiston's Historic District, Artpark, Fort Niagara, Niagara River Recreation Trail, The Brickyard Pub and B B Q |
| Youngstown | A small village with beautiful views of the Niagara River, Youngstown attracts visitors looking for peaceful retreats and outdoor activities, ideal for Airbnb listings. | Old Fort Niagara State Historic Site, Youngstown Recreation Park, Lake Ontario, Maid of the Mist, Niagara River |
| North Tonawanda | Located near the cities of Niagara Falls and Buffalo, North Tonawanda offers convenient access to various attractions, appealing to both tourists and local visitors. | Erie Canal Historic Park, North Tonawanda History Museum, Dunn Tire Park, Veterans Memorial Park, Tonawanda Island |
| Grand Island | A residential community known for its parks and natural beauty, Grand Island provides a serene escape and is perfect for Airbnb hosts catering to nature lovers. | Buckhorn Island State Park, Grand Island's Beaver Island State Park, River Lea, The Niagara River, Circle Park |
Understanding Airbnb License Requirements & STR Laws in Town of Wheatfield (2025)
While Town of Wheatfield, New York, United States currently shows low STR regulations, specific Airbnb license requirements might still exist or change. Always verify the latest short term rental regulations and Airbnb license requirements directly with local government authorities for Town of Wheatfield to ensure full compliance before hosting.
(Source: AirROI data, 2025, finding no licensed listings among those analyzed)
Top Performing Airbnb Properties in Town of Wheatfield (2025)
Benchmark your potential! Explore examples of top-performing Airbnb properties in Town of Wheatfieldbased on Trailing Twelve Month (TTM) revenue. Analyze their characteristics, revenue, occupancy rate, and ADR to understand what drives success in this market.
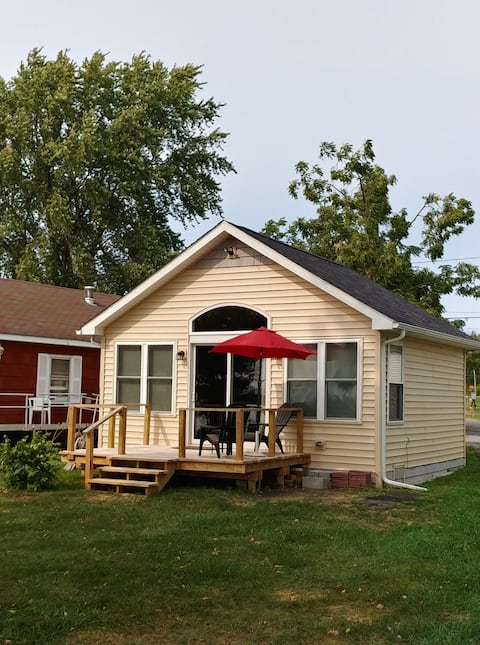
Waterfront Niagara River Cottage
Entire Place • N/A

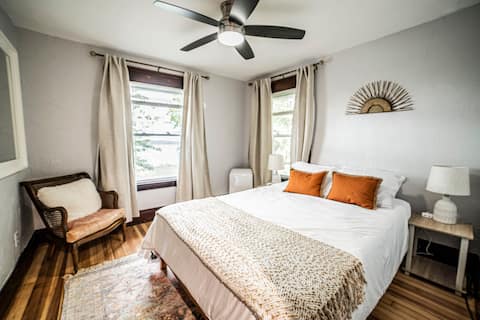
Harvest Haven Sunflower Serenity Peaceful & Quiet
Entire Place • 2 bedrooms
Charming 2BR Apartment• 15 Mins to Niagara Falls
Entire Place • 2 bedrooms
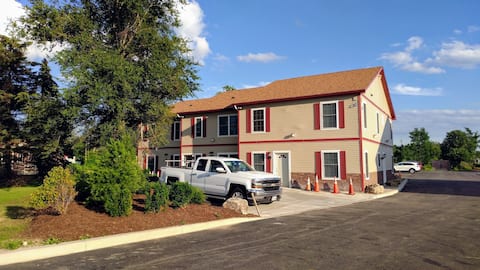
Built 2018 Two Bedroom Condo Suite
Entire Place • 2 bedrooms

Welcome to Niagara Falls, N.Y.
Entire Place • 3 bedrooms

Mediterranean Style Suite 15 Min from the Falls!
Entire Place • 1 bedroom
Note: Performance varies based on location, size, amenities, seasonality, and management quality. Data reflects the past 12 months.
Top Performing Airbnb Hosts in Town of Wheatfield (2025)
Learn from the best! This table showcases top-performing Airbnb hosts in Town of Wheatfield based on the number of properties managed and estimated total revenue over the past year. Analyze their scale and performance metrics.
| Host Name | Properties | Grossing Revenue | Stay Reviews | Avg Rating |
|---|---|---|---|---|
| Billy | 8 | $68,291 | 436 | 4.40/5.0 |
| Denise | 2 | $51,625 | 39 | 4.98/5.0 |
| Lori | 1 | $40,238 | 207 | 4.98/5.0 |
| Bridget | 1 | $26,373 | 166 | 4.91/5.0 |
| Sadaf | 3 | $22,554 | 25 | 4.31/5.0 |
| Nazia | 1 | $17,884 | 182 | 4.69/5.0 |
| Sam And Jamie | 1 | $17,311 | 148 | 4.95/5.0 |
| Maria | 1 | $8,327 | 13 | 5.00/5.0 |
| Christian | 2 | $7,291 | 16 | 4.94/5.0 |
| Michael | 1 | $2,415 | 5 | 5.00/5.0 |
Analyzing the strategies of top hosts, such as their property selection, pricing, and guest communication, can offer valuable lessons for optimizing your own Airbnb operations in Town of Wheatfield.
Dive Deeper: Advanced Town of Wheatfield STR Market Data (2025)
Ready to unlock more insights? AirROI provides access to advanced metrics and comprehensive Airbnb data for Town of Wheatfield. Explore detailed analytics beyond this report to refine your investment strategy, optimize pricing, and maximize your vacation rental profits.
Explore Advanced MetricsTown of Wheatfield Short-Term Rental Market Composition (2025): Property & Room Types
Room Type Distribution
Property Type Distribution
Market Composition Insights for Town of Wheatfield
- The Town of Wheatfield Airbnb market composition is heavily skewed towards Entire Home/Apt listings, which make up 95.5% of the 22 active rentals. This indicates strong guest preference for privacy and space.
- Looking at the property type distribution in Town of Wheatfield, Apartment/Condo properties are the most common (59.1%), reflecting the local real estate landscape.
- Houses represent a significant 40.9% portion, catering likely to families or larger groups.
Town of Wheatfield Airbnb Room Capacity Analysis (2025): Bedroom Distribution
Distribution of Listings by Number of Bedrooms
Room Capacity Insights for Town of Wheatfield
- The dominant room capacity in Town of Wheatfield is 2 bedrooms listings, making up 45.5% of the market. This suggests a strong demand for properties suitable for couples or solo travelers.
- Together, 2 bedrooms and 3 bedrooms properties represent 72.8% of the active Airbnb listings in Town of Wheatfield, indicating a high concentration in these sizes.
- A significant 31.8% of listings offer 3+ bedrooms, catering to larger groups and families seeking more space in Town of Wheatfield.
Town of Wheatfield Vacation Rental Guest Capacity Trends (2025)
Distribution of Listings by Guest Capacity
Guest Capacity Insights for Town of Wheatfield
- The most common guest capacity trend in Town of Wheatfield vacation rentals is listings accommodating 8+ guests (45.5%). This suggests the primary traveler segment is likely larger groups.
- Properties designed for 8+ guests and 4 guests dominate the Town of Wheatfield STR market, accounting for 68.2% of listings.
- 59.1% of properties accommodate 6+ guests, serving the market segment for larger families or group travel in Town of Wheatfield.
- On average, properties in Town of Wheatfield are equipped to host 5.8 guests.
Town of Wheatfield Airbnb Booking Patterns (2025): Available vs. Booked Days
Available Days Distribution
Booked Days Distribution
Booking Pattern Insights for Town of Wheatfield
- The most common availability pattern in Town of Wheatfield falls within the 271-366 days range, representing 77.3% of listings. This suggests many properties have significant open periods on their calendars.
- Approximately 95.5% of listings show high availability (181+ days open annually), indicating potential for increased bookings or specific owner usage patterns.
- For booked days, the 31-90 days range is most frequent in Town of Wheatfield (40.9%), reflecting common guest stay durations or potential owner blocking patterns.
- A notable 9.0% of properties secure long booking periods (181+ days booked per year), highlighting successful long-term rental strategies or significant owner usage.
Town of Wheatfield Airbnb Minimum Stay Requirements Analysis
Distribution of Listings by Minimum Night Requirement
1 Night
16 listings
72.7% of total
2 Nights
2 listings
9.1% of total
30+ Nights
4 listings
18.2% of total
Key Insights
- The most prevalent minimum stay requirement in Town of Wheatfield is 1 Night, adopted by 72.7% of listings. This highlights the market's preference for shorter, flexible bookings.
- A strong majority (81.8%) of the Town of Wheatfield Airbnb data shows acceptance of very short stays (1-2 nights), indicating a dynamic, high-turnover market.
- A significant segment (18.2%) caters to monthly stays (30+ nights) in Town of Wheatfield, pointing to opportunities in the extended-stay market.
Recommendations
- Align with the market by considering a 1 Night minimum stay, as 72.7% of Town of Wheatfield hosts use this setting.
- Explore offering discounts for stays of 30+ nights to attract the 18.2% of the market seeking extended stays.
- Adjust minimum nights based on seasonality – potentially shorter during low season and longer during peak demand periods in Town of Wheatfield.
Town of Wheatfield Airbnb Cancellation Policy Trends Analysis (2025)
Flexible
2 listings
9.1% of total
Moderate
11 listings
50% of total
Firm
5 listings
22.7% of total
Strict
4 listings
18.2% of total
Cancellation Policy Insights for Town of Wheatfield
- The prevailing Airbnb cancellation policy trend in Town of Wheatfield is Moderate, used by 50% of listings.
- There's a relatively balanced mix between guest-friendly (59.1%) and stricter (40.9%) policies, offering choices for different guest needs.
Recommendations for Hosts
- Consider adopting a Moderate policy to align with the 50% market standard in Town of Wheatfield.
- Regularly review your cancellation policy against competitors and market demand shifts in Town of Wheatfield.
Town of Wheatfield STR Booking Lead Time Analysis (2025)
Average Booking Lead Time by Month
Booking Lead Time Insights for Town of Wheatfield
- The overall average booking lead time for vacation rentals in Town of Wheatfield is 35 days.
- Guests book furthest in advance for stays during May (average 68 days), likely coinciding with peak travel demand or local events.
- The shortest booking windows occur for stays in February (average 4 days), indicating more last-minute travel plans during this time.
- Seasonally, Spring (45 days avg.) sees the longest lead times, while Winter (18 days avg.) has the shortest, reflecting typical travel planning cycles.
Recommendations for Hosts
- Use the overall average lead time (35 days) as a baseline for your pricing and availability strategy in Town of Wheatfield.
- For May stays, consider implementing length-of-stay discounts or slightly higher rates for bookings made less than 68 days out to capitalize on advance planning.
- During February, focus on last-minute booking availability and promotions, as guests book with very short notice (4 days avg.).
- Target marketing efforts for the Spring season well in advance (at least 45 days) to capture early planners.
- Monitor your own booking lead times against these Town of Wheatfield averages to identify opportunities for dynamic pricing adjustments.
Popular & Essential Airbnb Amenities in Town of Wheatfield (2025)
Amenity Prevalence
Amenity Insights for Town of Wheatfield
- Essential amenities in Town of Wheatfield that guests expect include: Free parking on premises, Kitchen, Carbon monoxide alarm, Air conditioning, Smoke alarm, Wifi, TV, Iron, Hot water, Heating. Lacking these (any) could significantly impact bookings.
Recommendations for Hosts
- Ensure your listing includes all essential amenities for Town of Wheatfield: Free parking on premises, Kitchen, Carbon monoxide alarm, Air conditioning, Smoke alarm, Wifi, TV, Iron, Hot water, Heating.
- Prioritize adding missing essentials: Iron, Hot water, Heating.
- Highlight unique or less common amenities you offer (e.g., hot tub, dedicated workspace, EV charger) in your listing description and photos.
- Regularly check competitor amenities in Town of Wheatfield to stay competitive.
Town of Wheatfield Airbnb Guest Demographics & Profile Analysis (2025)
Guest Profile Summary for Town of Wheatfield
- The typical guest profile for Airbnb in Town of Wheatfield consists of primarily domestic travelers (90%), often arriving from nearby New York, typically belonging to the Post-2000s (Gen Z/Alpha) group (50%), primarily speaking English or Hindi.
- Domestic travelers account for 90.4% of guests.
- Key international markets include United States (90.4%) and India (2.7%).
- Top languages spoken are English (72.1%) followed by Hindi (9.3%).
- A significant demographic segment is the Post-2000s (Gen Z/Alpha) group, representing 50% of guests.
Recommendations for Hosts
- Target domestic marketing efforts towards travelers from New York and Gordonville.
- Tailor amenities and listing descriptions to appeal to the dominant Post-2000s (Gen Z/Alpha) demographic (e.g., highlight fast WiFi, smart home features, local guides).
- Highlight unique local experiences or amenities relevant to the primary guest profile.
- Consider seasonal promotions aligned with peak travel times for key origin markets.
Nearby Short-Term Rental Market Comparison
How does the Town of Wheatfield Airbnb market stack up against its neighbors? Compare key performance metrics like average monthly revenue, ADR, and occupancy rates in surrounding areas to understand the broader regional STR landscape.
| Market | Active Properties | Monthly Revenue | Daily Rate | Avg. Occupancy |
|---|---|---|---|---|
| Rushville | 13 | $5,460 | $729.07 | 39% |
| Town of Mansfield | 61 | $5,015 | $521.07 | 34% |
| Town of Canandaigua | 80 | $4,790 | $491.27 | 40% |
| Town of Porter | 23 | $4,600 | $340.96 | 51% |
| Town of Pulteney | 66 | $4,208 | $426.72 | 41% |
| Naples | 21 | $4,024 | $503.47 | 41% |
| Town of West Seneca | 20 | $3,735 | $281.70 | 43% |
| North East Township | 42 | $3,527 | $320.86 | 43% |
| Rossmore | 10 | $3,502 | $275.04 | 58% |
| Town of Elma | 11 | $3,444 | $454.59 | 40% |