Town of Ulysses Airbnb Market Analysis 2026: Short Term Rental Data & Vacation Rental Statistics in New York, United States
Is Airbnb profitable in Town of Ulysses in 2026? Explore comprehensive Airbnb analytics for Town of Ulysses, New York, United States to uncover income potential. This 2026 STR market report for Town of Ulysses, based on AirROI data from February 2025 to January 2026, reveals key trends in the niche market of 83 active listings.
Whether you're considering an Airbnb investment in Town of Ulysses, optimizing your existing vacation rental, or exploring rental arbitrage opportunities, understanding the Town of Ulysses Airbnb data is crucial. Leveraging the low regulation environment is key to maximizing your short term rental income potential. Let's dive into the specifics.
Key Town of Ulysses Airbnb Performance Metrics Overview
Monthly Airbnb Revenue Variations & Income Potential in Town of Ulysses (2026)
Understanding the monthly revenue variations for Airbnb listings in Town of Ulysses is key to maximizing your short term rental income potential. Seasonality significantly impacts earnings. Our analysis, based on data from the past 12 months, shows that the peak revenue month for STRs in Town of Ulysses is typically July, while January often presents the lowest earnings, highlighting opportunities for strategic pricing adjustments during shoulder and low seasons. Explore the typical Airbnb income in Town of Ulysses across different performance tiers:
- Best-in-class properties (Top 10%) achieve $9,362+ monthly, often utilizing dynamic pricing and superior guest experiences.
- Strong performing properties (Top 25%) earn $5,402 or more, indicating effective management and desirable locations/amenities.
- Typical properties (Median) generate around $3,037 per month, representing the average market performance.
- Entry-level properties (Bottom 25%) see earnings around $1,403, often with potential for optimization.
Average Monthly Airbnb Earnings Trend in Town of Ulysses
Town of Ulysses Airbnb Occupancy Rate Trends (2026)
Maximize your bookings by understanding the Town of Ulysses STR occupancy trends. Seasonal demand shifts significantly influence how often properties are booked. Typically, Augustsees the highest demand (peak season occupancy), while January experiences the lowest (low season). Effective strategies, like adjusting minimum stays or offering promotions, can boost occupancy during slower periods. Here's how different property tiers perform in Town of Ulysses:
- Best-in-class properties (Top 10%) achieve 76%+ occupancy, indicating high desirability and potentially optimized availability.
- Strong performing properties (Top 25%) maintain 60% or higher occupancy, suggesting good market fit and guest satisfaction.
- Typical properties (Median) have an occupancy rate around 40%.
- Entry-level properties (Bottom 25%) average 17% occupancy, potentially facing higher vacancy.
Average Monthly Occupancy Rate Trend in Town of Ulysses
Average Daily Rate (ADR) Airbnb Trends in Town of Ulysses (2026)
Effective short term rental pricing strategy in Town of Ulysses involves understanding monthly ADR fluctuations. The Average Daily Rate (ADR) for Airbnb in Town of Ulysses typically peaks in July and dips lowest during January. Leveraging Airbnb dynamic pricing tools or strategies based on this seasonality can significantly boost revenue. Here's a look at the typical nightly rates achieved:
- Best-in-class properties (Top 10%) command rates of $818+ per night, often due to premium features or locations.
- Strong performing properties (Top 25%) achieve nightly rates of $414 or more.
- Typical properties (Median) charge around $258 per night.
- Entry-level properties (Bottom 25%) earn around $158 per night.
Average Daily Rate (ADR) Trend by Month in Town of Ulysses
Get Live Town of Ulysses Market Intelligence 👇

Explore Real-time Analytics
Airbnb Seasonality Analysis & Trends in Town of Ulysses (2026)
Peak Season (July, August, June)
- Revenue averages $6,406 per month
- Occupancy rates average 50.2%
- Daily rates average $411
Shoulder Season
- Revenue averages $4,196 per month
- Occupancy maintains around 41.7%
- Daily rates hold near $381
Low Season (January, February, March)
- Revenue drops to average $2,517 per month
- Occupancy decreases to average 29.1%
- Daily rates adjust to average $366
Seasonality Insights for Town of Ulysses
- The Airbnb seasonality in Town of Ulysses shows highly seasonal trends requiring careful strategy. While the sections above show seasonal averages, it's also insightful to look at the extremes:
- During the high season, the absolute peak month showcases Town of Ulysses's highest earning potential, with monthly revenues capable of climbing to $7,148, occupancy reaching a high of 55.7%, and ADRs peaking at $413.
- Conversely, the slowest single month of the year, typically falling within the low season, marks the market's lowest point. In this month, revenue might dip to $2,350, occupancy could drop to 25.4%, and ADRs may adjust down to $363.
- Understanding both the seasonal averages and these monthly peaks and troughs in revenue, occupancy, and ADR is crucial for maximizing your Airbnb profit potential in Town of Ulysses.
Seasonal Strategies for Maximizing Profit
- Peak Season: Maximize revenue through premium pricing and potentially longer minimum stays. Ensure high availability.
- Low Season: Offer competitive pricing, special promotions (e.g., extended stay discounts), and flexible cancellation policies. Target off-season travelers like remote workers or budget-conscious guests.
- Shoulder Seasons: Implement dynamic pricing that balances peak and low rates. Target weekend travelers or specific events. Offer slightly more flexible terms than peak season.
- Regularly analyze your own performance against these Town of Ulysses seasonality benchmarks and adjust your pricing and availability strategy accordingly.
Best Areas for Airbnb Investment in Town of Ulysses (2026)
Exploring the top neighborhoods for short-term rentals in Town of Ulysses? This section highlights key areas, outlining why they are attractive for hosts and guests, along with notable local attractions. Consider these locations based on your target guest profile and investment strategy.
| Neighborhood / Area | Why Host Here? (Target Guests & Appeal) | Key Attractions & Landmarks |
|---|---|---|
| Ithaca | A college town and popular tourist destination known for its stunning gorges and waterfalls. It's home to Cornell University and attracts visitors year-round for academic events, outdoor activities, and cultural festivals. | Cornell University, Ithaca Falls, Buttermilk Falls State Park, Taughannock Falls State Park, The Sciencenter, Ithaca Farmers Market |
| Seneca Lake | The largest of the Finger Lakes and known for its beautiful scenery, wineries, and recreational activities. It's a prime spot for tourism, especially in the summer months. | Seneca Lake Wine Trail, Watkins Glen State Park, Seneca Lake State Park, Finger Lakes Distilling, Glenora Wine Cellars |
| Trumansburg | A charming small town located near many natural attractions, including the Finger Lakes. It's close to both Taughannock Falls and the wineries of Seneca Lake. | Taughannock Falls, Trumansburg Conservatory of Fine Arts, Bullet Creek Park, Murray's Fools, local eateries and shops |
| Cayuga Lake | Another of the Finger Lakes, known for picturesque views and agricultural tourism. Its serene environment attracts visitors interested in relaxation and nature. | Cayuga Lake State Park, Cayuga Vineyards, Aurora, It's a Wonderful Life Museum, Cayuga-Seneca Canal |
| Schuyler County | Located southwest of Ithaca, Schuyler County is known for its outdoor beauty and wine production. It offers a blend of rural charm and tourist attractions. | Watkins Glen International, Zugibe Vineyards, Watkins Glen State Park, Clute Park, Seneca Lake |
| Lodi | A quiet town located between Seneca and Cayuga Lakes. It's famous for its agricultural surroundings and wineries, making it appealing for relaxed getaways. | Lodi Point State Park, Herman J. Wiemer Vineyard, local farm stands, Seneca Lake Wine Trail |
| Newfield | A small town close to Ithaca, ideal for those looking to experience the scenic beauty of the Finger Lakes while being near urban amenities. | Newfield Gorge, local parks, hiking trails, Cascadilla Creek |
| Covert | A peaceful town situated near Seneca Lake, known for its scenic countryside and access to outdoor recreational activities. It offers a quiet retreat. | Seneca Lake, local wineries, farmers markets, scenic byways |
Understanding Airbnb License Requirements & STR Laws in Town of Ulysses (2026)
While Town of Ulysses, New York, United States currently shows low STR regulations, specific Airbnb license requirements might still exist or change. Always verify the latest short term rental regulations and Airbnb license requirements directly with local government authorities for Town of Ulysses to ensure full compliance before hosting.
(Source: AirROI data, 2026, finding no licensed listings among those analyzed)
Top Performing Airbnb Properties in Town of Ulysses (2026)
Benchmark your potential! Explore examples of top-performing Airbnb properties in Town of Ulyssesbased on Trailing Twelve Month (TTM) revenue. Analyze their characteristics, revenue, occupancy rate, and ADR to understand what drives success in this market.
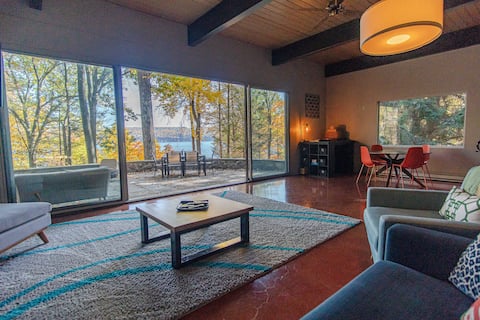
Spacious lakeside mid-century modern home
Entire Place • 4 bedrooms

Come recover from the holidays at Water's Edge!
Entire Place • 3 bedrooms

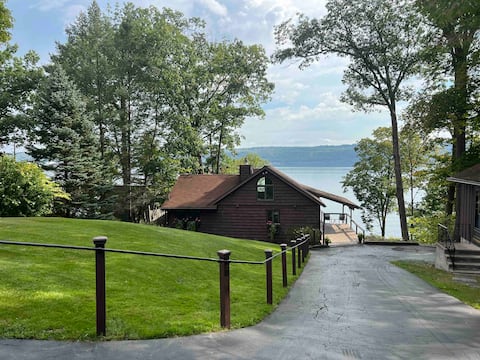
Lakeside cozy cottage
Entire Place • 3 bedrooms

Perry City Manors Retreat Center: Sleeps 16+
Entire Place • 6 bedrooms
It's Great to be on Cayuga
Entire Place • 4 bedrooms

Cayuga Lakeside Cottage
Entire Place • 3 bedrooms
Note: Performance varies based on location, size, amenities, seasonality, and management quality. Data reflects the past 12 months.
Top Performing Airbnb Hosts in Town of Ulysses (2026)
Learn from the best! This table showcases top-performing Airbnb hosts in Town of Ulysses based on the number of properties managed and estimated total revenue over the past year. Analyze their scale and performance metrics.
| Host Name | Properties | Grossing Revenue | Stay Reviews | Avg Rating |
|---|---|---|---|---|
| Magic Castle | 9 | $338,809 | 1176 | 4.91/5.0 |
| Lex Enrico | 7 | $222,788 | 532 | 4.92/5.0 |
| John | 1 | $168,255 | 101 | 4.96/5.0 |
| Craig | 3 | $160,481 | 308 | 4.92/5.0 |
| Mario | 2 | $153,605 | 78 | 4.98/5.0 |
| Ardys | 1 | $149,862 | 19 | 5.00/5.0 |
| Amanda | 1 | $147,290 | 2 | Not Rated |
| Inn At Taughannock Falls | 9 | $127,870 | 28 | 4.90/5.0 |
| Jennifer | 1 | $125,935 | 33 | 4.91/5.0 |
| R.J. | 2 | $110,940 | 28 | 5.00/5.0 |
Analyzing the strategies of top hosts, such as their property selection, pricing, and guest communication, can offer valuable lessons for optimizing your own Airbnb operations in Town of Ulysses.
Dive Deeper: Advanced Town of Ulysses STR Market Data (2026)
Ready to unlock more insights? AirROI provides access to advanced metrics and comprehensive Airbnb data for Town of Ulysses. Explore detailed analytics beyond this report to refine your investment strategy, optimize pricing, and maximize your vacation rental profits.
Explore Advanced MetricsTown of Ulysses Short-Term Rental Market Composition (2026): Property & Room Types
Room Type Distribution
Property Type Distribution
Market Composition Insights for Town of Ulysses
- The Town of Ulysses Airbnb market composition is heavily skewed towards Entire Home/Apt listings, which make up 78.3% of the 83 active rentals. This indicates strong guest preference for privacy and space.
- Looking at the property type distribution in Town of Ulysses, House properties are the most common (61.4%), reflecting the local real estate landscape.
- Houses represent a significant 61.4% portion, catering likely to families or larger groups.
- The presence of 12% Hotel/Boutique listings indicates integration with traditional hospitality.
- Smaller segments like unique stays (combined 2.4%) offer potential for unique stay experiences.
Town of Ulysses Airbnb Room Capacity Analysis (2026): Bedroom Distribution
Distribution of Listings by Number of Bedrooms
Room Capacity Insights for Town of Ulysses
- The dominant room capacity in Town of Ulysses is 1 bedroom listings, making up 36.1% of the market. This suggests a strong demand for properties suitable for couples or solo travelers.
- Together, 1 bedroom and 3 bedrooms properties represent 55.4% of the active Airbnb listings in Town of Ulysses, indicating a high concentration in these sizes.
- A significant 34.9% of listings offer 3+ bedrooms, catering to larger groups and families seeking more space in Town of Ulysses.
Town of Ulysses Vacation Rental Guest Capacity Trends (2026)
Distribution of Listings by Guest Capacity
Guest Capacity Insights for Town of Ulysses
- The most common guest capacity trend in Town of Ulysses vacation rentals is listings accommodating 8+ guests (24.1%). This suggests the primary traveler segment is likely larger groups.
- Properties designed for 8+ guests and 2 guests dominate the Town of Ulysses STR market, accounting for 47.0% of listings.
- 39.7% of properties accommodate 6+ guests, serving the market segment for larger families or group travel in Town of Ulysses.
- On average, properties in Town of Ulysses are equipped to host 4.6 guests.
Town of Ulysses Airbnb Booking Patterns (2026): Available vs. Booked Days
Available Days Distribution
Booked Days Distribution
Booking Pattern Insights for Town of Ulysses
- The most common availability pattern in Town of Ulysses falls within the 271-366 days range, representing 48.2% of listings. This suggests many properties have significant open periods on their calendars.
- Approximately 79.5% of listings show high availability (181+ days open annually), indicating potential for increased bookings or specific owner usage patterns.
- For booked days, the 91-180 days range is most frequent in Town of Ulysses (28.9%), reflecting common guest stay durations or potential owner blocking patterns.
- A notable 22.9% of properties secure long booking periods (181+ days booked per year), highlighting successful long-term rental strategies or significant owner usage.
Town of Ulysses Airbnb Minimum Stay Requirements Analysis
Distribution of Listings by Minimum Night Requirement
1 Night
36 listings
43.4% of total
2 Nights
17 listings
20.5% of total
3 Nights
7 listings
8.4% of total
4-6 Nights
2 listings
2.4% of total
30+ Nights
21 listings
25.3% of total
Key Insights
- The most prevalent minimum stay requirement in Town of Ulysses is 1 Night, adopted by 43.4% of listings. This highlights the market's preference for shorter, flexible bookings.
- A strong majority (63.9%) of the Town of Ulysses Airbnb data shows acceptance of very short stays (1-2 nights), indicating a dynamic, high-turnover market.
- A significant segment (25.3%) caters to monthly stays (30+ nights) in Town of Ulysses, pointing to opportunities in the extended-stay market.
Recommendations
- Align with the market by considering a 1 Night minimum stay, as 43.4% of Town of Ulysses hosts use this setting.
- Explore offering discounts for stays of 30+ nights to attract the 25.3% of the market seeking extended stays.
- Adjust minimum nights based on seasonality – potentially shorter during low season and longer during peak demand periods in Town of Ulysses.
Town of Ulysses Airbnb Cancellation Policy Trends Analysis (2026)
Limited
4 listings
4.8% of total
Super Strict 30 Days
1 listings
1.2% of total
Flexible
9 listings
10.8% of total
Moderate
25 listings
30.1% of total
Firm
33 listings
39.8% of total
Strict
11 listings
13.3% of total
Cancellation Policy Insights for Town of Ulysses
- The prevailing Airbnb cancellation policy trend in Town of Ulysses is Firm, used by 39.8% of listings.
- A majority (53.1%) of hosts in Town of Ulysses utilize Firm or Strict policies, indicating a market where hosts prioritize booking security.
Recommendations for Hosts
- Consider adopting a Firm policy to align with the 39.8% market standard in Town of Ulysses.
- Using a Strict policy might deter some guests, as only 13.3% of listings use it. Evaluate if potential revenue protection outweighs possible lower booking rates.
- Regularly review your cancellation policy against competitors and market demand shifts in Town of Ulysses.
Town of Ulysses STR Booking Lead Time Analysis (2026)
Average Booking Lead Time by Month
Booking Lead Time Insights for Town of Ulysses
- The overall average booking lead time for vacation rentals in Town of Ulysses is 84 days.
- Guests book furthest in advance for stays during May (average 164 days), likely coinciding with peak travel demand or local events.
- The shortest booking windows occur for stays in January (average 21 days), indicating more last-minute travel plans during this time.
- Seasonally, Spring (106 days avg.) sees the longest lead times, while Winter (30 days avg.) has the shortest, reflecting typical travel planning cycles.
Recommendations for Hosts
- Use the overall average lead time (84 days) as a baseline for your pricing and availability strategy in Town of Ulysses.
- For May stays, consider implementing length-of-stay discounts or slightly higher rates for bookings made less than 164 days out to capitalize on advance planning.
- Target marketing efforts for the Spring season well in advance (at least 106 days) to capture early planners.
- Monitor your own booking lead times against these Town of Ulysses averages to identify opportunities for dynamic pricing adjustments.
Popular & Essential Airbnb Amenities in Town of Ulysses (2026)
Amenity Prevalence
Amenity Insights for Town of Ulysses
- Essential amenities in Town of Ulysses that guests expect include: Free parking on premises, Smoke alarm, Wifi. Lacking these (any) could significantly impact bookings.
- Popular amenities like Hot water, Fire extinguisher, Coffee maker are common but not universal. Offering these can provide a competitive edge.
Recommendations for Hosts
- Ensure your listing includes all essential amenities for Town of Ulysses: Free parking on premises, Smoke alarm, Wifi.
- Prioritize adding missing essentials: Smoke alarm, Wifi.
- Consider adding popular differentiators like Hot water or Fire extinguisher to increase appeal.
- Highlight unique or less common amenities you offer (e.g., hot tub, dedicated workspace, EV charger) in your listing description and photos.
- Regularly check competitor amenities in Town of Ulysses to stay competitive.
Town of Ulysses Airbnb Guest Demographics & Profile Analysis (2026)
Guest Profile Summary for Town of Ulysses
- The typical guest profile for Airbnb in Town of Ulysses consists of primarily domestic travelers (95%), often arriving from nearby New York, typically belonging to the Post-2000s (Gen Z/Alpha) group (50%), primarily speaking English or Spanish.
- Domestic travelers account for 95.2% of guests.
- Key international markets include United States (95.2%) and Canada (1.3%).
- Top languages spoken are English (70.8%) followed by Spanish (11.2%).
- A significant demographic segment is the Post-2000s (Gen Z/Alpha) group, representing 50% of guests.
Recommendations for Hosts
- Target domestic marketing efforts towards travelers from New York and Rochester.
- Tailor amenities and listing descriptions to appeal to the dominant Post-2000s (Gen Z/Alpha) demographic (e.g., highlight fast WiFi, smart home features, local guides).
- Highlight unique local experiences or amenities relevant to the primary guest profile.
- Consider seasonal promotions aligned with peak travel times for key origin markets.
Nearby Short-Term Rental Market Comparison
How does the Town of Ulysses Airbnb market stack up against its neighbors? Compare key performance metrics like average monthly revenue, ADR, and occupancy rates in surrounding areas to understand the broader regional STR landscape.
| Market | Active Properties | Monthly Revenue | Daily Rate | Avg. Occupancy |
|---|---|---|---|---|
| Freeland | 11 | $8,436 | $684.29 | 42% |
| Town of Trenton | 13 | $7,410 | $484.59 | 43% |
| Berlin Township | 15 | $7,208 | $729.10 | 35% |
| Stroud Township | 137 | $5,728 | $478.40 | 40% |
| Town of Torrey | 34 | $5,535 | $437.35 | 50% |
| Mount Pocono | 22 | $5,346 | $485.18 | 45% |
| Rushville | 16 | $5,126 | $656.66 | 41% |
| Pocono Summit | 11 | $5,114 | $548.58 | 43% |
| Pocono Township | 98 | $4,998 | $472.46 | 35% |
| Penn Estates | 47 | $4,823 | $412.20 | 44% |