Town of Southold Airbnb Market Analysis 2026: Short Term Rental Data & Vacation Rental Statistics in New York, United States
Is Airbnb profitable in Town of Southold in 2026? Explore comprehensive Airbnb analytics for Town of Southold, New York, United States to uncover income potential. This 2026 STR market report for Town of Southold, based on AirROI data from February 2025 to January 2026, reveals key trends in the market of 489 active listings.
Whether you're considering an Airbnb investment in Town of Southold, optimizing your existing vacation rental, or exploring rental arbitrage opportunities, understanding the Town of Southold Airbnb data is crucial. Leveraging the low regulation environment is key to maximizing your short term rental income potential. Let's dive into the specifics.
Key Town of Southold Airbnb Performance Metrics Overview
Monthly Airbnb Revenue Variations & Income Potential in Town of Southold (2026)
Understanding the monthly revenue variations for Airbnb listings in Town of Southold is key to maximizing your short term rental income potential. Seasonality significantly impacts earnings. Our analysis, based on data from the past 12 months, shows that the peak revenue month for STRs in Town of Southold is typically August, while January often presents the lowest earnings, highlighting opportunities for strategic pricing adjustments during shoulder and low seasons. Explore the typical Airbnb income in Town of Southold across different performance tiers:
- Best-in-class properties (Top 10%) achieve $13,572+ monthly, often utilizing dynamic pricing and superior guest experiences.
- Strong performing properties (Top 25%) earn $8,368 or more, indicating effective management and desirable locations/amenities.
- Typical properties (Median) generate around $4,641 per month, representing the average market performance.
- Entry-level properties (Bottom 25%) see earnings around $2,440, often with potential for optimization.
Average Monthly Airbnb Earnings Trend in Town of Southold
Town of Southold Airbnb Occupancy Rate Trends (2026)
Maximize your bookings by understanding the Town of Southold STR occupancy trends. Seasonal demand shifts significantly influence how often properties are booked. Typically, Augustsees the highest demand (peak season occupancy), while January experiences the lowest (low season). Effective strategies, like adjusting minimum stays or offering promotions, can boost occupancy during slower periods. Here's how different property tiers perform in Town of Southold:
- Best-in-class properties (Top 10%) achieve 66%+ occupancy, indicating high desirability and potentially optimized availability.
- Strong performing properties (Top 25%) maintain 47% or higher occupancy, suggesting good market fit and guest satisfaction.
- Typical properties (Median) have an occupancy rate around 30%.
- Entry-level properties (Bottom 25%) average 15% occupancy, potentially facing higher vacancy.
Average Monthly Occupancy Rate Trend in Town of Southold
Average Daily Rate (ADR) Airbnb Trends in Town of Southold (2026)
Effective short term rental pricing strategy in Town of Southold involves understanding monthly ADR fluctuations. The Average Daily Rate (ADR) for Airbnb in Town of Southold typically peaks in August and dips lowest during February. Leveraging Airbnb dynamic pricing tools or strategies based on this seasonality can significantly boost revenue. Here's a look at the typical nightly rates achieved:
- Best-in-class properties (Top 10%) command rates of $1,122+ per night, often due to premium features or locations.
- Strong performing properties (Top 25%) achieve nightly rates of $761 or more.
- Typical properties (Median) charge around $527 per night.
- Entry-level properties (Bottom 25%) earn around $377 per night.
Average Daily Rate (ADR) Trend by Month in Town of Southold
Get Live Town of Southold Market Intelligence 👇

Explore Real-time Analytics
Airbnb Seasonality Analysis & Trends in Town of Southold (2026)
Peak Season (August, July, June)
- Revenue averages $11,596 per month
- Occupancy rates average 49.7%
- Daily rates average $703
Shoulder Season
- Revenue averages $5,277 per month
- Occupancy maintains around 30.9%
- Daily rates hold near $622
Low Season (January, February, December)
- Revenue drops to average $3,056 per month
- Occupancy decreases to average 21.4%
- Daily rates adjust to average $604
Seasonality Insights for Town of Southold
- The Airbnb seasonality in Town of Southold shows highly seasonal trends requiring careful strategy. While the sections above show seasonal averages, it's also insightful to look at the extremes:
- During the high season, the absolute peak month showcases Town of Southold's highest earning potential, with monthly revenues capable of climbing to $14,353, occupancy reaching a high of 59.0%, and ADRs peaking at $711.
- Conversely, the slowest single month of the year, typically falling within the low season, marks the market's lowest point. In this month, revenue might dip to $2,670, occupancy could drop to 18.2%, and ADRs may adjust down to $575.
- Understanding both the seasonal averages and these monthly peaks and troughs in revenue, occupancy, and ADR is crucial for maximizing your Airbnb profit potential in Town of Southold.
Seasonal Strategies for Maximizing Profit
- Peak Season: Maximize revenue through premium pricing and potentially longer minimum stays. Ensure high availability.
- Low Season: Offer competitive pricing, special promotions (e.g., extended stay discounts), and flexible cancellation policies. Target off-season travelers like remote workers or budget-conscious guests.
- Shoulder Seasons: Implement dynamic pricing that balances peak and low rates. Target weekend travelers or specific events. Offer slightly more flexible terms than peak season.
- Regularly analyze your own performance against these Town of Southold seasonality benchmarks and adjust your pricing and availability strategy accordingly.
Best Areas for Airbnb Investment in Town of Southold (2026)
Exploring the top neighborhoods for short-term rentals in Town of Southold? This section highlights key areas, outlining why they are attractive for hosts and guests, along with notable local attractions. Consider these locations based on your target guest profile and investment strategy.
| Neighborhood / Area | Why Host Here? (Target Guests & Appeal) | Key Attractions & Landmarks |
|---|---|---|
| Southold Town Center | The Town Center is the heart of Southold, offering a mix of shops, restaurants, and local attractions. It's popular with visitors wanting easy access to various local amenities, parks, and events. | Southold Historical Society Museum, Founders Landing Park, Breweries in North Fork, Local Farmers Markets, Nearby Wineries |
| Greenport | Greenport is a picturesque waterfront village known for its charming shops, restaurants, and scenic views. It's a top destination for tourists seeking a quaint, maritime atmosphere with plenty of activities. | Greenport Harbor Brewing Co., East End Seaport Museum & Marine Foundation, Long Island Science Center, Port of Greenport, Local wineries and vineyards |
| Mattituck | Mattituck combines rural charm with a variety of family attractions, making it ideal for family-friendly stays. It's located near the beach and several vineyard options. | Mattituck Creek County Park, Local Vineyards, Bayside Marina, Agricultural fairs, Close proximity to beaches |
| Jamesport | Jamesport is a quiet, residential area that attracts those looking for a peaceful getaway, while still being close to attractions in the North Fork region. Perfect for relaxation and escape. | Jamesport Vineyards, Local farm stands, Beaches at nearby Hampton Bays, Biking trails, Potato fields and agricultural tours |
| Peconic | Peconic is known for its beautiful landscapes and proximity to nature reserves. Attracts visitors who appreciate outdoor activities, especially wine-tasting tours in the North Fork. | Bailie Beach Park, Peconic River Kayaking, Local vineyards, Summer Farmers Markets, Nature hikes in the area |
| Matters Beach | Matters Beach is a small, scenic beach area that attracts visitors looking for sun and relaxation. Ideal for families and small gatherings, it's perfect for those wanting a beach experience. | Matters Beach, Picnic spots and relaxation areas, Local seafood shacks, Water sports activities, Sunset views |
| Cutchogue | Cutchogue is famous for its wineries and farms, giving visitors a taste of the North Fork's agriculture. It's popular among those looking for a unique, rural stay. | Cutchogue Harbor, Local wineries, Wine tastings and tours, Historical landmarks, Farmers markets |
| Orient Point | Orient Point is at the tip of the North Fork, known for its beach access and ferry services. Great for adventurous visitors wanting to explore nearby areas, including Shelter Island. | Orient Beach State Park, Ferry to Shelter Island, Historic Orient Point Lighthouse, Local fishing spots, Natural hiking trails |
Understanding Airbnb License Requirements & STR Laws in Town of Southold (2026)
While Town of Southold, New York, United States currently shows low STR regulations, specific Airbnb license requirements might still exist or change. Always verify the latest short term rental regulations and Airbnb license requirements directly with local government authorities for Town of Southold to ensure full compliance before hosting.
(Source: AirROI data, 2026, based on 1% licensed listings)
Top Performing Airbnb Properties in Town of Southold (2026)
Benchmark your potential! Explore examples of top-performing Airbnb properties in Town of Southoldbased on Trailing Twelve Month (TTM) revenue. Analyze their characteristics, revenue, occupancy rate, and ADR to understand what drives success in this market.

North Fork Modern Farmhouse
Entire Place • 4 bedrooms

Greenport Beach House
Entire Place • 6 bedrooms

Stunning 6br Waterfront Greenport Beach house
Entire Place • 6 bedrooms
Stunning Beachfront Home ~ Family Friendly
Entire Place • 5 bedrooms

New! 6BR, 4.5 Bath, Pool, Hot Tub, Walk to Beach
Entire Place • 6 bedrooms
NEW Southold North Fork beach house on the water
Entire Place • 3 bedrooms
Note: Performance varies based on location, size, amenities, seasonality, and management quality. Data reflects the past 12 months.
Top Performing Airbnb Hosts in Town of Southold (2026)
Learn from the best! This table showcases top-performing Airbnb hosts in Town of Southold based on the number of properties managed and estimated total revenue over the past year. Analyze their scale and performance metrics.
| Host Name | Properties | Grossing Revenue | Stay Reviews | Avg Rating |
|---|---|---|---|---|
| LuxuryBeachGetaway | 8 | $441,684 | 61 | 4.69/5.0 |
| Gasper | 5 | $383,145 | 333 | 4.95/5.0 |
| Meredith | 2 | $321,876 | 71 | 4.99/5.0 |
| Anthony | 2 | $307,212 | 135 | 4.88/5.0 |
| Dogan | 1 | $287,276 | 10 | 5.00/5.0 |
| Alice | 2 | $276,994 | 196 | 4.87/5.0 |
| Marilyn | 4 | $275,462 | 44 | 4.88/5.0 |
| Antonia | 1 | $274,732 | 125 | 4.97/5.0 |
| StayMarquis | 5 | $270,067 | 28 | 4.88/5.0 |
| Sofia Victoria | 6 | $268,420 | 115 | 4.93/5.0 |
Analyzing the strategies of top hosts, such as their property selection, pricing, and guest communication, can offer valuable lessons for optimizing your own Airbnb operations in Town of Southold.
Dive Deeper: Advanced Town of Southold STR Market Data (2026)
Ready to unlock more insights? AirROI provides access to advanced metrics and comprehensive Airbnb data for Town of Southold. Explore detailed analytics beyond this report to refine your investment strategy, optimize pricing, and maximize your vacation rental profits.
Explore Advanced MetricsTown of Southold Short-Term Rental Market Composition (2026): Property & Room Types
Room Type Distribution
Property Type Distribution
Market Composition Insights for Town of Southold
- The Town of Southold Airbnb market composition is heavily skewed towards Entire Home/Apt listings, which make up 92.2% of the 489 active rentals. This indicates strong guest preference for privacy and space.
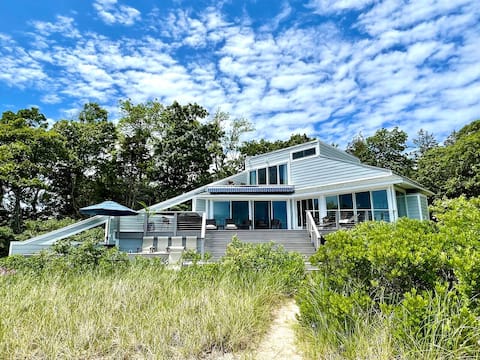
- Looking at the property type distribution in Town of Southold, House properties are the most common (79.3%), reflecting the local real estate landscape.
- Houses represent a significant 79.3% portion, catering likely to families or larger groups.
- The presence of 6.3% Hotel/Boutique listings indicates integration with traditional hospitality.
- Smaller segments like others, outdoor/unique (combined 3.2%) offer potential for unique stay experiences.
Town of Southold Airbnb Room Capacity Analysis (2026): Bedroom Distribution
Distribution of Listings by Number of Bedrooms
Room Capacity Insights for Town of Southold
- The dominant room capacity in Town of Southold is 3 bedrooms listings, making up 32.1% of the market. This suggests a strong demand for properties suitable for families or small groups.
- Together, 3 bedrooms and 4 bedrooms properties represent 55.0% of the active Airbnb listings in Town of Southold, indicating a high concentration in these sizes.
- A significant 63.8% of listings offer 3+ bedrooms, catering to larger groups and families seeking more space in Town of Southold.
Town of Southold Vacation Rental Guest Capacity Trends (2026)
Distribution of Listings by Guest Capacity
Guest Capacity Insights for Town of Southold
- The most common guest capacity trend in Town of Southold vacation rentals is listings accommodating 8+ guests (37.6%). This suggests the primary traveler segment is likely larger groups.
- Properties designed for 8+ guests and 6 guests dominate the Town of Southold STR market, accounting for 64.4% of listings.
- 66.9% of properties accommodate 6+ guests, serving the market segment for larger families or group travel in Town of Southold.
- On average, properties in Town of Southold are equipped to host 5.8 guests.
Town of Southold Airbnb Booking Patterns (2026): Available vs. Booked Days
Available Days Distribution
Booked Days Distribution
Booking Pattern Insights for Town of Southold
- The most common availability pattern in Town of Southold falls within the 271-366 days range, representing 62.8% of listings. This suggests many properties have significant open periods on their calendars.
- Approximately 93.1% of listings show high availability (181+ days open annually), indicating potential for increased bookings or specific owner usage patterns.
- For booked days, the 31-90 days range is most frequent in Town of Southold (40.1%), reflecting common guest stay durations or potential owner blocking patterns.
- A notable 8.0% of properties secure long booking periods (181+ days booked per year), highlighting successful long-term rental strategies or significant owner usage.
Town of Southold Airbnb Minimum Stay Requirements Analysis
Distribution of Listings by Minimum Night Requirement
1 Night
47 listings
9.6% of total
2 Nights
74 listings
15.1% of total
3 Nights
27 listings
5.5% of total
4-6 Nights
52 listings
10.6% of total
7-29 Nights
114 listings
23.3% of total
30+ Nights
175 listings
35.8% of total
Key Insights
- The most prevalent minimum stay requirement in Town of Southold is 30+ Nights, adopted by 35.8% of listings. This highlights the market's preference for longer commitments.
- A significant segment (35.8%) caters to monthly stays (30+ nights) in Town of Southold, pointing to opportunities in the extended-stay market.
Recommendations
- Align with the market by considering a 30+ Nights minimum stay, as 35.8% of Town of Southold hosts use this setting.
- If feasible, allowing 1-night stays, especially midweek or during low season, could capture last-minute bookings, as only 9.6% currently do.
- Explore offering discounts for stays of 30+ nights to attract the 35.8% of the market seeking extended stays.
- Adjust minimum nights based on seasonality – potentially shorter during low season and longer during peak demand periods in Town of Southold.
Town of Southold Airbnb Cancellation Policy Trends Analysis (2026)
Limited
4 listings
0.8% of total
Super Strict 60 Days
9 listings
1.8% of total
Super Strict 30 Days
11 listings
2.2% of total
Flexible
34 listings
7% of total
Moderate
66 listings
13.5% of total
Firm
223 listings
45.6% of total
Strict
142 listings
29% of total
Cancellation Policy Insights for Town of Southold
- The prevailing Airbnb cancellation policy trend in Town of Southold is Firm, used by 45.6% of listings.
- A majority (74.6%) of hosts in Town of Southold utilize Firm or Strict policies, indicating a market where hosts prioritize booking security.
Recommendations for Hosts
- Consider adopting a Firm policy to align with the 45.6% market standard in Town of Southold.
- Regularly review your cancellation policy against competitors and market demand shifts in Town of Southold.
Town of Southold STR Booking Lead Time Analysis (2026)
Average Booking Lead Time by Month
Booking Lead Time Insights for Town of Southold
- The overall average booking lead time for vacation rentals in Town of Southold is 66 days.
- Guests book furthest in advance for stays during August (average 103 days), likely coinciding with peak travel demand or local events.
- The shortest booking windows occur for stays in February (average 26 days), indicating more last-minute travel plans during this time.
- Seasonally, Summer (86 days avg.) sees the longest lead times, while Winter (32 days avg.) has the shortest, reflecting typical travel planning cycles.
Recommendations for Hosts
- Use the overall average lead time (66 days) as a baseline for your pricing and availability strategy in Town of Southold.
- For August stays, consider implementing length-of-stay discounts or slightly higher rates for bookings made less than 103 days out to capitalize on advance planning.
- Target marketing efforts for the Summer season well in advance (at least 86 days) to capture early planners.
- Monitor your own booking lead times against these Town of Southold averages to identify opportunities for dynamic pricing adjustments.
Popular & Essential Airbnb Amenities in Town of Southold (2026)
Amenity Prevalence
Amenity Insights for Town of Southold
- Essential amenities in Town of Southold that guests expect include: Wifi, Smoke alarm, Air conditioning, Carbon monoxide alarm. Lacking these (any) could significantly impact bookings.
- Popular amenities like TV, Heating, Free parking on premises are common but not universal. Offering these can provide a competitive edge.
Recommendations for Hosts
- Ensure your listing includes all essential amenities for Town of Southold: Wifi, Smoke alarm, Air conditioning, Carbon monoxide alarm.
- Prioritize adding missing essentials: Wifi, Smoke alarm, Air conditioning, Carbon monoxide alarm.
- Consider adding popular differentiators like TV or Heating to increase appeal.
- Highlight unique or less common amenities you offer (e.g., hot tub, dedicated workspace, EV charger) in your listing description and photos.
- Regularly check competitor amenities in Town of Southold to stay competitive.
Town of Southold Airbnb Guest Demographics & Profile Analysis (2026)
Guest Profile Summary for Town of Southold
- The typical guest profile for Airbnb in Town of Southold consists of primarily domestic travelers (96%), often arriving from nearby New York, typically belonging to the Post-2000s (Gen Z/Alpha) group (50%), primarily speaking English or Spanish.
- Domestic travelers account for 95.9% of guests.
- Key international markets include United States (95.9%) and United Kingdom (0.9%).
- Top languages spoken are English (65%) followed by Spanish (13.1%).
- A significant demographic segment is the Post-2000s (Gen Z/Alpha) group, representing 50% of guests.
Recommendations for Hosts
- Target domestic marketing efforts towards travelers from New York and Boston.
- Tailor amenities and listing descriptions to appeal to the dominant Post-2000s (Gen Z/Alpha) demographic (e.g., highlight fast WiFi, smart home features, local guides).
- Highlight unique local experiences or amenities relevant to the primary guest profile.
- Consider seasonal promotions aligned with peak travel times for key origin markets.
Nearby Short-Term Rental Market Comparison
How does the Town of Southold Airbnb market stack up against its neighbors? Compare key performance metrics like average monthly revenue, ADR, and occupancy rates in surrounding areas to understand the broader regional STR landscape.
| Market | Active Properties | Monthly Revenue | Daily Rate | Avg. Occupancy |
|---|---|---|---|---|
| Sag Harbor | 15 | $6,129 | $1280.84 | 40% |
| Town of East Hampton | 1,327 | $5,945 | $986.02 | 36% |
| Middletown | 395 | $5,781 | $589.01 | 45% |
| North Andover | 12 | $5,625 | $440.84 | 45% |
| Town of Southampton | 1,201 | $5,620 | $1002.45 | 33% |
| Town of Ancram | 22 | $5,616 | $512.55 | 38% |
| Southampton | 19 | $5,405 | $1456.43 | 30% |
| New Shoreham | 120 | $5,359 | $637.79 | 45% |
| Wellesley | 22 | $5,310 | $520.90 | 50% |
| Monmouth Beach | 12 | $5,209 | $794.91 | 38% |