Town of Shawangunk Airbnb Market Analysis 2026: Short Term Rental Data & Vacation Rental Statistics in New York, United States
Is Airbnb profitable in Town of Shawangunk in 2026? Explore comprehensive Airbnb analytics for Town of Shawangunk, New York, United States to uncover income potential. This 2026 STR market report for Town of Shawangunk, based on AirROI data from February 2025 to January 2026, reveals key trends in the niche market of 32 active listings.
Whether you're considering an Airbnb investment in Town of Shawangunk, optimizing your existing vacation rental, or exploring rental arbitrage opportunities, understanding the Town of Shawangunk Airbnb data is crucial. Leveraging the low regulation environment is key to maximizing your short term rental income potential. Let's dive into the specifics.
Key Town of Shawangunk Airbnb Performance Metrics Overview
Monthly Airbnb Revenue Variations & Income Potential in Town of Shawangunk (2026)
Understanding the monthly revenue variations for Airbnb listings in Town of Shawangunk is key to maximizing your short term rental income potential. Seasonality significantly impacts earnings. Our analysis, based on data from the past 12 months, shows that the peak revenue month for STRs in Town of Shawangunk is typically August, while January often presents the lowest earnings, highlighting opportunities for strategic pricing adjustments during shoulder and low seasons. Explore the typical Airbnb income in Town of Shawangunk across different performance tiers:
- Best-in-class properties (Top 10%) achieve $9,565+ monthly, often utilizing dynamic pricing and superior guest experiences.
- Strong performing properties (Top 25%) earn $6,504 or more, indicating effective management and desirable locations/amenities.
- Typical properties (Median) generate around $3,823 per month, representing the average market performance.
- Entry-level properties (Bottom 25%) see earnings around $2,070, often with potential for optimization.
Average Monthly Airbnb Earnings Trend in Town of Shawangunk
Town of Shawangunk Airbnb Occupancy Rate Trends (2026)
Maximize your bookings by understanding the Town of Shawangunk STR occupancy trends. Seasonal demand shifts significantly influence how often properties are booked. Typically, Augustsees the highest demand (peak season occupancy), while January experiences the lowest (low season). Effective strategies, like adjusting minimum stays or offering promotions, can boost occupancy during slower periods. Here's how different property tiers perform in Town of Shawangunk:
- Best-in-class properties (Top 10%) achieve 76%+ occupancy, indicating high desirability and potentially optimized availability.
- Strong performing properties (Top 25%) maintain 62% or higher occupancy, suggesting good market fit and guest satisfaction.
- Typical properties (Median) have an occupancy rate around 42%.
- Entry-level properties (Bottom 25%) average 23% occupancy, potentially facing higher vacancy.
Average Monthly Occupancy Rate Trend in Town of Shawangunk
Average Daily Rate (ADR) Airbnb Trends in Town of Shawangunk (2026)
Effective short term rental pricing strategy in Town of Shawangunk involves understanding monthly ADR fluctuations. The Average Daily Rate (ADR) for Airbnb in Town of Shawangunk typically peaks in July and dips lowest during March. Leveraging Airbnb dynamic pricing tools or strategies based on this seasonality can significantly boost revenue. Here's a look at the typical nightly rates achieved:
- Best-in-class properties (Top 10%) command rates of $961+ per night, often due to premium features or locations.
- Strong performing properties (Top 25%) achieve nightly rates of $412 or more.
- Typical properties (Median) charge around $271 per night.
- Entry-level properties (Bottom 25%) earn around $180 per night.
Average Daily Rate (ADR) Trend by Month in Town of Shawangunk
Get Live Town of Shawangunk Market Intelligence 👇

Explore Real-time Analytics
Airbnb Seasonality Analysis & Trends in Town of Shawangunk (2026)
Peak Season (August, July, October)
- Revenue averages $7,152 per month
- Occupancy rates average 56.5%
- Daily rates average $415
Shoulder Season
- Revenue averages $4,457 per month
- Occupancy maintains around 41.0%
- Daily rates hold near $405
Low Season (January, February, March)
- Revenue drops to average $3,151 per month
- Occupancy decreases to average 35.3%
- Daily rates adjust to average $386
Seasonality Insights for Town of Shawangunk
- The Airbnb seasonality in Town of Shawangunk shows highly seasonal trends requiring careful strategy. While the sections above show seasonal averages, it's also insightful to look at the extremes:
- During the high season, the absolute peak month showcases Town of Shawangunk's highest earning potential, with monthly revenues capable of climbing to $7,902, occupancy reaching a high of 58.2%, and ADRs peaking at $418.
- Conversely, the slowest single month of the year, typically falling within the low season, marks the market's lowest point. In this month, revenue might dip to $2,723, occupancy could drop to 24.1%, and ADRs may adjust down to $380.
- Understanding both the seasonal averages and these monthly peaks and troughs in revenue, occupancy, and ADR is crucial for maximizing your Airbnb profit potential in Town of Shawangunk.
Seasonal Strategies for Maximizing Profit
- Peak Season: Maximize revenue through premium pricing and potentially longer minimum stays. Ensure high availability.
- Low Season: Offer competitive pricing, special promotions (e.g., extended stay discounts), and flexible cancellation policies. Target off-season travelers like remote workers or budget-conscious guests.
- Shoulder Seasons: Implement dynamic pricing that balances peak and low rates. Target weekend travelers or specific events. Offer slightly more flexible terms than peak season.
- Regularly analyze your own performance against these Town of Shawangunk seasonality benchmarks and adjust your pricing and availability strategy accordingly.
Best Areas for Airbnb Investment in Town of Shawangunk (2026)
Exploring the top neighborhoods for short-term rentals in Town of Shawangunk? This section highlights key areas, outlining why they are attractive for hosts and guests, along with notable local attractions. Consider these locations based on your target guest profile and investment strategy.
| Neighborhood / Area | Why Host Here? (Target Guests & Appeal) | Key Attractions & Landmarks |
|---|---|---|
| Gunks | The Shawangunk Mountain range offers stunning natural beauty and attracts outdoor enthusiasts for hiking, climbing, and nature exploration. Ideal for tourists looking for adventure and relaxation in a scenic setting. | Minnewaska State Park, Mohonk Preserve, The Gunks Climbing Area, Lake Minnewaska, Hiking Trails |
| New Paltz | A charming college town full of historic architecture and vibrant arts scene. Popular for its eclectic eateries, shops and proximity to the Hudson Valley attractions. | Historic Huguenot Street, The Wallkill Valley Rail Trail, Mohonk Mountain House, New Paltz Farmers Market, Bread Alone Bakery |
| Wallkill | A suburban area that offers a mix of rural charm and proximity to urban amenities. Great for families and those looking for quieter stays while being near attractions. | Wallkill River, Locust Grove Estate, The Orange County Farmers Museum, Hiking Trails, Local vineyards |
| Kerhonkson | A small town that provides access to nature and outdoor activities, especially for those who enjoy a rustic retreat. Known for its farms and natural landscapes. | The Catskill Forest Preserve, The Ashokan Reservoir, Local Orchards, Woodstock nearby, Hiking and camping spots |
| Rosendale | Known for its historic canal and vibrant arts community, Rosendale is becoming popular due to its scenic beauty and cultural offerings. | Rosendale Trestle, Film Festivals, Art Galleries, Local Shops, Rosendale Theater |
| Bard College | A prestigious liberal arts college located in Annandale-on-Hudson, attracting visitors for events, performances, and educational offerings. | The Fisher Center for the Performing Arts, Historic Buildings, Local Cafes, Hudson River views, Cultural events and festivals |
| Highfalls | A quiet hamlet offering a mix of outdoor activities and artistic charm. Known for its natural waterfalls and small-town feel. | High Falls, Esopus Creek, Local Artisans, Hiking Trails, Scenic Views |
| Pine Bush | A growing community known for its scenic landscapes and the nearby Minnewaska State Park. Attracts nature lovers and those seeking tranquility. | Minnewaska State Park, Pine Bush Preserve, Local Wineries, Hiking and biking trails, Nearby quaint shops |
Understanding Airbnb License Requirements & STR Laws in Town of Shawangunk (2026)
While Town of Shawangunk, New York, United States currently shows low STR regulations, specific Airbnb license requirements might still exist or change. Always verify the latest short term rental regulations and Airbnb license requirements directly with local government authorities for Town of Shawangunk to ensure full compliance before hosting.
(Source: AirROI data, 2026, finding no licensed listings among those analyzed)
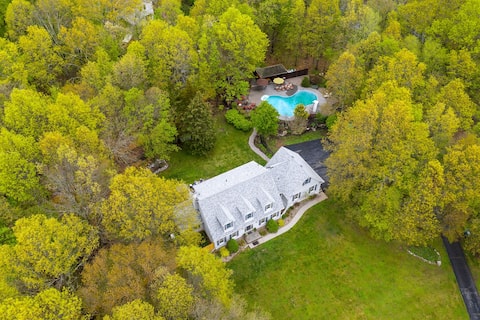
Top Performing Airbnb Properties in Town of Shawangunk (2026)
Benchmark your potential! Explore examples of top-performing Airbnb properties in Town of Shawangunkbased on Trailing Twelve Month (TTM) revenue. Analyze their characteristics, revenue, occupancy rate, and ADR to understand what drives success in this market.

Private Modern Kid Friendly Legoland Hudson Valley
Entire Place • 5 bedrooms
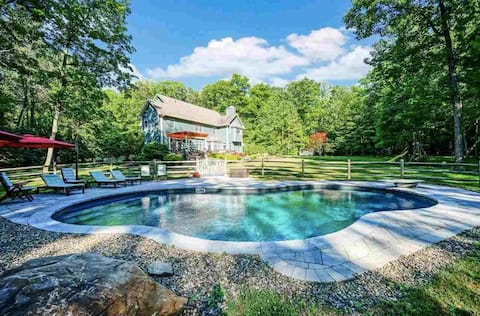
Hudson Valley Oasis - Sauna, Hot Tub, Heated Pool!
Entire Place • 6 bedrooms
NEW! Foley's Riverfront w/ Hot Tub-LEGO LAND CLOSE
Entire Place • 4 bedrooms
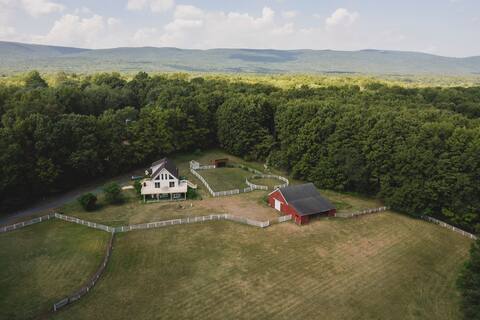
Spacious & Peaceful Family home
Entire Place • 4 bedrooms
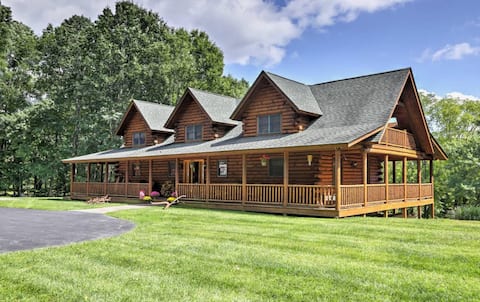
5 Acre Modern Mountain A-Frame with Barn
Entire Place • 4 bedrooms

Mandell's Escape
Entire Place • 5 bedrooms
Note: Performance varies based on location, size, amenities, seasonality, and management quality. Data reflects the past 12 months.
Top Performing Airbnb Hosts in Town of Shawangunk (2026)
Learn from the best! This table showcases top-performing Airbnb hosts in Town of Shawangunk based on the number of properties managed and estimated total revenue over the past year. Analyze their scale and performance metrics.
| Host Name | Properties | Grossing Revenue | Stay Reviews | Avg Rating |
|---|---|---|---|---|
| Gene | 1 | $131,288 | 69 | 4.94/5.0 |
| Ilya | 1 | $108,786 | 108 | 4.98/5.0 |
| Joanne | 1 | $104,666 | 230 | 4.89/5.0 |
| Alexandra | 1 | $98,304 | 33 | 4.94/5.0 |
| Nick | 1 | $87,876 | 161 | 4.84/5.0 |
| Peter | 1 | $78,091 | 20 | 5.00/5.0 |
| Chris | 1 | $68,612 | 117 | 4.97/5.0 |
| Richard | 1 | $64,347 | 4 | 5.00/5.0 |
| Vanessa | 1 | $63,229 | 53 | 4.94/5.0 |
| Angelo | 1 | $61,661 | 53 | 4.87/5.0 |
Analyzing the strategies of top hosts, such as their property selection, pricing, and guest communication, can offer valuable lessons for optimizing your own Airbnb operations in Town of Shawangunk.
Dive Deeper: Advanced Town of Shawangunk STR Market Data (2026)
Ready to unlock more insights? AirROI provides access to advanced metrics and comprehensive Airbnb data for Town of Shawangunk. Explore detailed analytics beyond this report to refine your investment strategy, optimize pricing, and maximize your vacation rental profits.
Explore Advanced MetricsTown of Shawangunk Short-Term Rental Market Composition (2026): Property & Room Types
Room Type Distribution
Property Type Distribution
Market Composition Insights for Town of Shawangunk
- The Town of Shawangunk Airbnb market composition is heavily skewed towards Entire Home/Apt listings, which make up 90.6% of the 32 active rentals. This indicates strong guest preference for privacy and space.
- Looking at the property type distribution in Town of Shawangunk, House properties are the most common (62.5%), reflecting the local real estate landscape.
- Houses represent a significant 62.5% portion, catering likely to families or larger groups.
- The presence of 6.3% Hotel/Boutique listings indicates integration with traditional hospitality.
- Smaller segments like unique stays (combined 3.1%) offer potential for unique stay experiences.
Town of Shawangunk Airbnb Room Capacity Analysis (2026): Bedroom Distribution
Distribution of Listings by Number of Bedrooms
Room Capacity Insights for Town of Shawangunk
- The dominant room capacity in Town of Shawangunk is 3 bedrooms listings, making up 34.4% of the market. This suggests a strong demand for properties suitable for families or small groups.
- Together, 3 bedrooms and 1 bedroom properties represent 56.3% of the active Airbnb listings in Town of Shawangunk, indicating a high concentration in these sizes.
- A significant 65.6% of listings offer 3+ bedrooms, catering to larger groups and families seeking more space in Town of Shawangunk.
Town of Shawangunk Vacation Rental Guest Capacity Trends (2026)
Distribution of Listings by Guest Capacity
Guest Capacity Insights for Town of Shawangunk
- The most common guest capacity trend in Town of Shawangunk vacation rentals is listings accommodating 8+ guests (40.6%). This suggests the primary traveler segment is likely larger groups.
- Properties designed for 8+ guests and 6 guests dominate the Town of Shawangunk STR market, accounting for 59.4% of listings.
- 59.4% of properties accommodate 6+ guests, serving the market segment for larger families or group travel in Town of Shawangunk.
- On average, properties in Town of Shawangunk are equipped to host 5.4 guests.
Town of Shawangunk Airbnb Booking Patterns (2026): Available vs. Booked Days
Available Days Distribution
Booked Days Distribution
Booking Pattern Insights for Town of Shawangunk
- The most common availability pattern in Town of Shawangunk falls within the 181-270 days range, representing 46.9% of listings. This suggests many properties have significant open periods on their calendars.
- Approximately 78.2% of listings show high availability (181+ days open annually), indicating potential for increased bookings or specific owner usage patterns.
- For booked days, the 91-180 days range is most frequent in Town of Shawangunk (46.9%), reflecting common guest stay durations or potential owner blocking patterns.
- A notable 21.9% of properties secure long booking periods (181+ days booked per year), highlighting successful long-term rental strategies or significant owner usage.
Town of Shawangunk Airbnb Minimum Stay Requirements Analysis
Distribution of Listings by Minimum Night Requirement
1 Night
12 listings
37.5% of total
2 Nights
10 listings
31.3% of total
3 Nights
1 listings
3.1% of total
30+ Nights
9 listings
28.1% of total
Key Insights
- The most prevalent minimum stay requirement in Town of Shawangunk is 1 Night, adopted by 37.5% of listings. This highlights the market's preference for shorter, flexible bookings.
- A strong majority (68.8%) of the Town of Shawangunk Airbnb data shows acceptance of very short stays (1-2 nights), indicating a dynamic, high-turnover market.
- A significant segment (28.1%) caters to monthly stays (30+ nights) in Town of Shawangunk, pointing to opportunities in the extended-stay market.
Recommendations
- Align with the market by considering a 1 Night minimum stay, as 37.5% of Town of Shawangunk hosts use this setting.
- Explore offering discounts for stays of 30+ nights to attract the 28.1% of the market seeking extended stays.
- Adjust minimum nights based on seasonality – potentially shorter during low season and longer during peak demand periods in Town of Shawangunk.
Town of Shawangunk Airbnb Cancellation Policy Trends Analysis (2026)
Limited
1 listings
3.1% of total
Flexible
5 listings
15.6% of total
Moderate
9 listings
28.1% of total
Firm
9 listings
28.1% of total
Strict
8 listings
25% of total
Cancellation Policy Insights for Town of Shawangunk
- The prevailing Airbnb cancellation policy trend in Town of Shawangunk is Moderate, used by 28.1% of listings.
- A majority (53.1%) of hosts in Town of Shawangunk utilize Firm or Strict policies, indicating a market where hosts prioritize booking security.
Recommendations for Hosts
- Consider adopting a Moderate policy to align with the 28.1% market standard in Town of Shawangunk.
- Regularly review your cancellation policy against competitors and market demand shifts in Town of Shawangunk.
Town of Shawangunk STR Booking Lead Time Analysis (2026)
Average Booking Lead Time by Month
Booking Lead Time Insights for Town of Shawangunk
- The overall average booking lead time for vacation rentals in Town of Shawangunk is 51 days.
- Guests book furthest in advance for stays during May (average 66 days), likely coinciding with peak travel demand or local events.
- The shortest booking windows occur for stays in February (average 27 days), indicating more last-minute travel plans during this time.
- Seasonally, Fall (62 days avg.) sees the longest lead times, while Winter (34 days avg.) has the shortest, reflecting typical travel planning cycles.
Recommendations for Hosts
- Use the overall average lead time (51 days) as a baseline for your pricing and availability strategy in Town of Shawangunk.
- For May stays, consider implementing length-of-stay discounts or slightly higher rates for bookings made less than 66 days out to capitalize on advance planning.
- Target marketing efforts for the Fall season well in advance (at least 62 days) to capture early planners.
- Monitor your own booking lead times against these Town of Shawangunk averages to identify opportunities for dynamic pricing adjustments.
Popular & Essential Airbnb Amenities in Town of Shawangunk (2026)
Amenity Prevalence
Amenity Insights for Town of Shawangunk
- Essential amenities in Town of Shawangunk that guests expect include: Wifi, Refrigerator, Coffee maker, Free parking on premises, Heating. Lacking these (any) could significantly impact bookings.
- Popular amenities like Smoke alarm, Air conditioning, Bed linens are common but not universal. Offering these can provide a competitive edge.
Recommendations for Hosts
- Ensure your listing includes all essential amenities for Town of Shawangunk: Wifi, Refrigerator, Coffee maker, Free parking on premises, Heating.
- Prioritize adding missing essentials: Refrigerator, Coffee maker, Free parking on premises, Heating.
- Consider adding popular differentiators like Smoke alarm or Air conditioning to increase appeal.
- Highlight unique or less common amenities you offer (e.g., hot tub, dedicated workspace, EV charger) in your listing description and photos.
- Regularly check competitor amenities in Town of Shawangunk to stay competitive.
Town of Shawangunk Airbnb Guest Demographics & Profile Analysis (2026)
Guest Profile Summary for Town of Shawangunk
- The typical guest profile for Airbnb in Town of Shawangunk consists of primarily domestic travelers (93%), often arriving from nearby New York, typically belonging to the Post-2000s (Gen Z/Alpha) group (50%), primarily speaking English or Spanish.
- Domestic travelers account for 92.8% of guests.
- Key international markets include United States (92.8%) and Canada (2.5%).
- Top languages spoken are English (58.7%) followed by Spanish (15.3%).
- A significant demographic segment is the Post-2000s (Gen Z/Alpha) group, representing 50% of guests.
Recommendations for Hosts
- Target domestic marketing efforts towards travelers from New York and Boston.
- Tailor amenities and listing descriptions to appeal to the dominant Post-2000s (Gen Z/Alpha) demographic (e.g., highlight fast WiFi, smart home features, local guides).
- Highlight unique local experiences or amenities relevant to the primary guest profile.
- Consider seasonal promotions aligned with peak travel times for key origin markets.
Nearby Short-Term Rental Market Comparison
How does the Town of Shawangunk Airbnb market stack up against its neighbors? Compare key performance metrics like average monthly revenue, ADR, and occupancy rates in surrounding areas to understand the broader regional STR landscape.
| Market | Active Properties | Monthly Revenue | Daily Rate | Avg. Occupancy |
|---|---|---|---|---|
| Freeland | 11 | $8,436 | $684.29 | 42% |
| Berlin Township | 15 | $7,208 | $729.10 | 35% |
| Town of Kingston | 10 | $6,470 | $473.76 | 49% |
| Frankford Township | 11 | $6,329 | $505.19 | 41% |
| Spring Lake Heights | 16 | $5,785 | $725.20 | 40% |
| Stroud Township | 137 | $5,728 | $478.40 | 40% |
| Town of Monroe | 22 | $5,690 | $720.52 | 37% |
| Town of Ancram | 22 | $5,616 | $512.55 | 38% |
| Hilltown Township | 11 | $5,557 | $578.96 | 40% |
| Mount Pocono | 22 | $5,346 | $485.18 | 45% |