Town of Roxbury Airbnb Market Analysis 2026: Short Term Rental Data & Vacation Rental Statistics in New York, United States
Is Airbnb profitable in Town of Roxbury in 2026? Explore comprehensive Airbnb analytics for Town of Roxbury, New York, United States to uncover income potential. This 2026 STR market report for Town of Roxbury, based on AirROI data from February 2025 to January 2026, reveals key trends in the niche market of 136 active listings.
Whether you're considering an Airbnb investment in Town of Roxbury, optimizing your existing vacation rental, or exploring rental arbitrage opportunities, understanding the Town of Roxbury Airbnb data is crucial. Leveraging the low regulation environment is key to maximizing your short term rental income potential. Let's dive into the specifics.
Key Town of Roxbury Airbnb Performance Metrics Overview
Monthly Airbnb Revenue Variations & Income Potential in Town of Roxbury (2026)
Understanding the monthly revenue variations for Airbnb listings in Town of Roxbury is key to maximizing your short term rental income potential. Seasonality significantly impacts earnings. Our analysis, based on data from the past 12 months, shows that the peak revenue month for STRs in Town of Roxbury is typically August, while April often presents the lowest earnings, highlighting opportunities for strategic pricing adjustments during shoulder and low seasons. Explore the typical Airbnb income in Town of Roxbury across different performance tiers:
- Best-in-class properties (Top 10%) achieve $8,259+ monthly, often utilizing dynamic pricing and superior guest experiences.
- Strong performing properties (Top 25%) earn $4,862 or more, indicating effective management and desirable locations/amenities.
- Typical properties (Median) generate around $2,887 per month, representing the average market performance.
- Entry-level properties (Bottom 25%) see earnings around $1,643, often with potential for optimization.
Average Monthly Airbnb Earnings Trend in Town of Roxbury
Town of Roxbury Airbnb Occupancy Rate Trends (2026)
Maximize your bookings by understanding the Town of Roxbury STR occupancy trends. Seasonal demand shifts significantly influence how often properties are booked. Typically, Augustsees the highest demand (peak season occupancy), while May experiences the lowest (low season). Effective strategies, like adjusting minimum stays or offering promotions, can boost occupancy during slower periods. Here's how different property tiers perform in Town of Roxbury:
- Best-in-class properties (Top 10%) achieve 75%+ occupancy, indicating high desirability and potentially optimized availability.
- Strong performing properties (Top 25%) maintain 55% or higher occupancy, suggesting good market fit and guest satisfaction.
- Typical properties (Median) have an occupancy rate around 34%.
- Entry-level properties (Bottom 25%) average 20% occupancy, potentially facing higher vacancy.
Average Monthly Occupancy Rate Trend in Town of Roxbury
Average Daily Rate (ADR) Airbnb Trends in Town of Roxbury (2026)
Effective short term rental pricing strategy in Town of Roxbury involves understanding monthly ADR fluctuations. The Average Daily Rate (ADR) for Airbnb in Town of Roxbury typically peaks in July and dips lowest during April. Leveraging Airbnb dynamic pricing tools or strategies based on this seasonality can significantly boost revenue. Here's a look at the typical nightly rates achieved:
- Best-in-class properties (Top 10%) command rates of $556+ per night, often due to premium features or locations.
- Strong performing properties (Top 25%) achieve nightly rates of $382 or more.
- Typical properties (Median) charge around $275 per night.
- Entry-level properties (Bottom 25%) earn around $195 per night.
Average Daily Rate (ADR) Trend by Month in Town of Roxbury
Get Live Town of Roxbury Market Intelligence 👇

Explore Real-time Analytics
Airbnb Seasonality Analysis & Trends in Town of Roxbury (2026)
Peak Season (August, July, December)
- Revenue averages $5,566 per month
- Occupancy rates average 45.4%
- Daily rates average $340
Shoulder Season
- Revenue averages $4,018 per month
- Occupancy maintains around 39.0%
- Daily rates hold near $328
Low Season (March, April, May)
- Revenue drops to average $3,065 per month
- Occupancy decreases to average 31.1%
- Daily rates adjust to average $307
Seasonality Insights for Town of Roxbury
- The Airbnb seasonality in Town of Roxbury shows highly seasonal trends requiring careful strategy. While the sections above show seasonal averages, it's also insightful to look at the extremes:
- During the high season, the absolute peak month showcases Town of Roxbury's highest earning potential, with monthly revenues capable of climbing to $6,144, occupancy reaching a high of 53.1%, and ADRs peaking at $344.
- Conversely, the slowest single month of the year, typically falling within the low season, marks the market's lowest point. In this month, revenue might dip to $3,059, occupancy could drop to 29.4%, and ADRs may adjust down to $300.
- Understanding both the seasonal averages and these monthly peaks and troughs in revenue, occupancy, and ADR is crucial for maximizing your Airbnb profit potential in Town of Roxbury.
Seasonal Strategies for Maximizing Profit
- Peak Season: Maximize revenue through premium pricing and potentially longer minimum stays. Ensure high availability.
- Low Season: Offer competitive pricing, special promotions (e.g., extended stay discounts), and flexible cancellation policies. Target off-season travelers like remote workers or budget-conscious guests.
- Shoulder Seasons: Implement dynamic pricing that balances peak and low rates. Target weekend travelers or specific events. Offer slightly more flexible terms than peak season.
- Regularly analyze your own performance against these Town of Roxbury seasonality benchmarks and adjust your pricing and availability strategy accordingly.
Best Areas for Airbnb Investment in Town of Roxbury (2026)
Exploring the top neighborhoods for short-term rentals in Town of Roxbury? This section highlights key areas, outlining why they are attractive for hosts and guests, along with notable local attractions. Consider these locations based on your target guest profile and investment strategy.
| Neighborhood / Area | Why Host Here? (Target Guests & Appeal) | Key Attractions & Landmarks |
|---|---|---|
| East Roxbury | A serene location ideal for those seeking a quiet retreat in the mountains. Proximity to nature and outdoor activities makes it a favorite for tourists looking to escape the city. | Catskill Forest Preserve, Roxbury Arts Group, Bovina Historic District, Plattekill Mountain, Roxbury Pond |
| Roxbury Village | The charming center of Roxbury, known for its small-town ambiance and scenic views. Perfect for hosting guests looking for a quaint, rustic experience with local shops and eateries. | Roxbury General Store, Kimberly's Pub, Lander's River Trips, The Roxbury Barn and Estate |
| Cedar Grove | A beautiful community surrounded by nature and hiking trails, attracting outdoor enthusiasts and families. Great for vacation rentals due to the natural landscape and local wildlife. | Cedar Grove State Forest, Hiking trails, Fishing spots, Scenic viewpoints |
| Bovina Center | A peaceful hamlet with stunning farmland views, attracting visitors interested in rural tourism and farm-to-table experiences. | Bovina Historical Society, Local farms, Nature trails, Scenic drives |
| Halcott Center | Known for its rustic charm and secluded nature, making it an attractive option for those looking for solitude amid the mountains. | Halcott Mountain, Local hiking trails, Quiet picnic spots |
| Grand Gorge | A quaint village offering unique outdoor experiences, including access to the Schoharie Creek, appealing to adventure seekers. | Schoharie Creek, Local parks, Hiking excursions, Wildlife observations |
| Big Indian | A hidden gem in the Catskills offering a unique experience of mountain living, perfect for those staying for the outdoor sports activities. | Big Indian Wilderness, Local hiking spots, Nature explorations, Scenic views |
| Margaretville | A popular nearby town with a rich history and vibrant local culture, attracting visitors year-round for various events and activities. | Margaretville Museum, Local art galleries, Ski resorts nearby, Waterfalls and hiking trails |
Understanding Airbnb License Requirements & STR Laws in Town of Roxbury (2026)
While Town of Roxbury, New York, United States currently shows low STR regulations, specific Airbnb license requirements might still exist or change. Always verify the latest short term rental regulations and Airbnb license requirements directly with local government authorities for Town of Roxbury to ensure full compliance before hosting.
(Source: AirROI data, 2026, finding no licensed listings among those analyzed)
Top Performing Airbnb Properties in Town of Roxbury (2026)
Benchmark your potential! Explore examples of top-performing Airbnb properties in Town of Roxburybased on Trailing Twelve Month (TTM) revenue. Analyze their characteristics, revenue, occupancy rate, and ADR to understand what drives success in this market.
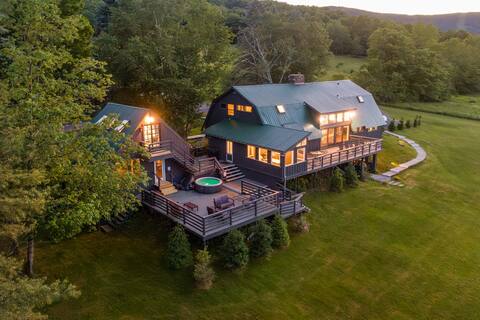
Charming 9br Sleeps 19 Catskills Estate w/ Views!
Entire Place • 9 bedrooms

Catskills, secluded, a renovated 1840s Barn w/SPA
Entire Place • 4 bedrooms

Roxbury Villa with Mountain Views, Hot Tub & Sauna
Entire Place • 6 bedrooms
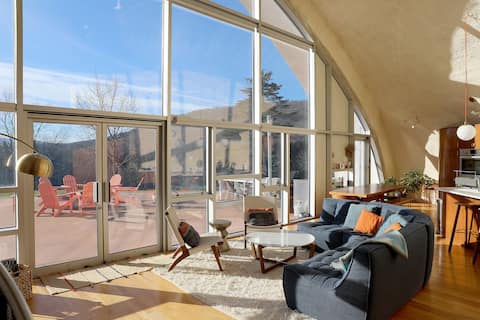
Luxury Designer Dome Private Oasis in Catskills
Entire Place • 4 bedrooms
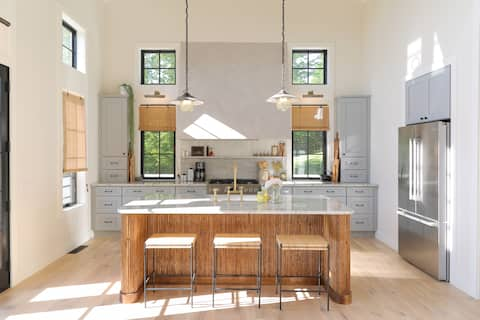
Canopy Hill House - Luxury w/ Mt View+Hot Tub+Pool
Entire Place • 3 bedrooms

Catskills Retreat - Hot Tub/Sauna - skiing, hiking
Entire Place • 5 bedrooms
Note: Performance varies based on location, size, amenities, seasonality, and management quality. Data reflects the past 12 months.
Top Performing Airbnb Hosts in Town of Roxbury (2026)
Learn from the best! This table showcases top-performing Airbnb hosts in Town of Roxbury based on the number of properties managed and estimated total revenue over the past year. Analyze their scale and performance metrics.
| Host Name | Properties | Grossing Revenue | Stay Reviews | Avg Rating |
|---|---|---|---|---|
| Esther | 10 | $375,993 | 403 | 4.90/5.0 |
| Beau & Dasha | 1 | $312,155 | 38 | 4.74/5.0 |
| Edward | 1 | $256,380 | 133 | 4.99/5.0 |
| Alluvion Vacations | 1 | $211,117 | 43 | 4.95/5.0 |
| Mark | 1 | $143,167 | 105 | 5.00/5.0 |
| Amanda | 1 | $136,024 | 87 | 4.95/5.0 |
| Jen & Caroline | 4 | $126,255 | 264 | 4.86/5.0 |
| Frank | 1 | $113,862 | 16 | 4.81/5.0 |
| Kim & Russell | 2 | $104,619 | 247 | 4.93/5.0 |
| Victoria | 1 | $99,291 | 42 | 4.98/5.0 |
Analyzing the strategies of top hosts, such as their property selection, pricing, and guest communication, can offer valuable lessons for optimizing your own Airbnb operations in Town of Roxbury.
Dive Deeper: Advanced Town of Roxbury STR Market Data (2026)
Ready to unlock more insights? AirROI provides access to advanced metrics and comprehensive Airbnb data for Town of Roxbury. Explore detailed analytics beyond this report to refine your investment strategy, optimize pricing, and maximize your vacation rental profits.
Explore Advanced MetricsTown of Roxbury Short-Term Rental Market Composition (2026): Property & Room Types
Room Type Distribution
Property Type Distribution
Market Composition Insights for Town of Roxbury
- The Town of Roxbury Airbnb market composition is heavily skewed towards Entire Home/Apt listings, which make up 97.8% of the 136 active rentals. This indicates strong guest preference for privacy and space.
- Looking at the property type distribution in Town of Roxbury, House properties are the most common (63.2%), reflecting the local real estate landscape.
- Houses represent a significant 63.2% portion, catering likely to families or larger groups.
- Smaller segments like unique stays, hotel/boutique, others (combined 5.9%) offer potential for unique stay experiences.
Town of Roxbury Airbnb Room Capacity Analysis (2026): Bedroom Distribution
Distribution of Listings by Number of Bedrooms
Room Capacity Insights for Town of Roxbury
- The dominant room capacity in Town of Roxbury is 3 bedrooms listings, making up 40.4% of the market. This suggests a strong demand for properties suitable for families or small groups.
- Together, 3 bedrooms and 2 bedrooms properties represent 60.3% of the active Airbnb listings in Town of Roxbury, indicating a high concentration in these sizes.
- A significant 66.8% of listings offer 3+ bedrooms, catering to larger groups and families seeking more space in Town of Roxbury.
Town of Roxbury Vacation Rental Guest Capacity Trends (2026)
Distribution of Listings by Guest Capacity
Guest Capacity Insights for Town of Roxbury
- The most common guest capacity trend in Town of Roxbury vacation rentals is listings accommodating 8+ guests (33.8%). This suggests the primary traveler segment is likely larger groups.
- Properties designed for 8+ guests and 6 guests dominate the Town of Roxbury STR market, accounting for 66.9% of listings.
- 68.4% of properties accommodate 6+ guests, serving the market segment for larger families or group travel in Town of Roxbury.
- On average, properties in Town of Roxbury are equipped to host 5.9 guests.
Town of Roxbury Airbnb Booking Patterns (2026): Available vs. Booked Days
Available Days Distribution
Booked Days Distribution
Booking Pattern Insights for Town of Roxbury
- The most common availability pattern in Town of Roxbury falls within the 271-366 days range, representing 45.6% of listings. This suggests many properties have significant open periods on their calendars.
- Approximately 88.2% of listings show high availability (181+ days open annually), indicating potential for increased bookings or specific owner usage patterns.
- For booked days, the 91-180 days range is most frequent in Town of Roxbury (44.1%), reflecting common guest stay durations or potential owner blocking patterns.
- A notable 14.0% of properties secure long booking periods (181+ days booked per year), highlighting successful long-term rental strategies or significant owner usage.
Town of Roxbury Airbnb Minimum Stay Requirements Analysis
Distribution of Listings by Minimum Night Requirement
1 Night
14 listings
10.3% of total
2 Nights
69 listings
50.7% of total
3 Nights
11 listings
8.1% of total
4-6 Nights
3 listings
2.2% of total
7-29 Nights
2 listings
1.5% of total
30+ Nights
37 listings
27.2% of total
Key Insights
- The most prevalent minimum stay requirement in Town of Roxbury is 2 Nights, adopted by 50.7% of listings. This highlights the market's preference for shorter, flexible bookings.
- A strong majority (61.0%) of the Town of Roxbury Airbnb data shows acceptance of very short stays (1-2 nights), indicating a dynamic, high-turnover market.
- A significant segment (27.2%) caters to monthly stays (30+ nights) in Town of Roxbury, pointing to opportunities in the extended-stay market.
Recommendations
- Align with the market by considering a 2 Nights minimum stay, as 50.7% of Town of Roxbury hosts use this setting.
- If feasible, allowing 1-night stays, especially midweek or during low season, could capture last-minute bookings, as only 10.3% currently do.
- A 2-night minimum appears standard (50.7%). Consider this for weekends or peak periods.
- Explore offering discounts for stays of 30+ nights to attract the 27.2% of the market seeking extended stays.
- Adjust minimum nights based on seasonality – potentially shorter during low season and longer during peak demand periods in Town of Roxbury.
Town of Roxbury Airbnb Cancellation Policy Trends Analysis (2026)
Limited
4 listings
2.9% of total
Super Strict 60 Days
1 listings
0.7% of total
Flexible
16 listings
11.8% of total
Moderate
45 listings
33.1% of total
Firm
60 listings
44.1% of total
Strict
10 listings
7.4% of total
Cancellation Policy Insights for Town of Roxbury
- The prevailing Airbnb cancellation policy trend in Town of Roxbury is Firm, used by 44.1% of listings.
- A majority (51.5%) of hosts in Town of Roxbury utilize Firm or Strict policies, indicating a market where hosts prioritize booking security.
- Strict cancellation policies are quite rare (7.4%), potentially making listings with this policy less competitive unless justified by high demand or property type.
Recommendations for Hosts
- Consider adopting a Firm policy to align with the 44.1% market standard in Town of Roxbury.
- Using a Strict policy might deter some guests, as only 7.4% of listings use it. Evaluate if potential revenue protection outweighs possible lower booking rates.
- Regularly review your cancellation policy against competitors and market demand shifts in Town of Roxbury.
Town of Roxbury STR Booking Lead Time Analysis (2026)
Average Booking Lead Time by Month
Booking Lead Time Insights for Town of Roxbury
- The overall average booking lead time for vacation rentals in Town of Roxbury is 52 days.
- Guests book furthest in advance for stays during June (average 71 days), likely coinciding with peak travel demand or local events.
- The shortest booking windows occur for stays in April (average 34 days), indicating more last-minute travel plans during this time.
- Seasonally, Summer (67 days avg.) sees the longest lead times, while Spring (39 days avg.) has the shortest, reflecting typical travel planning cycles.
Recommendations for Hosts
- Use the overall average lead time (52 days) as a baseline for your pricing and availability strategy in Town of Roxbury.
- For June stays, consider implementing length-of-stay discounts or slightly higher rates for bookings made less than 71 days out to capitalize on advance planning.
- Target marketing efforts for the Summer season well in advance (at least 67 days) to capture early planners.
- Monitor your own booking lead times against these Town of Roxbury averages to identify opportunities for dynamic pricing adjustments.
Popular & Essential Airbnb Amenities in Town of Roxbury (2026)
Amenity Prevalence
Amenity Insights for Town of Roxbury
- Essential amenities in Town of Roxbury that guests expect include: Heating, Smoke alarm, Dishes and silverware, Kitchen, Wifi, Free parking on premises, Fire extinguisher, Hot water, Carbon monoxide alarm, Cooking basics. Lacking these (any) could significantly impact bookings.
Recommendations for Hosts
- Ensure your listing includes all essential amenities for Town of Roxbury: Heating, Smoke alarm, Dishes and silverware, Kitchen, Wifi, Free parking on premises, Fire extinguisher, Hot water, Carbon monoxide alarm, Cooking basics.
- Prioritize adding missing essentials: Heating, Smoke alarm, Dishes and silverware, Kitchen, Wifi, Free parking on premises, Fire extinguisher, Hot water, Carbon monoxide alarm, Cooking basics.
- Highlight unique or less common amenities you offer (e.g., hot tub, dedicated workspace, EV charger) in your listing description and photos.
- Regularly check competitor amenities in Town of Roxbury to stay competitive.
Town of Roxbury Airbnb Guest Demographics & Profile Analysis (2026)
Guest Profile Summary for Town of Roxbury
- The typical guest profile for Airbnb in Town of Roxbury consists of primarily domestic travelers (95%), often arriving from nearby New York, typically belonging to the Post-2000s (Gen Z/Alpha) group (50%), primarily speaking English or Spanish.
- Domestic travelers account for 95.2% of guests.
- Key international markets include United States (95.2%) and United Kingdom (1%).
- Top languages spoken are English (60.3%) followed by Spanish (14.3%).
- A significant demographic segment is the Post-2000s (Gen Z/Alpha) group, representing 50% of guests.
Recommendations for Hosts
- Target domestic marketing efforts towards travelers from New York and Philadelphia.
- Tailor amenities and listing descriptions to appeal to the dominant Post-2000s (Gen Z/Alpha) demographic (e.g., highlight fast WiFi, smart home features, local guides).
- Highlight unique local experiences or amenities relevant to the primary guest profile.
- Consider seasonal promotions aligned with peak travel times for key origin markets.
Nearby Short-Term Rental Market Comparison
How does the Town of Roxbury Airbnb market stack up against its neighbors? Compare key performance metrics like average monthly revenue, ADR, and occupancy rates in surrounding areas to understand the broader regional STR landscape.
| Market | Active Properties | Monthly Revenue | Daily Rate | Avg. Occupancy |
|---|---|---|---|---|
| Freeland | 11 | $8,436 | $684.29 | 42% |
| Town of Trenton | 13 | $7,410 | $484.59 | 43% |
| Berlin Township | 15 | $7,208 | $729.10 | 35% |
| Middletown Springs | 13 | $6,843 | $507.55 | 32% |
| Town of Kingston | 10 | $6,470 | $473.76 | 49% |
| Frankford Township | 11 | $6,329 | $505.19 | 41% |
| Fort Ann | 35 | $6,238 | $790.41 | 37% |
| Stroud Township | 137 | $5,728 | $478.40 | 40% |
| Town of Monroe | 22 | $5,690 | $720.52 | 37% |
| Town of Ancram | 22 | $5,616 | $512.55 | 38% |