Town of Rockland Airbnb Market Analysis 2026: Short Term Rental Data & Vacation Rental Statistics in New York, United States
Is Airbnb profitable in Town of Rockland in 2026? Explore comprehensive Airbnb analytics for Town of Rockland, New York, United States to uncover income potential. This 2026 STR market report for Town of Rockland, based on AirROI data from February 2025 to January 2026, reveals key trends in the niche market of 145 active listings.
Whether you're considering an Airbnb investment in Town of Rockland, optimizing your existing vacation rental, or exploring rental arbitrage opportunities, understanding the Town of Rockland Airbnb data is crucial. Leveraging the low regulation environment is key to maximizing your short term rental income potential. Let's dive into the specifics.
Key Town of Rockland Airbnb Performance Metrics Overview
Monthly Airbnb Revenue Variations & Income Potential in Town of Rockland (2026)
Understanding the monthly revenue variations for Airbnb listings in Town of Rockland is key to maximizing your short term rental income potential. Seasonality significantly impacts earnings. Our analysis, based on data from the past 12 months, shows that the peak revenue month for STRs in Town of Rockland is typically August, while March often presents the lowest earnings, highlighting opportunities for strategic pricing adjustments during shoulder and low seasons. Explore the typical Airbnb income in Town of Rockland across different performance tiers:
- Best-in-class properties (Top 10%) achieve $7,938+ monthly, often utilizing dynamic pricing and superior guest experiences.
- Strong performing properties (Top 25%) earn $4,853 or more, indicating effective management and desirable locations/amenities.
- Typical properties (Median) generate around $2,783 per month, representing the average market performance.
- Entry-level properties (Bottom 25%) see earnings around $1,437, often with potential for optimization.
Average Monthly Airbnb Earnings Trend in Town of Rockland
Town of Rockland Airbnb Occupancy Rate Trends (2026)
Maximize your bookings by understanding the Town of Rockland STR occupancy trends. Seasonal demand shifts significantly influence how often properties are booked. Typically, Augustsees the highest demand (peak season occupancy), while January experiences the lowest (low season). Effective strategies, like adjusting minimum stays or offering promotions, can boost occupancy during slower periods. Here's how different property tiers perform in Town of Rockland:
- Best-in-class properties (Top 10%) achieve 69%+ occupancy, indicating high desirability and potentially optimized availability.
- Strong performing properties (Top 25%) maintain 52% or higher occupancy, suggesting good market fit and guest satisfaction.
- Typical properties (Median) have an occupancy rate around 33%.
- Entry-level properties (Bottom 25%) average 17% occupancy, potentially facing higher vacancy.
Average Monthly Occupancy Rate Trend in Town of Rockland
Average Daily Rate (ADR) Airbnb Trends in Town of Rockland (2026)
Effective short term rental pricing strategy in Town of Rockland involves understanding monthly ADR fluctuations. The Average Daily Rate (ADR) for Airbnb in Town of Rockland typically peaks in June and dips lowest during March. Leveraging Airbnb dynamic pricing tools or strategies based on this seasonality can significantly boost revenue. Here's a look at the typical nightly rates achieved:
- Best-in-class properties (Top 10%) command rates of $525+ per night, often due to premium features or locations.
- Strong performing properties (Top 25%) achieve nightly rates of $367 or more.
- Typical properties (Median) charge around $260 per night.
- Entry-level properties (Bottom 25%) earn around $187 per night.
Average Daily Rate (ADR) Trend by Month in Town of Rockland
Get Live Town of Rockland Market Intelligence 👇

Explore Real-time Analytics
Airbnb Seasonality Analysis & Trends in Town of Rockland (2026)
Peak Season (August, July, October)
- Revenue averages $4,691 per month
- Occupancy rates average 44.2%
- Daily rates average $312
Shoulder Season
- Revenue averages $3,503 per month
- Occupancy maintains around 34.3%
- Daily rates hold near $304
Low Season (February, March, April)
- Revenue drops to average $2,840 per month
- Occupancy decreases to average 32.8%
- Daily rates adjust to average $283
Seasonality Insights for Town of Rockland
- The Airbnb seasonality in Town of Rockland shows highly seasonal trends requiring careful strategy. While the sections above show seasonal averages, it's also insightful to look at the extremes:
- During the high season, the absolute peak month showcases Town of Rockland's highest earning potential, with monthly revenues capable of climbing to $5,231, occupancy reaching a high of 49.3%, and ADRs peaking at $318.
- Conversely, the slowest single month of the year, typically falling within the low season, marks the market's lowest point. In this month, revenue might dip to $2,645, occupancy could drop to 27.9%, and ADRs may adjust down to $280.
- Understanding both the seasonal averages and these monthly peaks and troughs in revenue, occupancy, and ADR is crucial for maximizing your Airbnb profit potential in Town of Rockland.
Seasonal Strategies for Maximizing Profit
- Peak Season: Maximize revenue through premium pricing and potentially longer minimum stays. Ensure high availability.
- Low Season: Offer competitive pricing, special promotions (e.g., extended stay discounts), and flexible cancellation policies. Target off-season travelers like remote workers or budget-conscious guests.
- Shoulder Seasons: Implement dynamic pricing that balances peak and low rates. Target weekend travelers or specific events. Offer slightly more flexible terms than peak season.
- Regularly analyze your own performance against these Town of Rockland seasonality benchmarks and adjust your pricing and availability strategy accordingly.
Best Areas for Airbnb Investment in Town of Rockland (2026)
Exploring the top neighborhoods for short-term rentals in Town of Rockland? This section highlights key areas, outlining why they are attractive for hosts and guests, along with notable local attractions. Consider these locations based on your target guest profile and investment strategy.
| Neighborhood / Area | Why Host Here? (Target Guests & Appeal) | Key Attractions & Landmarks |
|---|---|---|
| New City | The largest community in Rockland County, New City offers a suburban feel with easy access to urban amenities. It's popular with families and individuals looking for a peaceful yet convenient location. | Rockland County Courthouse, New City Library, Pascack Brook County Park, Local restaurants and cafes |
| Nyack | Nyack is known for its vibrant arts scene and charming downtown along the Hudson River. It attracts tourists seeking cultural experiences and scenic views. | Nyack Beach State Park, Palisades Center, Edward Hopper House, Nyack Marina, Local shops and art galleries |
| Spring Valley | A diverse community with a rich cultural heritage, Spring Valley offers affordable accommodations and is centrally located within Rockland County, making it ideal for various visitors. | Haverstraw Bay County Park, Spring Valley Marketplace, Local cultural events |
| West Nyack | Home to the famous Palisades Center Mall, West Nyack draws shoppers and families. It's a hub for entertainment and dining, making it a prime location for Airbnb hosting. | Palisades Center, Local dining options, Towers of the Hudson River |
| Suffern | This historic village offers a charming downtown area and easy access to transportation into New York City. It's attractive to commuters and travelers alike. | Suffern Railroad Station, Historic downtown Suffern, Local parks and recreation areas |
| Congers | Congers features beautiful lakes and parks, providing an outdoorsy experience for guests. Its small-town feel is appealing to visitors looking to escape the hustle and bustle. | Congers Lake Park, Rockland Lake State Park, Local hiking trails |
| Tappan | Known for its historic significance and beautiful landscapes, Tappan is a quieter area that attracts those looking to experience the tranquility of Rockland County. | Tappan Zee Railroad Station, Historic sites, Local parks and hiking |
| Pearl River | This community has a lively downtown area and is known for its friendly atmosphere. It is popular for families and visitors looking for a sense of community. | Pearl River Library, Local shops and restaurants, Hometown summer events |
Understanding Airbnb License Requirements & STR Laws in Town of Rockland (2026)
While Town of Rockland, New York, United States currently shows low STR regulations, specific Airbnb license requirements might still exist or change. Always verify the latest short term rental regulations and Airbnb license requirements directly with local government authorities for Town of Rockland to ensure full compliance before hosting.
(Source: AirROI data, 2026, finding no licensed listings among those analyzed)
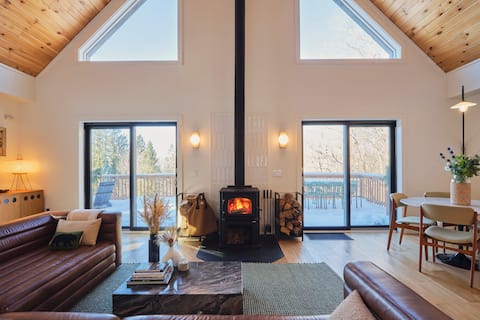
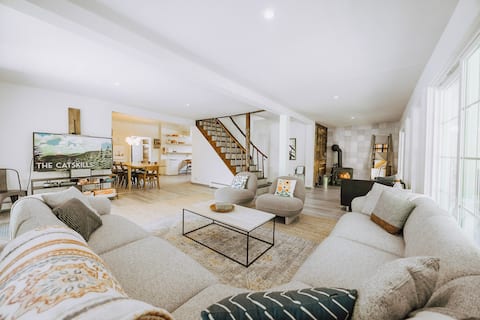
Top Performing Airbnb Properties in Town of Rockland (2026)
Benchmark your potential! Explore examples of top-performing Airbnb properties in Town of Rocklandbased on Trailing Twelve Month (TTM) revenue. Analyze their characteristics, revenue, occupancy rate, and ADR to understand what drives success in this market.

Experience The Zen House
Entire Place • 5 bedrooms

Gorgeous Waterfront w/ Hot Tub and Game Level
Entire Place • 4 bedrooms
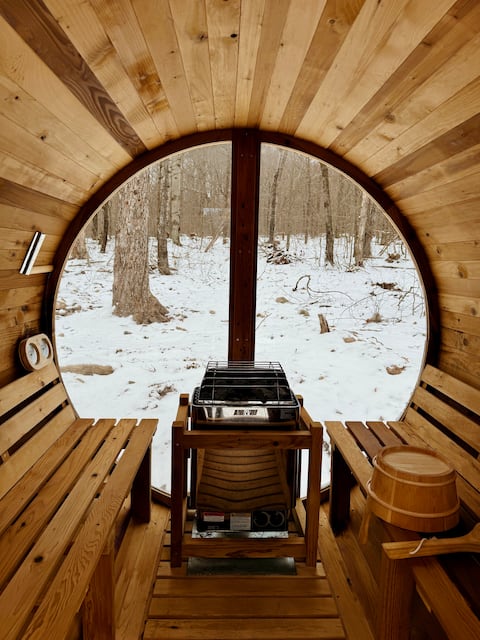
evergreen overlook—hot tub, sauna, rec room, gym
Entire Place • 3 bedrooms
Beaver Cottage - Waterfront, Hot Tub, Fire Pit
Entire Place • 6 bedrooms
The Glove | with sauna & cold plunge
Entire Place • 3 bedrooms
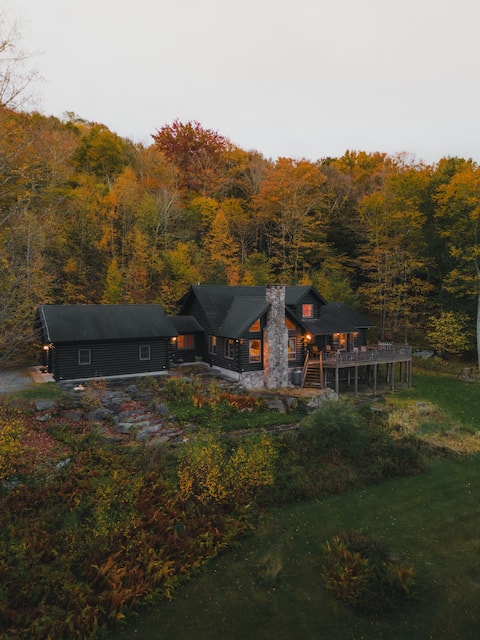
Amber Acres Lodge | 4BR Catskills Log Cabin 15AC
Entire Place • 4 bedrooms
Note: Performance varies based on location, size, amenities, seasonality, and management quality. Data reflects the past 12 months.
Top Performing Airbnb Hosts in Town of Rockland (2026)
Learn from the best! This table showcases top-performing Airbnb hosts in Town of Rockland based on the number of properties managed and estimated total revenue over the past year. Analyze their scale and performance metrics.
| Host Name | Properties | Grossing Revenue | Stay Reviews | Avg Rating |
|---|---|---|---|---|
| Anna And The Upstate Place Tea | 3 | $235,649 | 195 | 4.87/5.0 |
| Red Cottage | 5 | $208,993 | 96 | 4.89/5.0 |
| Eugene | 1 | $176,872 | 335 | 4.97/5.0 |
| Sonia | 7 | $130,108 | 286 | 4.83/5.0 |
| Nathan | 1 | $129,746 | 41 | 5.00/5.0 |
| Kevin | 1 | $119,975 | 90 | 4.91/5.0 |
| Nicole | 2 | $113,562 | 174 | 4.93/5.0 |
| Rowan | 1 | $107,994 | 41 | 4.98/5.0 |
| Keira | 1 | $105,733 | 38 | 4.95/5.0 |
| Alexandra | 1 | $88,481 | 54 | 4.76/5.0 |
Analyzing the strategies of top hosts, such as their property selection, pricing, and guest communication, can offer valuable lessons for optimizing your own Airbnb operations in Town of Rockland.
Dive Deeper: Advanced Town of Rockland STR Market Data (2026)
Ready to unlock more insights? AirROI provides access to advanced metrics and comprehensive Airbnb data for Town of Rockland. Explore detailed analytics beyond this report to refine your investment strategy, optimize pricing, and maximize your vacation rental profits.
Explore Advanced MetricsTown of Rockland Short-Term Rental Market Composition (2026): Property & Room Types
Room Type Distribution
Property Type Distribution
Market Composition Insights for Town of Rockland
- The Town of Rockland Airbnb market composition is heavily skewed towards Entire Home/Apt listings, which make up 90.3% of the 145 active rentals. This indicates strong guest preference for privacy and space.
- Looking at the property type distribution in Town of Rockland, House properties are the most common (69.7%), reflecting the local real estate landscape.
- Houses represent a significant 69.7% portion, catering likely to families or larger groups.
- The presence of 6.2% Hotel/Boutique listings indicates integration with traditional hospitality.
- Smaller segments like apartment/condo, unique stays (combined 4.8%) offer potential for unique stay experiences.
Town of Rockland Airbnb Room Capacity Analysis (2026): Bedroom Distribution
Distribution of Listings by Number of Bedrooms
Room Capacity Insights for Town of Rockland
- The dominant room capacity in Town of Rockland is 3 bedrooms listings, making up 33.1% of the market. This suggests a strong demand for properties suitable for families or small groups.
- Together, 3 bedrooms and 2 bedrooms properties represent 57.2% of the active Airbnb listings in Town of Rockland, indicating a high concentration in these sizes.
- A significant 51.7% of listings offer 3+ bedrooms, catering to larger groups and families seeking more space in Town of Rockland.
Town of Rockland Vacation Rental Guest Capacity Trends (2026)
Distribution of Listings by Guest Capacity
Guest Capacity Insights for Town of Rockland
- The most common guest capacity trend in Town of Rockland vacation rentals is listings accommodating 6 guests (28.3%). This suggests the primary traveler segment is likely larger groups.
- Properties designed for 6 guests and 8+ guests dominate the Town of Rockland STR market, accounting for 49.7% of listings.
- 53.1% of properties accommodate 6+ guests, serving the market segment for larger families or group travel in Town of Rockland.
- On average, properties in Town of Rockland are equipped to host 5.2 guests.
Town of Rockland Airbnb Booking Patterns (2026): Available vs. Booked Days
Available Days Distribution
Booked Days Distribution
Booking Pattern Insights for Town of Rockland
- The most common availability pattern in Town of Rockland falls within the 271-366 days range, representing 51% of listings. This suggests many properties have significant open periods on their calendars.
- Approximately 86.9% of listings show high availability (181+ days open annually), indicating potential for increased bookings or specific owner usage patterns.
- For booked days, the 31-90 days range is most frequent in Town of Rockland (35.2%), reflecting common guest stay durations or potential owner blocking patterns.
- A notable 16.6% of properties secure long booking periods (181+ days booked per year), highlighting successful long-term rental strategies or significant owner usage.
Town of Rockland Airbnb Minimum Stay Requirements Analysis
Distribution of Listings by Minimum Night Requirement
1 Night
40 listings
27.6% of total
2 Nights
60 listings
41.4% of total
3 Nights
4 listings
2.8% of total
4-6 Nights
1 listings
0.7% of total
30+ Nights
40 listings
27.6% of total
Key Insights
- The most prevalent minimum stay requirement in Town of Rockland is 2 Nights, adopted by 41.4% of listings. This highlights the market's preference for shorter, flexible bookings.
- A strong majority (69.0%) of the Town of Rockland Airbnb data shows acceptance of very short stays (1-2 nights), indicating a dynamic, high-turnover market.
- A significant segment (27.6%) caters to monthly stays (30+ nights) in Town of Rockland, pointing to opportunities in the extended-stay market.
Recommendations
- Align with the market by considering a 2 Nights minimum stay, as 41.4% of Town of Rockland hosts use this setting.
- If feasible, allowing 1-night stays, especially midweek or during low season, could capture last-minute bookings, as only 27.6% currently do.
- Explore offering discounts for stays of 30+ nights to attract the 27.6% of the market seeking extended stays.
- Adjust minimum nights based on seasonality – potentially shorter during low season and longer during peak demand periods in Town of Rockland.
Town of Rockland Airbnb Cancellation Policy Trends Analysis (2026)
Super Strict 30 Days
1 listings
0.7% of total
Limited
1 listings
0.7% of total
Flexible
18 listings
12.5% of total
Moderate
52 listings
36.1% of total
Firm
52 listings
36.1% of total
Strict
20 listings
13.9% of total
Cancellation Policy Insights for Town of Rockland
- The prevailing Airbnb cancellation policy trend in Town of Rockland is Moderate, used by 36.1% of listings.
- There's a relatively balanced mix between guest-friendly (48.6%) and stricter (50.0%) policies, offering choices for different guest needs.
Recommendations for Hosts
- Consider adopting a Moderate policy to align with the 36.1% market standard in Town of Rockland.
- Using a Strict policy might deter some guests, as only 13.9% of listings use it. Evaluate if potential revenue protection outweighs possible lower booking rates.
- Regularly review your cancellation policy against competitors and market demand shifts in Town of Rockland.
Town of Rockland STR Booking Lead Time Analysis (2026)
Average Booking Lead Time by Month
Booking Lead Time Insights for Town of Rockland
- The overall average booking lead time for vacation rentals in Town of Rockland is 58 days.
- Guests book furthest in advance for stays during May (average 67 days), likely coinciding with peak travel demand or local events.
- The shortest booking windows occur for stays in February (average 21 days), indicating more last-minute travel plans during this time.
- Seasonally, Summer (57 days avg.) sees the longest lead times, while Winter (32 days avg.) has the shortest, reflecting typical travel planning cycles.
Recommendations for Hosts
- Use the overall average lead time (58 days) as a baseline for your pricing and availability strategy in Town of Rockland.
- Target marketing efforts for the Summer season well in advance (at least 57 days) to capture early planners.
- Monitor your own booking lead times against these Town of Rockland averages to identify opportunities for dynamic pricing adjustments.
Popular & Essential Airbnb Amenities in Town of Rockland (2026)
Amenity Prevalence
Amenity Insights for Town of Rockland
- Essential amenities in Town of Rockland that guests expect include: Free parking on premises, Wifi, Heating, Smoke alarm. Lacking these (any) could significantly impact bookings.
- Popular amenities like Essentials, Fire extinguisher, Kitchen are common but not universal. Offering these can provide a competitive edge.
Recommendations for Hosts
- Ensure your listing includes all essential amenities for Town of Rockland: Free parking on premises, Wifi, Heating, Smoke alarm.
- Prioritize adding missing essentials: Free parking on premises, Wifi, Heating, Smoke alarm.
- Consider adding popular differentiators like Essentials or Fire extinguisher to increase appeal.
- Highlight unique or less common amenities you offer (e.g., hot tub, dedicated workspace, EV charger) in your listing description and photos.
- Regularly check competitor amenities in Town of Rockland to stay competitive.
Town of Rockland Airbnb Guest Demographics & Profile Analysis (2026)
Guest Profile Summary for Town of Rockland
- The typical guest profile for Airbnb in Town of Rockland consists of primarily domestic travelers (96%), often arriving from nearby New York, typically belonging to the Post-2000s (Gen Z/Alpha) group (50%), primarily speaking English or Spanish.
- Domestic travelers account for 95.5% of guests.
- Key international markets include United States (95.5%) and DC (0.7%).
- Top languages spoken are English (61.9%) followed by Spanish (15.6%).
- A significant demographic segment is the Post-2000s (Gen Z/Alpha) group, representing 50% of guests.
Recommendations for Hosts
- Target domestic marketing efforts towards travelers from New York and Philadelphia.
- Tailor amenities and listing descriptions to appeal to the dominant Post-2000s (Gen Z/Alpha) demographic (e.g., highlight fast WiFi, smart home features, local guides).
- Highlight unique local experiences or amenities relevant to the primary guest profile.
- Consider seasonal promotions aligned with peak travel times for key origin markets.
Nearby Short-Term Rental Market Comparison
How does the Town of Rockland Airbnb market stack up against its neighbors? Compare key performance metrics like average monthly revenue, ADR, and occupancy rates in surrounding areas to understand the broader regional STR landscape.
| Market | Active Properties | Monthly Revenue | Daily Rate | Avg. Occupancy |
|---|---|---|---|---|
| Freeland | 11 | $8,436 | $684.29 | 42% |
| Berlin Township | 15 | $7,208 | $729.10 | 35% |
| Town of Kingston | 10 | $6,470 | $473.76 | 49% |
| Frankford Township | 11 | $6,329 | $505.19 | 41% |
| Spring Lake Heights | 16 | $5,785 | $725.20 | 40% |
| Stroud Township | 137 | $5,728 | $478.40 | 40% |
| Town of Monroe | 22 | $5,690 | $720.52 | 37% |
| Town of Ancram | 22 | $5,616 | $512.55 | 38% |
| Hilltown Township | 11 | $5,557 | $578.96 | 40% |
| Mount Pocono | 22 | $5,346 | $485.18 | 45% |