Town of Providence Airbnb Market Analysis 2026: Short Term Rental Data & Vacation Rental Statistics in New York, United States
Is Airbnb profitable in Town of Providence in 2026? Explore comprehensive Airbnb analytics for Town of Providence, New York, United States to uncover income potential. This 2026 STR market report for Town of Providence, based on AirROI data from February 2025 to January 2026, reveals key trends in the niche market of 21 active listings.
Whether you're considering an Airbnb investment in Town of Providence, optimizing your existing vacation rental, or exploring rental arbitrage opportunities, understanding the Town of Providence Airbnb data is crucial. Leveraging the low regulation environment is key to maximizing your short term rental income potential. Let's dive into the specifics.
Key Town of Providence Airbnb Performance Metrics Overview
Monthly Airbnb Revenue Variations & Income Potential in Town of Providence (2026)
Understanding the monthly revenue variations for Airbnb listings in Town of Providence is key to maximizing your short term rental income potential. Seasonality significantly impacts earnings. Our analysis, based on data from the past 12 months, shows that the peak revenue month for STRs in Town of Providence is typically August, while December often presents the lowest earnings, highlighting opportunities for strategic pricing adjustments during shoulder and low seasons. Explore the typical Airbnb income in Town of Providence across different performance tiers:
- Best-in-class properties (Top 10%) achieve $6,271+ monthly, often utilizing dynamic pricing and superior guest experiences.
- Strong performing properties (Top 25%) earn $3,739 or more, indicating effective management and desirable locations/amenities.
- Typical properties (Median) generate around $2,369 per month, representing the average market performance.
- Entry-level properties (Bottom 25%) see earnings around $1,195, often with potential for optimization.
Average Monthly Airbnb Earnings Trend in Town of Providence
Town of Providence Airbnb Occupancy Rate Trends (2026)
Maximize your bookings by understanding the Town of Providence STR occupancy trends. Seasonal demand shifts significantly influence how often properties are booked. Typically, Augustsees the highest demand (peak season occupancy), while December experiences the lowest (low season). Effective strategies, like adjusting minimum stays or offering promotions, can boost occupancy during slower periods. Here's how different property tiers perform in Town of Providence:
- Best-in-class properties (Top 10%) achieve 74%+ occupancy, indicating high desirability and potentially optimized availability.
- Strong performing properties (Top 25%) maintain 55% or higher occupancy, suggesting good market fit and guest satisfaction.
- Typical properties (Median) have an occupancy rate around 36%.
- Entry-level properties (Bottom 25%) average 18% occupancy, potentially facing higher vacancy.
Average Monthly Occupancy Rate Trend in Town of Providence
Average Daily Rate (ADR) Airbnb Trends in Town of Providence (2026)
Effective short term rental pricing strategy in Town of Providence involves understanding monthly ADR fluctuations. The Average Daily Rate (ADR) for Airbnb in Town of Providence typically peaks in June and dips lowest during January. Leveraging Airbnb dynamic pricing tools or strategies based on this seasonality can significantly boost revenue. Here's a look at the typical nightly rates achieved:
- Best-in-class properties (Top 10%) command rates of $502+ per night, often due to premium features or locations.
- Strong performing properties (Top 25%) achieve nightly rates of $307 or more.
- Typical properties (Median) charge around $179 per night.
- Entry-level properties (Bottom 25%) earn around $138 per night.
Average Daily Rate (ADR) Trend by Month in Town of Providence
Get Live Town of Providence Market Intelligence 👇

Explore Real-time Analytics
Airbnb Seasonality Analysis & Trends in Town of Providence (2026)
Peak Season (August, July, September)
- Revenue averages $4,478 per month
- Occupancy rates average 52.6%
- Daily rates average $288
Shoulder Season
- Revenue averages $2,747 per month
- Occupancy maintains around 37.0%
- Daily rates hold near $267
Low Season (February, May, December)
- Revenue drops to average $2,023 per month
- Occupancy decreases to average 30.0%
- Daily rates adjust to average $260
Seasonality Insights for Town of Providence
- The Airbnb seasonality in Town of Providence shows highly seasonal trends requiring careful strategy. While the sections above show seasonal averages, it's also insightful to look at the extremes:
- During the high season, the absolute peak month showcases Town of Providence's highest earning potential, with monthly revenues capable of climbing to $5,147, occupancy reaching a high of 57.7%, and ADRs peaking at $300.
- Conversely, the slowest single month of the year, typically falling within the low season, marks the market's lowest point. In this month, revenue might dip to $1,797, occupancy could drop to 24.2%, and ADRs may adjust down to $252.
- Understanding both the seasonal averages and these monthly peaks and troughs in revenue, occupancy, and ADR is crucial for maximizing your Airbnb profit potential in Town of Providence.
Seasonal Strategies for Maximizing Profit
- Peak Season: Maximize revenue through premium pricing and potentially longer minimum stays. Ensure high availability.
- Low Season: Offer competitive pricing, special promotions (e.g., extended stay discounts), and flexible cancellation policies. Target off-season travelers like remote workers or budget-conscious guests.
- Shoulder Seasons: Implement dynamic pricing that balances peak and low rates. Target weekend travelers or specific events. Offer slightly more flexible terms than peak season.
- Regularly analyze your own performance against these Town of Providence seasonality benchmarks and adjust your pricing and availability strategy accordingly.
Best Areas for Airbnb Investment in Town of Providence (2026)
Exploring the top neighborhoods for short-term rentals in Town of Providence? This section highlights key areas, outlining why they are attractive for hosts and guests, along with notable local attractions. Consider these locations based on your target guest profile and investment strategy.
| Neighborhood / Area | Why Host Here? (Target Guests & Appeal) | Key Attractions & Landmarks |
|---|---|---|
| Federal Hill | Known for its rich Italian heritage and vibrant dining scene, Federal Hill attracts tourists looking for authentic cuisine and local culture. | Federal Hill Restaurants, Atwells Avenue, DePasquale Square, Italian Heritage Park, Art galleries, Local bakeries |
| College Hill | Home to Brown University and the Rhode Island School of Design, College Hill is a charming neighborhood with historic architecture and a youthful vibe, making it popular among students and visiting families. | Brown University, RISD Museum, The John Brown House, Benefit Street, Thayer Street shops, College Hill historic district |
| East Side | The East Side features picturesque neighborhoods and is known for its beautiful parks, making it ideal for families and visitors seeking a peaceful environment close to downtown. | Blackstone Park, Ladd Observatory, India Point Park, Mills Tavern, Local boutiques, Historic homes |
| Downcity/Financial District | This area is the downtown core of Providence, offering a mix of business and leisure attractions including hotels, restaurants, and the Providence Performing Arts Center, appealing to travelers and corporate visitors alike. | Providence Place Mall, WaterFire, Dunkin' Donuts Center, The Arcade, The Rhode Island Convention Center, Local theaters |
| Smith Hill | Smith Hill is a diverse neighborhood with easy access to downtown, featuring a mix of residential homes and local shops. It attracts both tourists and locals looking for a central base. | Providence College, Smith Hill Park, Local cafes, Market Square, Historic sites |
| Fox Point | This waterfront neighborhood is known for its trendy vibe and proximity to the waterfront, making it a desirable location for visitors wanting a bustling urban atmosphere with scenic views. | India Point Park, Waterfront dining, Local art galleries, Farmers markets, Cultural events |
| West End | Diverse and multicultural, the West End is becoming increasingly popular among creative types and offers an array of unique dining options and community events. | The Steel Yard, Local breweries, Art studios, West End Farmers Market, Historic architecture |
| Elmwood | Elmwood offers a suburban feel with easy access to the city’s attractions. It's becoming a popular neighborhood for families and tourists looking for local charm. | Roger Williams Park, Elmwood Park, Local shops, Historic homes, Outdoor activities |
Understanding Airbnb License Requirements & STR Laws in Town of Providence (2026)
While Town of Providence, New York, United States currently shows low STR regulations, specific Airbnb license requirements might still exist or change. Always verify the latest short term rental regulations and Airbnb license requirements directly with local government authorities for Town of Providence to ensure full compliance before hosting.
(Source: AirROI data, 2026, finding no licensed listings among those analyzed)
Top Performing Airbnb Properties in Town of Providence (2026)
Benchmark your potential! Explore examples of top-performing Airbnb properties in Town of Providencebased on Trailing Twelve Month (TTM) revenue. Analyze their characteristics, revenue, occupancy rate, and ADR to understand what drives success in this market.
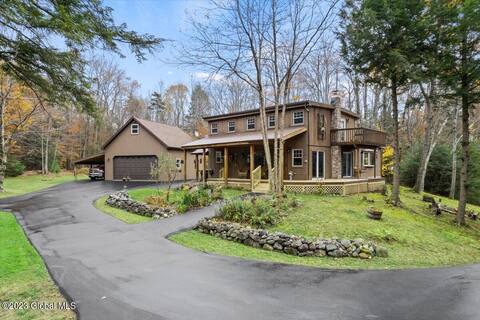
Private, Peaceful Lakehouse - 25 Min. to Saratoga
Entire Place • 3 bedrooms
ADK Hideaway
Entire Place • 3 bedrooms
The Fish House Lodge
Entire Place • 4 bedrooms

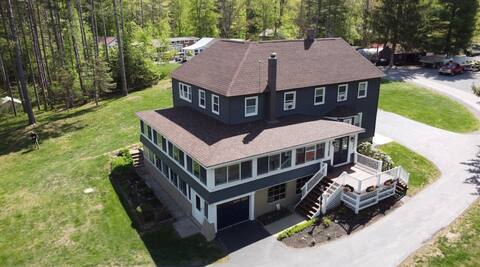
House at Great Sacandaga Lake
Entire Place • 3 bedrooms

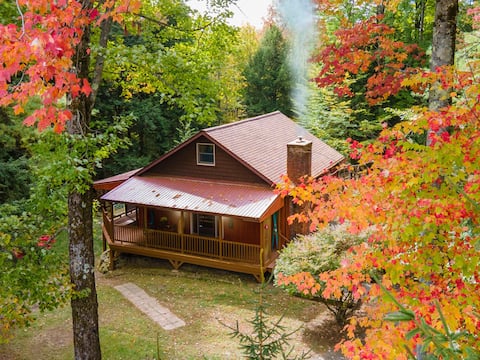
Cozy Adirondack Lodge | Pond, AC, Pet-Friend
Entire Place • 2 bedrooms

Retro Retreat & Spa
Entire Place • 3 bedrooms
Note: Performance varies based on location, size, amenities, seasonality, and management quality. Data reflects the past 12 months.
Top Performing Airbnb Hosts in Town of Providence (2026)
Learn from the best! This table showcases top-performing Airbnb hosts in Town of Providence based on the number of properties managed and estimated total revenue over the past year. Analyze their scale and performance metrics.
| Host Name | Properties | Grossing Revenue | Stay Reviews | Avg Rating |
|---|---|---|---|---|
| Helen | 6 | $110,105 | 293 | 4.97/5.0 |
| Dan | 4 | $99,910 | 331 | 4.79/5.0 |
| Jennifer | 1 | $64,188 | 41 | 4.93/5.0 |
| Thomas | 1 | $59,324 | 122 | 4.94/5.0 |
| Michael | 1 | $56,890 | 15 | 5.00/5.0 |
| Angelina | 1 | $47,639 | 58 | 4.83/5.0 |
| Sue | 1 | $23,501 | 28 | 4.89/5.0 |
| Kim | 1 | $23,358 | 16 | 5.00/5.0 |
| Brian | 1 | $23,167 | 3 | 5.00/5.0 |
| Dom | 1 | $18,525 | 38 | 4.82/5.0 |
Analyzing the strategies of top hosts, such as their property selection, pricing, and guest communication, can offer valuable lessons for optimizing your own Airbnb operations in Town of Providence.
Dive Deeper: Advanced Town of Providence STR Market Data (2026)
Ready to unlock more insights? AirROI provides access to advanced metrics and comprehensive Airbnb data for Town of Providence. Explore detailed analytics beyond this report to refine your investment strategy, optimize pricing, and maximize your vacation rental profits.
Explore Advanced MetricsTown of Providence Short-Term Rental Market Composition (2026): Property & Room Types
Room Type Distribution
Property Type Distribution
Market Composition Insights for Town of Providence
- The Town of Providence Airbnb market composition is heavily skewed towards Entire Home/Apt listings, which make up 100% of the 21 active rentals. This indicates strong guest preference for privacy and space.
- Looking at the property type distribution in Town of Providence, House properties are the most common (47.6%), reflecting the local real estate landscape.
- Houses represent a significant 47.6% portion, catering likely to families or larger groups.
Town of Providence Airbnb Room Capacity Analysis (2026): Bedroom Distribution
Distribution of Listings by Number of Bedrooms
Room Capacity Insights for Town of Providence
- The dominant room capacity in Town of Providence is 2 bedrooms listings, making up 28.6% of the market. This suggests a strong demand for properties suitable for couples or solo travelers.
- Together, 2 bedrooms and 1 bedroom properties represent 57.2% of the active Airbnb listings in Town of Providence, indicating a high concentration in these sizes.
- A significant 28.6% of listings offer 3+ bedrooms, catering to larger groups and families seeking more space in Town of Providence.
Town of Providence Vacation Rental Guest Capacity Trends (2026)
Distribution of Listings by Guest Capacity
Guest Capacity Insights for Town of Providence
- The most common guest capacity trend in Town of Providence vacation rentals is listings accommodating 4 guests (33.3%). This suggests the primary traveler segment is likely small families or groups.
- Properties designed for 4 guests and 8+ guests dominate the Town of Providence STR market, accounting for 57.1% of listings.
- 42.8% of properties accommodate 6+ guests, serving the market segment for larger families or group travel in Town of Providence.
- On average, properties in Town of Providence are equipped to host 5.1 guests.
Town of Providence Airbnb Booking Patterns (2026): Available vs. Booked Days
Available Days Distribution
Booked Days Distribution
Booking Pattern Insights for Town of Providence
- The most common availability pattern in Town of Providence falls within the 271-366 days range, representing 47.6% of listings. This suggests many properties have significant open periods on their calendars.
- Approximately 80.9% of listings show high availability (181+ days open annually), indicating potential for increased bookings or specific owner usage patterns.
- For booked days, the 31-90 days range is most frequent in Town of Providence (42.9%), reflecting common guest stay durations or potential owner blocking patterns.
- A notable 19.0% of properties secure long booking periods (181+ days booked per year), highlighting successful long-term rental strategies or significant owner usage.
Town of Providence Airbnb Minimum Stay Requirements Analysis
Distribution of Listings by Minimum Night Requirement
1 Night
6 listings
28.6% of total
2 Nights
4 listings
19% of total
30+ Nights
11 listings
52.4% of total
Key Insights
- The most prevalent minimum stay requirement in Town of Providence is 30+ Nights, adopted by 52.4% of listings. This highlights the market's preference for longer commitments.
- A significant segment (52.4%) caters to monthly stays (30+ nights) in Town of Providence, pointing to opportunities in the extended-stay market.
Recommendations
- Align with the market by considering a 30+ Nights minimum stay, as 52.4% of Town of Providence hosts use this setting.
- If feasible, allowing 1-night stays, especially midweek or during low season, could capture last-minute bookings, as only 28.6% currently do.
- Explore offering discounts for stays of 30+ nights to attract the 52.4% of the market seeking extended stays.
- Adjust minimum nights based on seasonality – potentially shorter during low season and longer during peak demand periods in Town of Providence.
Town of Providence Airbnb Cancellation Policy Trends Analysis (2026)
Flexible
7 listings
33.3% of total
Moderate
5 listings
23.8% of total
Firm
9 listings
42.9% of total
Cancellation Policy Insights for Town of Providence
- The prevailing Airbnb cancellation policy trend in Town of Providence is Firm, used by 42.9% of listings.
- There's a relatively balanced mix between guest-friendly (57.1%) and stricter (42.9%) policies, offering choices for different guest needs.
Recommendations for Hosts
- Consider adopting a Firm policy to align with the 42.9% market standard in Town of Providence.
- Regularly review your cancellation policy against competitors and market demand shifts in Town of Providence.
Town of Providence STR Booking Lead Time Analysis (2026)
Average Booking Lead Time by Month
Booking Lead Time Insights for Town of Providence
- The overall average booking lead time for vacation rentals in Town of Providence is 58 days.
- Guests book furthest in advance for stays during August (average 80 days), likely coinciding with peak travel demand or local events.
- The shortest booking windows occur for stays in January (average 15 days), indicating more last-minute travel plans during this time.
- Seasonally, Summer (70 days avg.) sees the longest lead times, while Winter (21 days avg.) has the shortest, reflecting typical travel planning cycles.
Recommendations for Hosts
- Use the overall average lead time (58 days) as a baseline for your pricing and availability strategy in Town of Providence.
- For August stays, consider implementing length-of-stay discounts or slightly higher rates for bookings made less than 80 days out to capitalize on advance planning.
- Target marketing efforts for the Summer season well in advance (at least 70 days) to capture early planners.
- Monitor your own booking lead times against these Town of Providence averages to identify opportunities for dynamic pricing adjustments.
Popular & Essential Airbnb Amenities in Town of Providence (2026)
Amenity Prevalence
Amenity Insights for Town of Providence
- Essential amenities in Town of Providence that guests expect include: Free parking on premises, Fire extinguisher. Lacking these (any) could significantly impact bookings.
- Popular amenities like Coffee maker, Barbecue utensils, Wifi are common but not universal. Offering these can provide a competitive edge.
- Warning: Wifi is not universally provided but is considered essential globally. Ensure reliable Wifi is offered.
Recommendations for Hosts
- Ensure your listing includes all essential amenities for Town of Providence: Free parking on premises, Fire extinguisher.
- Prioritize adding missing essentials: Fire extinguisher.
- Consider adding popular differentiators like Coffee maker or Barbecue utensils to increase appeal.
- Highlight unique or less common amenities you offer (e.g., hot tub, dedicated workspace, EV charger) in your listing description and photos.
- Regularly check competitor amenities in Town of Providence to stay competitive.
Town of Providence Airbnb Guest Demographics & Profile Analysis (2026)
Guest Profile Summary for Town of Providence
- The typical guest profile for Airbnb in Town of Providence consists of primarily domestic travelers (98%), often arriving from nearby New York, typically belonging to the Post-2000s (Gen Z/Alpha) group (50%), primarily speaking English or Spanish.
- Domestic travelers account for 97.7% of guests.
- Key international markets include United States (97.7%) and Germany (0.8%).
- Top languages spoken are English (80.8%) followed by Spanish (11.5%).
- A significant demographic segment is the Post-2000s (Gen Z/Alpha) group, representing 50% of guests.
Recommendations for Hosts
- Target domestic marketing efforts towards travelers from New York and Boston.
- Tailor amenities and listing descriptions to appeal to the dominant Post-2000s (Gen Z/Alpha) demographic (e.g., highlight fast WiFi, smart home features, local guides).
- Highlight unique local experiences or amenities relevant to the primary guest profile.
- Consider seasonal promotions aligned with peak travel times for key origin markets.
Nearby Short-Term Rental Market Comparison
How does the Town of Providence Airbnb market stack up against its neighbors? Compare key performance metrics like average monthly revenue, ADR, and occupancy rates in surrounding areas to understand the broader regional STR landscape.
| Market | Active Properties | Monthly Revenue | Daily Rate | Avg. Occupancy |
|---|---|---|---|---|
| Town of Trenton | 13 | $7,410 | $484.59 | 43% |
| Middletown Springs | 13 | $6,843 | $507.55 | 32% |
| Fort Ann | 35 | $6,238 | $790.41 | 37% |
| Town of Ancram | 22 | $5,616 | $512.55 | 38% |
| Town of Schodack | 11 | $5,158 | $555.89 | 29% |
| Town of Stillwater | 55 | $5,153 | $564.54 | 42% |
| Monterey | 41 | $5,089 | $470.60 | 44% |
| Malletts Bay | 51 | $4,842 | $444.86 | 41% |
| Town of Wilton | 103 | $4,841 | $862.83 | 38% |
| Colebrook | 10 | $4,710 | $601.82 | 28% |