Town of New Paltz Airbnb Market Analysis 2026: Short Term Rental Data & Vacation Rental Statistics in New York, United States
Is Airbnb profitable in Town of New Paltz in 2026? Explore comprehensive Airbnb analytics for Town of New Paltz, New York, United States to uncover income potential. This 2026 STR market report for Town of New Paltz, based on AirROI data from February 2025 to January 2026, reveals key trends in the niche market of 121 active listings.
Whether you're considering an Airbnb investment in Town of New Paltz, optimizing your existing vacation rental, or exploring rental arbitrage opportunities, understanding the Town of New Paltz Airbnb data is crucial. Leveraging the low regulation environment is key to maximizing your short term rental income potential. Let's dive into the specifics.
Key Town of New Paltz Airbnb Performance Metrics Overview
Monthly Airbnb Revenue Variations & Income Potential in Town of New Paltz (2026)
Understanding the monthly revenue variations for Airbnb listings in Town of New Paltz is key to maximizing your short term rental income potential. Seasonality significantly impacts earnings. Our analysis, based on data from the past 12 months, shows that the peak revenue month for STRs in Town of New Paltz is typically August, while February often presents the lowest earnings, highlighting opportunities for strategic pricing adjustments during shoulder and low seasons. Explore the typical Airbnb income in Town of New Paltz across different performance tiers:
- Best-in-class properties (Top 10%) achieve $9,877+ monthly, often utilizing dynamic pricing and superior guest experiences.
- Strong performing properties (Top 25%) earn $5,749 or more, indicating effective management and desirable locations/amenities.
- Typical properties (Median) generate around $3,039 per month, representing the average market performance.
- Entry-level properties (Bottom 25%) see earnings around $1,608, often with potential for optimization.
Average Monthly Airbnb Earnings Trend in Town of New Paltz
Town of New Paltz Airbnb Occupancy Rate Trends (2026)
Maximize your bookings by understanding the Town of New Paltz STR occupancy trends. Seasonal demand shifts significantly influence how often properties are booked. Typically, Octobersees the highest demand (peak season occupancy), while January experiences the lowest (low season). Effective strategies, like adjusting minimum stays or offering promotions, can boost occupancy during slower periods. Here's how different property tiers perform in Town of New Paltz:
- Best-in-class properties (Top 10%) achieve 79%+ occupancy, indicating high desirability and potentially optimized availability.
- Strong performing properties (Top 25%) maintain 62% or higher occupancy, suggesting good market fit and guest satisfaction.
- Typical properties (Median) have an occupancy rate around 42%.
- Entry-level properties (Bottom 25%) average 25% occupancy, potentially facing higher vacancy.
Average Monthly Occupancy Rate Trend in Town of New Paltz
Average Daily Rate (ADR) Airbnb Trends in Town of New Paltz (2026)
Effective short term rental pricing strategy in Town of New Paltz involves understanding monthly ADR fluctuations. The Average Daily Rate (ADR) for Airbnb in Town of New Paltz typically peaks in October and dips lowest during March. Leveraging Airbnb dynamic pricing tools or strategies based on this seasonality can significantly boost revenue. Here's a look at the typical nightly rates achieved:
- Best-in-class properties (Top 10%) command rates of $611+ per night, often due to premium features or locations.
- Strong performing properties (Top 25%) achieve nightly rates of $387 or more.
- Typical properties (Median) charge around $216 per night.
- Entry-level properties (Bottom 25%) earn around $154 per night.
Average Daily Rate (ADR) Trend by Month in Town of New Paltz
Get Live Town of New Paltz Market Intelligence 👇

Explore Real-time Analytics
Airbnb Seasonality Analysis & Trends in Town of New Paltz (2026)
Peak Season (August, July, October)
- Revenue averages $6,041 per month
- Occupancy rates average 55.5%
- Daily rates average $324
Shoulder Season
- Revenue averages $4,388 per month
- Occupancy maintains around 43.4%
- Daily rates hold near $314
Low Season (January, February, April)
- Revenue drops to average $3,044 per month
- Occupancy decreases to average 35.6%
- Daily rates adjust to average $295
Seasonality Insights for Town of New Paltz
- The Airbnb seasonality in Town of New Paltz shows highly seasonal trends requiring careful strategy. While the sections above show seasonal averages, it's also insightful to look at the extremes:
- During the high season, the absolute peak month showcases Town of New Paltz's highest earning potential, with monthly revenues capable of climbing to $6,347, occupancy reaching a high of 56.8%, and ADRs peaking at $331.
- Conversely, the slowest single month of the year, typically falling within the low season, marks the market's lowest point. In this month, revenue might dip to $2,730, occupancy could drop to 34.3%, and ADRs may adjust down to $280.
- Understanding both the seasonal averages and these monthly peaks and troughs in revenue, occupancy, and ADR is crucial for maximizing your Airbnb profit potential in Town of New Paltz.
Seasonal Strategies for Maximizing Profit
- Peak Season: Maximize revenue through premium pricing and potentially longer minimum stays. Ensure high availability.
- Low Season: Offer competitive pricing, special promotions (e.g., extended stay discounts), and flexible cancellation policies. Target off-season travelers like remote workers or budget-conscious guests.
- Shoulder Seasons: Implement dynamic pricing that balances peak and low rates. Target weekend travelers or specific events. Offer slightly more flexible terms than peak season.
- Regularly analyze your own performance against these Town of New Paltz seasonality benchmarks and adjust your pricing and availability strategy accordingly.
Best Areas for Airbnb Investment in Town of New Paltz (2026)
Exploring the top neighborhoods for short-term rentals in Town of New Paltz? This section highlights key areas, outlining why they are attractive for hosts and guests, along with notable local attractions. Consider these locations based on your target guest profile and investment strategy.
| Neighborhood / Area | Why Host Here? (Target Guests & Appeal) | Key Attractions & Landmarks |
|---|---|---|
| Downtown New Paltz | The heart of the town, offering vibrant local shops, restaurants, and cafes. Ideal for guests wanting to experience the local culture and community events. | Historic Huguenot Street, New Paltz Farmers Market, Water Street Market, Local eateries and cafes, Live music venues |
| Mohonk Preserve | A breathtaking natural area with hiking, rock climbing, and scenic views. Attracts nature lovers and outdoor enthusiasts looking for a peaceful escape. | Mohonk Lake, Lake Minnewaska, Nature trails, Rock climbing, Scenic overlooks |
| State University of New York at New Paltz | Home to a major college campus, this area caters to students, parents, and visitors attending college events or seeking educational opportunities. | Campus tours, Cultural events, Art exhibitions, College sports events |
| Highland | Just across the river with beautiful views of New Paltz, providing a quiet setting and access to the Hudson Valley's offerings. | Walkway Over the Hudson, Scenic views of the Hudson River, Local parks, Dining options |
| New Paltz Historic District | Rich in history and charm, this area features quaint streets and historic buildings, appealing to guests interested in history and culture. | Huguenot Street Historic District, Local history museums, Charming architecture |
| Culinary Scene | New Paltz boasts a vibrant culinary scene, attracting foodies and those looking to enjoy diverse dining experiences locally. | Farm-to-table restaurants, Local wineries, Brewery tours, Food festivals |
| Nature Trails and Parks | The surrounding area offers numerous trails and parks for hiking and outdoor activities, appealing to adventure seekers. | Minnewaska State Park, Mills-Norrie State Park, Local nature trails, Bird watching spots |
| Art and Culture Scene | New Paltz has a thriving arts community, with galleries and cultural events that attract visitors interested in the local arts scene. | Local art galleries, Theater performances, Annual art festivals, Craft fairs |
Understanding Airbnb License Requirements & STR Laws in Town of New Paltz (2026)
While Town of New Paltz, New York, United States currently shows low STR regulations, specific Airbnb license requirements might still exist or change. Always verify the latest short term rental regulations and Airbnb license requirements directly with local government authorities for Town of New Paltz to ensure full compliance before hosting.
(Source: AirROI data, 2026, finding no licensed listings among those analyzed)
Top Performing Airbnb Properties in Town of New Paltz (2026)
Benchmark your potential! Explore examples of top-performing Airbnb properties in Town of New Paltzbased on Trailing Twelve Month (TTM) revenue. Analyze their characteristics, revenue, occupancy rate, and ADR to understand what drives success in this market.
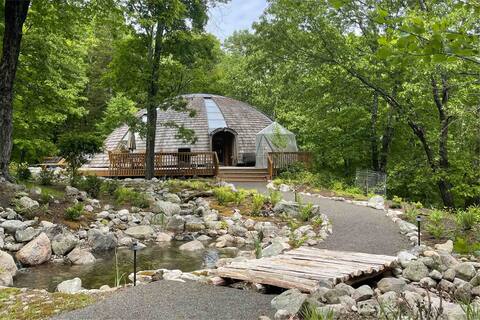
Dome 2Home Villa - Hot Tubs, Sauna & Piano
Entire Place • 9 bedrooms
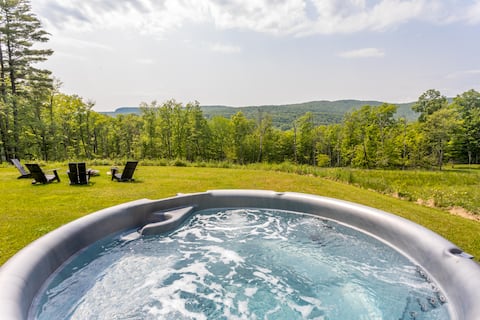
Stunning Mntn Views• Heated Pool• H/Tub• Sauna
Entire Place • 4 bedrooms

The New Paltz Moondance Ridge
Entire Place • 5 bedrooms
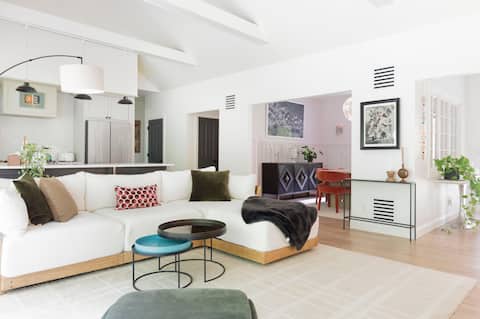
wooded seclusion meets ultimate luxury and style
Entire Place • 4 bedrooms
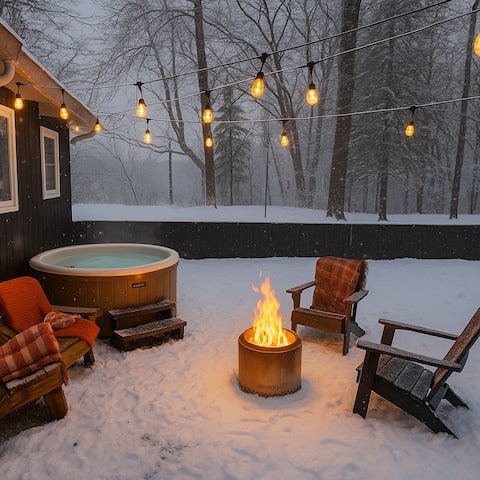
midcentury mod * HOT TUB * walk out trail 2 mohonk
Entire Place • 3 bedrooms
Scenic River View Escape | New Paltz
Entire Place • 4 bedrooms
Note: Performance varies based on location, size, amenities, seasonality, and management quality. Data reflects the past 12 months.
Top Performing Airbnb Hosts in Town of New Paltz (2026)
Learn from the best! This table showcases top-performing Airbnb hosts in Town of New Paltz based on the number of properties managed and estimated total revenue over the past year. Analyze their scale and performance metrics.
| Host Name | Properties | Grossing Revenue | Stay Reviews | Avg Rating |
|---|---|---|---|---|
| Renata | 3 | $468,307 | 121 | 4.80/5.0 |
| Pablo | 4 | $224,788 | 18 | 5.00/5.0 |
| Susanna | 1 | $178,967 | 63 | 4.95/5.0 |
| Shintaro | 2 | $163,749 | 220 | 4.91/5.0 |
| Danielle | 1 | $151,224 | 20 | 5.00/5.0 |
| Susan | 1 | $148,689 | 517 | 4.98/5.0 |
| Libertyville | 1 | $143,249 | 192 | 4.88/5.0 |
| Liz | 2 | $134,264 | 459 | 4.95/5.0 |
| Angelo | 3 | $133,939 | 52 | 4.91/5.0 |
| Nathan | 1 | $112,169 | 141 | 4.93/5.0 |
Analyzing the strategies of top hosts, such as their property selection, pricing, and guest communication, can offer valuable lessons for optimizing your own Airbnb operations in Town of New Paltz.
Dive Deeper: Advanced Town of New Paltz STR Market Data (2026)
Ready to unlock more insights? AirROI provides access to advanced metrics and comprehensive Airbnb data for Town of New Paltz. Explore detailed analytics beyond this report to refine your investment strategy, optimize pricing, and maximize your vacation rental profits.
Explore Advanced MetricsTown of New Paltz Short-Term Rental Market Composition (2026): Property & Room Types
Room Type Distribution
Property Type Distribution
Market Composition Insights for Town of New Paltz
- The Town of New Paltz Airbnb market composition is heavily skewed towards Entire Home/Apt listings, which make up 81.8% of the 121 active rentals. This indicates strong guest preference for privacy and space.
- Looking at the property type distribution in Town of New Paltz, House properties are the most common (55.4%), reflecting the local real estate landscape.
- Houses represent a significant 55.4% portion, catering likely to families or larger groups.
- The presence of 7.4% Hotel/Boutique listings indicates integration with traditional hospitality.
- Smaller segments like unique stays (combined 3.3%) offer potential for unique stay experiences.
Town of New Paltz Airbnb Room Capacity Analysis (2026): Bedroom Distribution
Distribution of Listings by Number of Bedrooms
Room Capacity Insights for Town of New Paltz
- The dominant room capacity in Town of New Paltz is 1 bedroom listings, making up 24.8% of the market. This suggests a strong demand for properties suitable for couples or solo travelers.
- Together, 1 bedroom and 2 bedrooms properties represent 43.8% of the active Airbnb listings in Town of New Paltz, indicating a high concentration in these sizes.
- A significant 36.3% of listings offer 3+ bedrooms, catering to larger groups and families seeking more space in Town of New Paltz.
Town of New Paltz Vacation Rental Guest Capacity Trends (2026)
Distribution of Listings by Guest Capacity
Guest Capacity Insights for Town of New Paltz
- The most common guest capacity trend in Town of New Paltz vacation rentals is listings accommodating 8+ guests (22.3%). This suggests the primary traveler segment is likely larger groups.
- Properties designed for 8+ guests and 4 guests dominate the Town of New Paltz STR market, accounting for 42.1% of listings.
- 37.2% of properties accommodate 6+ guests, serving the market segment for larger families or group travel in Town of New Paltz.
- On average, properties in Town of New Paltz are equipped to host 4.2 guests.
Town of New Paltz Airbnb Booking Patterns (2026): Available vs. Booked Days
Available Days Distribution
Booked Days Distribution
Booking Pattern Insights for Town of New Paltz
- The most common availability pattern in Town of New Paltz falls within the 271-366 days range, representing 35.5% of listings. This suggests many properties have significant open periods on their calendars.
- Approximately 71.0% of listings show high availability (181+ days open annually), indicating potential for increased bookings or specific owner usage patterns.
- For booked days, the 91-180 days range is most frequent in Town of New Paltz (39.7%), reflecting common guest stay durations or potential owner blocking patterns.
- A notable 28.9% of properties secure long booking periods (181+ days booked per year), highlighting successful long-term rental strategies or significant owner usage.
Town of New Paltz Airbnb Minimum Stay Requirements Analysis
Distribution of Listings by Minimum Night Requirement
1 Night
26 listings
21.5% of total
2 Nights
57 listings
47.1% of total
3 Nights
2 listings
1.7% of total
4-6 Nights
3 listings
2.5% of total
7-29 Nights
1 listings
0.8% of total
30+ Nights
32 listings
26.4% of total
Key Insights
- The most prevalent minimum stay requirement in Town of New Paltz is 2 Nights, adopted by 47.1% of listings. This highlights the market's preference for shorter, flexible bookings.
- A strong majority (68.6%) of the Town of New Paltz Airbnb data shows acceptance of very short stays (1-2 nights), indicating a dynamic, high-turnover market.
- A significant segment (26.4%) caters to monthly stays (30+ nights) in Town of New Paltz, pointing to opportunities in the extended-stay market.
Recommendations
- Align with the market by considering a 2 Nights minimum stay, as 47.1% of Town of New Paltz hosts use this setting.
- If feasible, allowing 1-night stays, especially midweek or during low season, could capture last-minute bookings, as only 21.5% currently do.
- Explore offering discounts for stays of 30+ nights to attract the 26.4% of the market seeking extended stays.
- Adjust minimum nights based on seasonality – potentially shorter during low season and longer during peak demand periods in Town of New Paltz.
Town of New Paltz Airbnb Cancellation Policy Trends Analysis (2026)
Super Strict 60 Days
1 listings
0.8% of total
Limited
1 listings
0.8% of total
Super Strict 30 Days
3 listings
2.5% of total
Flexible
19 listings
15.7% of total
Moderate
42 listings
34.7% of total
Firm
40 listings
33.1% of total
Strict
15 listings
12.4% of total
Cancellation Policy Insights for Town of New Paltz
- The prevailing Airbnb cancellation policy trend in Town of New Paltz is Moderate, used by 34.7% of listings.
- There's a relatively balanced mix between guest-friendly (50.4%) and stricter (45.5%) policies, offering choices for different guest needs.
Recommendations for Hosts
- Consider adopting a Moderate policy to align with the 34.7% market standard in Town of New Paltz.
- Using a Strict policy might deter some guests, as only 12.4% of listings use it. Evaluate if potential revenue protection outweighs possible lower booking rates.
- Regularly review your cancellation policy against competitors and market demand shifts in Town of New Paltz.
Town of New Paltz STR Booking Lead Time Analysis (2026)
Average Booking Lead Time by Month
Booking Lead Time Insights for Town of New Paltz
- The overall average booking lead time for vacation rentals in Town of New Paltz is 46 days.
- Guests book furthest in advance for stays during May (average 76 days), likely coinciding with peak travel demand or local events.
- The shortest booking windows occur for stays in February (average 26 days), indicating more last-minute travel plans during this time.
- Seasonally, Summer (52 days avg.) sees the longest lead times, while Winter (32 days avg.) has the shortest, reflecting typical travel planning cycles.
Recommendations for Hosts
- Use the overall average lead time (46 days) as a baseline for your pricing and availability strategy in Town of New Paltz.
- For May stays, consider implementing length-of-stay discounts or slightly higher rates for bookings made less than 76 days out to capitalize on advance planning.
- Target marketing efforts for the Summer season well in advance (at least 52 days) to capture early planners.
- Monitor your own booking lead times against these Town of New Paltz averages to identify opportunities for dynamic pricing adjustments.
Popular & Essential Airbnb Amenities in Town of New Paltz (2026)
Amenity Prevalence
Amenity Insights for Town of New Paltz
- Essential amenities in Town of New Paltz that guests expect include: Wifi, Smoke alarm, Hot water, Free parking on premises, Air conditioning. Lacking these (any) could significantly impact bookings.
- Popular amenities like Heating, Coffee maker, Fire extinguisher are common but not universal. Offering these can provide a competitive edge.
Recommendations for Hosts
- Ensure your listing includes all essential amenities for Town of New Paltz: Wifi, Smoke alarm, Hot water, Free parking on premises, Air conditioning.
- Prioritize adding missing essentials: Wifi, Smoke alarm, Hot water, Free parking on premises, Air conditioning.
- Consider adding popular differentiators like Heating or Coffee maker to increase appeal.
- Highlight unique or less common amenities you offer (e.g., hot tub, dedicated workspace, EV charger) in your listing description and photos.
- Regularly check competitor amenities in Town of New Paltz to stay competitive.
Town of New Paltz Airbnb Guest Demographics & Profile Analysis (2026)
Guest Profile Summary for Town of New Paltz
- The typical guest profile for Airbnb in Town of New Paltz consists of primarily domestic travelers (96%), often arriving from nearby New York, typically belonging to the Post-2000s (Gen Z/Alpha) group (50%), primarily speaking English or Spanish.
- Domestic travelers account for 95.6% of guests.
- Key international markets include United States (95.6%) and DC (1.2%).
- Top languages spoken are English (63.4%) followed by Spanish (13.8%).
- A significant demographic segment is the Post-2000s (Gen Z/Alpha) group, representing 50% of guests.
Recommendations for Hosts
- Target domestic marketing efforts towards travelers from New York and Philadelphia.
- Tailor amenities and listing descriptions to appeal to the dominant Post-2000s (Gen Z/Alpha) demographic (e.g., highlight fast WiFi, smart home features, local guides).
- Highlight unique local experiences or amenities relevant to the primary guest profile.
- Consider seasonal promotions aligned with peak travel times for key origin markets.
Nearby Short-Term Rental Market Comparison
How does the Town of New Paltz Airbnb market stack up against its neighbors? Compare key performance metrics like average monthly revenue, ADR, and occupancy rates in surrounding areas to understand the broader regional STR landscape.
| Market | Active Properties | Monthly Revenue | Daily Rate | Avg. Occupancy |
|---|---|---|---|---|
| Freeland | 11 | $8,436 | $684.29 | 42% |
| Berlin Township | 15 | $7,208 | $729.10 | 35% |
| Town of Kingston | 10 | $6,470 | $473.76 | 49% |
| Frankford Township | 11 | $6,329 | $505.19 | 41% |
| Spring Lake Heights | 16 | $5,785 | $725.20 | 40% |
| Stroud Township | 137 | $5,728 | $478.40 | 40% |
| Town of Monroe | 22 | $5,690 | $720.52 | 37% |
| Town of Ancram | 22 | $5,616 | $512.55 | 38% |
| Hilltown Township | 11 | $5,557 | $578.96 | 40% |
| Mount Pocono | 22 | $5,346 | $485.18 | 45% |