Town of Liberty Airbnb Market Analysis 2026: Short Term Rental Data & Vacation Rental Statistics in New York, United States
Is Airbnb profitable in Town of Liberty in 2026? Explore comprehensive Airbnb analytics for Town of Liberty, New York, United States to uncover income potential. This 2026 STR market report for Town of Liberty, based on AirROI data from February 2025 to January 2026, reveals key trends in the niche market of 89 active listings.
Whether you're considering an Airbnb investment in Town of Liberty, optimizing your existing vacation rental, or exploring rental arbitrage opportunities, understanding the Town of Liberty Airbnb data is crucial. Leveraging the low regulation environment is key to maximizing your short term rental income potential. Let's dive into the specifics.
Key Town of Liberty Airbnb Performance Metrics Overview
Monthly Airbnb Revenue Variations & Income Potential in Town of Liberty (2026)
Understanding the monthly revenue variations for Airbnb listings in Town of Liberty is key to maximizing your short term rental income potential. Seasonality significantly impacts earnings. Our analysis, based on data from the past 12 months, shows that the peak revenue month for STRs in Town of Liberty is typically August, while February often presents the lowest earnings, highlighting opportunities for strategic pricing adjustments during shoulder and low seasons. Explore the typical Airbnb income in Town of Liberty across different performance tiers:
- Best-in-class properties (Top 10%) achieve $9,113+ monthly, often utilizing dynamic pricing and superior guest experiences.
- Strong performing properties (Top 25%) earn $5,650 or more, indicating effective management and desirable locations/amenities.
- Typical properties (Median) generate around $3,072 per month, representing the average market performance.
- Entry-level properties (Bottom 25%) see earnings around $1,368, often with potential for optimization.
Average Monthly Airbnb Earnings Trend in Town of Liberty
Town of Liberty Airbnb Occupancy Rate Trends (2026)
Maximize your bookings by understanding the Town of Liberty STR occupancy trends. Seasonal demand shifts significantly influence how often properties are booked. Typically, Augustsees the highest demand (peak season occupancy), while March experiences the lowest (low season). Effective strategies, like adjusting minimum stays or offering promotions, can boost occupancy during slower periods. Here's how different property tiers perform in Town of Liberty:
- Best-in-class properties (Top 10%) achieve 68%+ occupancy, indicating high desirability and potentially optimized availability.
- Strong performing properties (Top 25%) maintain 49% or higher occupancy, suggesting good market fit and guest satisfaction.
- Typical properties (Median) have an occupancy rate around 30%.
- Entry-level properties (Bottom 25%) average 16% occupancy, potentially facing higher vacancy.
Average Monthly Occupancy Rate Trend in Town of Liberty
Average Daily Rate (ADR) Airbnb Trends in Town of Liberty (2026)
Effective short term rental pricing strategy in Town of Liberty involves understanding monthly ADR fluctuations. The Average Daily Rate (ADR) for Airbnb in Town of Liberty typically peaks in July and dips lowest during February. Leveraging Airbnb dynamic pricing tools or strategies based on this seasonality can significantly boost revenue. Here's a look at the typical nightly rates achieved:
- Best-in-class properties (Top 10%) command rates of $643+ per night, often due to premium features or locations.
- Strong performing properties (Top 25%) achieve nightly rates of $397 or more.
- Typical properties (Median) charge around $268 per night.
- Entry-level properties (Bottom 25%) earn around $165 per night.
Average Daily Rate (ADR) Trend by Month in Town of Liberty
Get Live Town of Liberty Market Intelligence 👇

Explore Real-time Analytics
Airbnb Seasonality Analysis & Trends in Town of Liberty (2026)
Peak Season (August, July, June)
- Revenue averages $6,242 per month
- Occupancy rates average 42.3%
- Daily rates average $376
Shoulder Season
- Revenue averages $4,156 per month
- Occupancy maintains around 33.8%
- Daily rates hold near $355
Low Season (February, March, April)
- Revenue drops to average $2,720 per month
- Occupancy decreases to average 29.6%
- Daily rates adjust to average $304
Seasonality Insights for Town of Liberty
- The Airbnb seasonality in Town of Liberty shows highly seasonal trends requiring careful strategy. While the sections above show seasonal averages, it's also insightful to look at the extremes:
- During the high season, the absolute peak month showcases Town of Liberty's highest earning potential, with monthly revenues capable of climbing to $7,179, occupancy reaching a high of 45.8%, and ADRs peaking at $379.
- Conversely, the slowest single month of the year, typically falling within the low season, marks the market's lowest point. In this month, revenue might dip to $2,388, occupancy could drop to 27.1%, and ADRs may adjust down to $298.
- Understanding both the seasonal averages and these monthly peaks and troughs in revenue, occupancy, and ADR is crucial for maximizing your Airbnb profit potential in Town of Liberty.
Seasonal Strategies for Maximizing Profit
- Peak Season: Maximize revenue through premium pricing and potentially longer minimum stays. Ensure high availability.
- Low Season: Offer competitive pricing, special promotions (e.g., extended stay discounts), and flexible cancellation policies. Target off-season travelers like remote workers or budget-conscious guests.
- Shoulder Seasons: Implement dynamic pricing that balances peak and low rates. Target weekend travelers or specific events. Offer slightly more flexible terms than peak season.
- Regularly analyze your own performance against these Town of Liberty seasonality benchmarks and adjust your pricing and availability strategy accordingly.
Best Areas for Airbnb Investment in Town of Liberty (2026)
Exploring the top neighborhoods for short-term rentals in Town of Liberty? This section highlights key areas, outlining why they are attractive for hosts and guests, along with notable local attractions. Consider these locations based on your target guest profile and investment strategy.
| Neighborhood / Area | Why Host Here? (Target Guests & Appeal) | Key Attractions & Landmarks |
|---|---|---|
| Hurleyville | Charming small town with a rich history and a growing arts scene. Offers guests a quaint getaway with easy access to outdoor activities in the Catskills. | D&H Canal Historical Society, Hurleyville Arts Centre, local hiking trails, Crystal Lake, community events |
| Liberty Village | The main town of Liberty features a variety of local shops, restaurants, and attractions. Great for families and groups looking for a convenient location. | Liberty Museum, local dining options, Walton Lake, Liberty Cinema, year-round events |
| Catskill Park | A beautiful natural area perfect for outdoor enthusiasts. Ideal for guests looking to hike, fish, and enjoy nature in the scenic Catskills. | Kaaterskill Falls, Hiking Trails, Woodland Valley State Park, Scenic Viewpoints, Wildlife Viewing |
| Lake Irene | A beautiful lake offering a peaceful retreat. Perfect for relaxing stays and water activities like fishing and kayaking. | Fishing, Boating, Scenic Trails, Picnic Areas, Wildflower Viewing |
| Monticello | Nearby town with more entertainment options and amenities, popular for those looking for a mix of activities and attractions. | Monticello Casino and Raceway, local dining, shopping centers, Shawangunk Mountains, annual fairs |
| Bethel Woods | The site of the original Woodstock festival, now hosts concerts and cultural events. A must-visit for music lovers and history buffs. | Bethel Woods Center for the Arts, Woodstock Museum, The Original Woodstock Site, nature trails, outdoor concerts |
| Sullivan County | Recognized for its diverse recreational activities and beautiful landscapes. Attracts tourists year-round for leisure and adventure. | Sullivan County Historical Society, local wineries, ski resorts, lakes for fishing, scenic drives |
| Youngsville | A quiet, picturesque town ideal for those seeking a tranquil setting. Offers a cozy vibe and access to nature. | local cafes, scenic parks, hiking opportunities, art galleries, community markets |
Understanding Airbnb License Requirements & STR Laws in Town of Liberty (2026)
While Town of Liberty, New York, United States currently shows low STR regulations, specific Airbnb license requirements might still exist or change. Always verify the latest short term rental regulations and Airbnb license requirements directly with local government authorities for Town of Liberty to ensure full compliance before hosting.
(Source: AirROI data, 2026, finding no licensed listings among those analyzed)
Top Performing Airbnb Properties in Town of Liberty (2026)
Benchmark your potential! Explore examples of top-performing Airbnb properties in Town of Libertybased on Trailing Twelve Month (TTM) revenue. Analyze their characteristics, revenue, occupancy rate, and ADR to understand what drives success in this market.
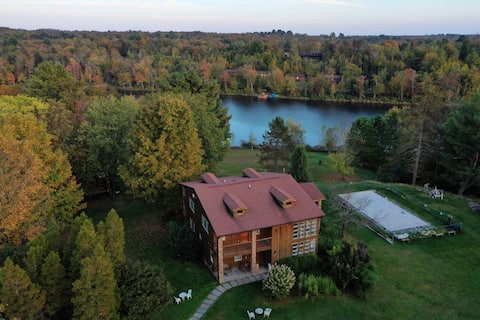
The Catskills Estate at the Swan Lake
Entire Place • 8 bedrooms
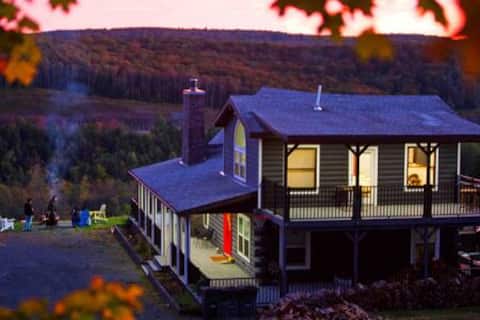
Upscale Retreat Lodge and Cabins
Entire Place • 9 bedrooms

Lakeside Barn Estate- 3 Cozy Homes+Pool+Hot Tub!
Entire Place • 13 bedrooms
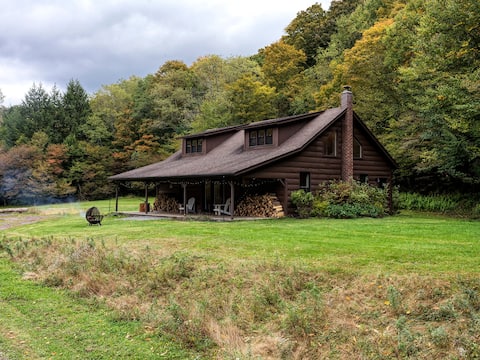
Au Bon Orchard - Hot Tub - 56 Private Acres
Entire Place • 3 bedrooms
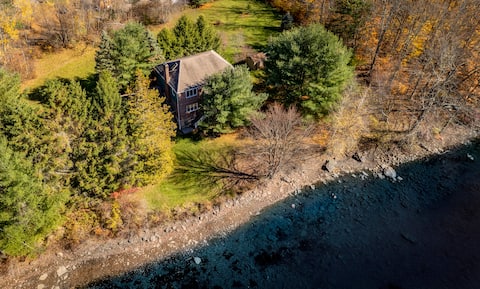
Lakefront Paradise *7 Bedrooms *17 Beds *Hot Tub
Entire Place • 7 bedrooms

Stunning Mountain Cabin w/ Pool & Hot Tub
Entire Place • 5 bedrooms
Note: Performance varies based on location, size, amenities, seasonality, and management quality. Data reflects the past 12 months.
Top Performing Airbnb Hosts in Town of Liberty (2026)
Learn from the best! This table showcases top-performing Airbnb hosts in Town of Liberty based on the number of properties managed and estimated total revenue over the past year. Analyze their scale and performance metrics.
| Host Name | Properties | Grossing Revenue | Stay Reviews | Avg Rating |
|---|---|---|---|---|
| Faye | 1 | $284,540 | 152 | 4.90/5.0 |
| Isaac | 4 | $253,700 | 72 | 4.88/5.0 |
| Johnathan | 1 | $191,636 | 21 | 4.95/5.0 |
| Jerry | 4 | $146,450 | 66 | 4.94/5.0 |
| Ellen | 1 | $126,843 | 93 | 4.95/5.0 |
| Vacation Villas | 1 | $121,612 | 86 | 4.72/5.0 |
| Anna | 1 | $102,087 | 223 | 4.83/5.0 |
| Courtney | 1 | $97,234 | 118 | 4.99/5.0 |
| Sharona | 1 | $97,041 | 41 | 4.80/5.0 |
| Jill | 1 | $90,649 | 259 | 4.93/5.0 |
Analyzing the strategies of top hosts, such as their property selection, pricing, and guest communication, can offer valuable lessons for optimizing your own Airbnb operations in Town of Liberty.
Dive Deeper: Advanced Town of Liberty STR Market Data (2026)
Ready to unlock more insights? AirROI provides access to advanced metrics and comprehensive Airbnb data for Town of Liberty. Explore detailed analytics beyond this report to refine your investment strategy, optimize pricing, and maximize your vacation rental profits.
Explore Advanced MetricsTown of Liberty Short-Term Rental Market Composition (2026): Property & Room Types
Room Type Distribution
Property Type Distribution
Market Composition Insights for Town of Liberty
- The Town of Liberty Airbnb market composition is heavily skewed towards Entire Home/Apt listings, which make up 100% of the 89 active rentals. This indicates strong guest preference for privacy and space.
- Looking at the property type distribution in Town of Liberty, House properties are the most common (66.3%), reflecting the local real estate landscape.
- Houses represent a significant 66.3% portion, catering likely to families or larger groups.
- Smaller segments like apartment/condo, hotel/boutique, others (combined 8.9%) offer potential for unique stay experiences.
Town of Liberty Airbnb Room Capacity Analysis (2026): Bedroom Distribution
Distribution of Listings by Number of Bedrooms
Room Capacity Insights for Town of Liberty
- The dominant room capacity in Town of Liberty is 3 bedrooms listings, making up 29.2% of the market. This suggests a strong demand for properties suitable for families or small groups.
- Together, 3 bedrooms and 2 bedrooms properties represent 50.5% of the active Airbnb listings in Town of Liberty, indicating a high concentration in these sizes.
- A significant 59.6% of listings offer 3+ bedrooms, catering to larger groups and families seeking more space in Town of Liberty.
Town of Liberty Vacation Rental Guest Capacity Trends (2026)
Distribution of Listings by Guest Capacity
Guest Capacity Insights for Town of Liberty
- The most common guest capacity trend in Town of Liberty vacation rentals is listings accommodating 8+ guests (39.3%). This suggests the primary traveler segment is likely larger groups.
- Properties designed for 8+ guests and 4 guests dominate the Town of Liberty STR market, accounting for 64.0% of listings.
- 64.0% of properties accommodate 6+ guests, serving the market segment for larger families or group travel in Town of Liberty.
- On average, properties in Town of Liberty are equipped to host 5.9 guests.
Town of Liberty Airbnb Booking Patterns (2026): Available vs. Booked Days
Available Days Distribution
Booked Days Distribution
Booking Pattern Insights for Town of Liberty
- The most common availability pattern in Town of Liberty falls within the 271-366 days range, representing 51.7% of listings. This suggests many properties have significant open periods on their calendars.
- Approximately 87.7% of listings show high availability (181+ days open annually), indicating potential for increased bookings or specific owner usage patterns.
- For booked days, the 91-180 days range is most frequent in Town of Liberty (37.1%), reflecting common guest stay durations or potential owner blocking patterns.
- A notable 12.3% of properties secure long booking periods (181+ days booked per year), highlighting successful long-term rental strategies or significant owner usage.
Town of Liberty Airbnb Minimum Stay Requirements Analysis
Distribution of Listings by Minimum Night Requirement
1 Night
25 listings
28.1% of total
2 Nights
33 listings
37.1% of total
3 Nights
1 listings
1.1% of total
4-6 Nights
1 listings
1.1% of total
30+ Nights
29 listings
32.6% of total
Key Insights
- The most prevalent minimum stay requirement in Town of Liberty is 2 Nights, adopted by 37.1% of listings. This highlights the market's preference for shorter, flexible bookings.
- A strong majority (65.2%) of the Town of Liberty Airbnb data shows acceptance of very short stays (1-2 nights), indicating a dynamic, high-turnover market.
- A significant segment (32.6%) caters to monthly stays (30+ nights) in Town of Liberty, pointing to opportunities in the extended-stay market.
Recommendations
- Align with the market by considering a 2 Nights minimum stay, as 37.1% of Town of Liberty hosts use this setting.
- If feasible, allowing 1-night stays, especially midweek or during low season, could capture last-minute bookings, as only 28.1% currently do.
- Explore offering discounts for stays of 30+ nights to attract the 32.6% of the market seeking extended stays.
- Adjust minimum nights based on seasonality – potentially shorter during low season and longer during peak demand periods in Town of Liberty.
Town of Liberty Airbnb Cancellation Policy Trends Analysis (2026)
Super Strict 30 Days
1 listings
1.1% of total
Limited
1 listings
1.1% of total
Super Strict 60 Days
2 listings
2.2% of total
Flexible
12 listings
13.5% of total
Moderate
28 listings
31.5% of total
Firm
38 listings
42.7% of total
Strict
7 listings
7.9% of total
Cancellation Policy Insights for Town of Liberty
- The prevailing Airbnb cancellation policy trend in Town of Liberty is Firm, used by 42.7% of listings.
- A majority (50.6%) of hosts in Town of Liberty utilize Firm or Strict policies, indicating a market where hosts prioritize booking security.
- Strict cancellation policies are quite rare (7.9%), potentially making listings with this policy less competitive unless justified by high demand or property type.
Recommendations for Hosts
- Consider adopting a Firm policy to align with the 42.7% market standard in Town of Liberty.
- Using a Strict policy might deter some guests, as only 7.9% of listings use it. Evaluate if potential revenue protection outweighs possible lower booking rates.
- Regularly review your cancellation policy against competitors and market demand shifts in Town of Liberty.
Town of Liberty STR Booking Lead Time Analysis (2026)
Average Booking Lead Time by Month
Booking Lead Time Insights for Town of Liberty
- The overall average booking lead time for vacation rentals in Town of Liberty is 34 days.
- Guests book furthest in advance for stays during August (average 52 days), likely coinciding with peak travel demand or local events.
- The shortest booking windows occur for stays in February (average 18 days), indicating more last-minute travel plans during this time.
- Seasonally, Summer (46 days avg.) sees the longest lead times, while Winter (25 days avg.) has the shortest, reflecting typical travel planning cycles.
Recommendations for Hosts
- Use the overall average lead time (34 days) as a baseline for your pricing and availability strategy in Town of Liberty.
- For August stays, consider implementing length-of-stay discounts or slightly higher rates for bookings made less than 52 days out to capitalize on advance planning.
- Target marketing efforts for the Summer season well in advance (at least 46 days) to capture early planners.
- Monitor your own booking lead times against these Town of Liberty averages to identify opportunities for dynamic pricing adjustments.
Popular & Essential Airbnb Amenities in Town of Liberty (2026)
Amenity Prevalence
Amenity Insights for Town of Liberty
- Essential amenities in Town of Liberty that guests expect include: Free parking on premises, Heating. Lacking these (any) could significantly impact bookings.
- Popular amenities like Hot water, Cooking basics, Smoke alarm are common but not universal. Offering these can provide a competitive edge.
- Warning: Wifi is not universally provided but is considered essential globally. Ensure reliable Wifi is offered.
Recommendations for Hosts
- Ensure your listing includes all essential amenities for Town of Liberty: Free parking on premises, Heating.
- Prioritize adding missing essentials: Heating.
- Consider adding popular differentiators like Hot water or Cooking basics to increase appeal.
- Highlight unique or less common amenities you offer (e.g., hot tub, dedicated workspace, EV charger) in your listing description and photos.
- Regularly check competitor amenities in Town of Liberty to stay competitive.
Town of Liberty Airbnb Guest Demographics & Profile Analysis (2026)
Guest Profile Summary for Town of Liberty
- The typical guest profile for Airbnb in Town of Liberty consists of primarily domestic travelers (95%), often arriving from nearby New York, typically belonging to the Post-2000s (Gen Z/Alpha) group (50%), primarily speaking English or Spanish.
- Domestic travelers account for 94.6% of guests.
- Key international markets include United States (94.6%) and United Kingdom (0.8%).
- Top languages spoken are English (60.3%) followed by Spanish (18.6%).
- A significant demographic segment is the Post-2000s (Gen Z/Alpha) group, representing 50% of guests.
Recommendations for Hosts
- Target domestic marketing efforts towards travelers from New York and Philadelphia.
- Tailor amenities and listing descriptions to appeal to the dominant Post-2000s (Gen Z/Alpha) demographic (e.g., highlight fast WiFi, smart home features, local guides).
- Highlight unique local experiences or amenities relevant to the primary guest profile.
- Consider seasonal promotions aligned with peak travel times for key origin markets.
Nearby Short-Term Rental Market Comparison
How does the Town of Liberty Airbnb market stack up against its neighbors? Compare key performance metrics like average monthly revenue, ADR, and occupancy rates in surrounding areas to understand the broader regional STR landscape.
| Market | Active Properties | Monthly Revenue | Daily Rate | Avg. Occupancy |
|---|---|---|---|---|
| Freeland | 11 | $8,436 | $684.29 | 42% |
| Berlin Township | 15 | $7,208 | $729.10 | 35% |
| Town of Kingston | 10 | $6,470 | $473.76 | 49% |
| Frankford Township | 11 | $6,329 | $505.19 | 41% |
| Spring Lake Heights | 16 | $5,785 | $725.20 | 40% |
| Stroud Township | 137 | $5,728 | $478.40 | 40% |
| Town of Monroe | 22 | $5,690 | $720.52 | 37% |
| Town of Ancram | 22 | $5,616 | $512.55 | 38% |
| Hilltown Township | 11 | $5,557 | $578.96 | 40% |
| Mount Pocono | 22 | $5,346 | $485.18 | 45% |