Town of Horseheads Airbnb Market Analysis 2026: Short Term Rental Data & Vacation Rental Statistics in New York, United States
Is Airbnb profitable in Town of Horseheads in 2026? Explore comprehensive Airbnb analytics for Town of Horseheads, New York, United States to uncover income potential. This 2026 STR market report for Town of Horseheads, based on AirROI data from February 2025 to January 2026, reveals key trends in the niche market of 30 active listings.
Whether you're considering an Airbnb investment in Town of Horseheads, optimizing your existing vacation rental, or exploring rental arbitrage opportunities, understanding the Town of Horseheads Airbnb data is crucial. Leveraging the low regulation environment is key to maximizing your short term rental income potential. Let's dive into the specifics.
Key Town of Horseheads Airbnb Performance Metrics Overview
Monthly Airbnb Revenue Variations & Income Potential in Town of Horseheads (2026)
Understanding the monthly revenue variations for Airbnb listings in Town of Horseheads is key to maximizing your short term rental income potential. Seasonality significantly impacts earnings. Our analysis, based on data from the past 12 months, shows that the peak revenue month for STRs in Town of Horseheads is typically July, while January often presents the lowest earnings, highlighting opportunities for strategic pricing adjustments during shoulder and low seasons. Explore the typical Airbnb income in Town of Horseheads across different performance tiers:
- Best-in-class properties (Top 10%) achieve $4,132+ monthly, often utilizing dynamic pricing and superior guest experiences.
- Strong performing properties (Top 25%) earn $2,967 or more, indicating effective management and desirable locations/amenities.
- Typical properties (Median) generate around $2,007 per month, representing the average market performance.
- Entry-level properties (Bottom 25%) see earnings around $947, often with potential for optimization.
Average Monthly Airbnb Earnings Trend in Town of Horseheads
Town of Horseheads Airbnb Occupancy Rate Trends (2026)
Maximize your bookings by understanding the Town of Horseheads STR occupancy trends. Seasonal demand shifts significantly influence how often properties are booked. Typically, Julysees the highest demand (peak season occupancy), while January experiences the lowest (low season). Effective strategies, like adjusting minimum stays or offering promotions, can boost occupancy during slower periods. Here's how different property tiers perform in Town of Horseheads:
- Best-in-class properties (Top 10%) achieve 78%+ occupancy, indicating high desirability and potentially optimized availability.
- Strong performing properties (Top 25%) maintain 66% or higher occupancy, suggesting good market fit and guest satisfaction.
- Typical properties (Median) have an occupancy rate around 44%.
- Entry-level properties (Bottom 25%) average 22% occupancy, potentially facing higher vacancy.
Average Monthly Occupancy Rate Trend in Town of Horseheads
Average Daily Rate (ADR) Airbnb Trends in Town of Horseheads (2026)
Effective short term rental pricing strategy in Town of Horseheads involves understanding monthly ADR fluctuations. The Average Daily Rate (ADR) for Airbnb in Town of Horseheads typically peaks in October and dips lowest during March. Leveraging Airbnb dynamic pricing tools or strategies based on this seasonality can significantly boost revenue. Here's a look at the typical nightly rates achieved:
- Best-in-class properties (Top 10%) command rates of $239+ per night, often due to premium features or locations.
- Strong performing properties (Top 25%) achieve nightly rates of $182 or more.
- Typical properties (Median) charge around $128 per night.
- Entry-level properties (Bottom 25%) earn around $103 per night.
Average Daily Rate (ADR) Trend by Month in Town of Horseheads
Get Live Town of Horseheads Market Intelligence 👇
Explore Real-time Analytics
Airbnb Seasonality Analysis & Trends in Town of Horseheads (2026)
Peak Season (July, August, October)
- Revenue averages $2,737 per month
- Occupancy rates average 52.6%
- Daily rates average $161
Shoulder Season
- Revenue averages $2,213 per month
- Occupancy maintains around 46.1%
- Daily rates hold near $160
Low Season (January, February, March)
- Revenue drops to average $1,409 per month
- Occupancy decreases to average 34.6%
- Daily rates adjust to average $148
Seasonality Insights for Town of Horseheads
- The Airbnb seasonality in Town of Horseheads shows highly seasonal trends requiring careful strategy. While the sections above show seasonal averages, it's also insightful to look at the extremes:
- During the high season, the absolute peak month showcases Town of Horseheads's highest earning potential, with monthly revenues capable of climbing to $2,849, occupancy reaching a high of 54.7%, and ADRs peaking at $174.
- Conversely, the slowest single month of the year, typically falling within the low season, marks the market's lowest point. In this month, revenue might dip to $1,102, occupancy could drop to 25.1%, and ADRs may adjust down to $138.
- Understanding both the seasonal averages and these monthly peaks and troughs in revenue, occupancy, and ADR is crucial for maximizing your Airbnb profit potential in Town of Horseheads.
Seasonal Strategies for Maximizing Profit
- Peak Season: Maximize revenue through premium pricing and potentially longer minimum stays. Ensure high availability.
- Low Season: Offer competitive pricing, special promotions (e.g., extended stay discounts), and flexible cancellation policies. Target off-season travelers like remote workers or budget-conscious guests.
- Shoulder Seasons: Implement dynamic pricing that balances peak and low rates. Target weekend travelers or specific events. Offer slightly more flexible terms than peak season.
- Regularly analyze your own performance against these Town of Horseheads seasonality benchmarks and adjust your pricing and availability strategy accordingly.
Best Areas for Airbnb Investment in Town of Horseheads (2026)
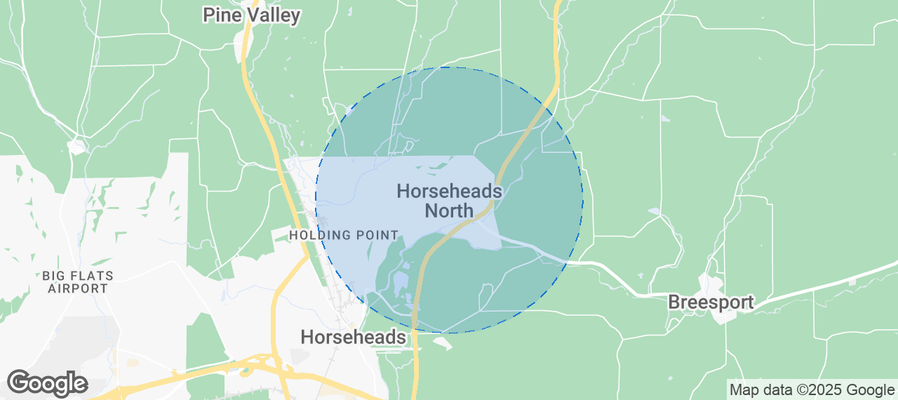
Exploring the top neighborhoods for short-term rentals in Town of Horseheads? This section highlights key areas, outlining why they are attractive for hosts and guests, along with notable local attractions. Consider these locations based on your target guest profile and investment strategy.
| Neighborhood / Area | Why Host Here? (Target Guests & Appeal) | Key Attractions & Landmarks |
|---|---|---|
| Horseheads Downtown | The heart of the Town of Horseheads, offering local shops, restaurants, and a sense of community. Great for visitors looking to explore local culture and convenient amenities. | Horseheads Historical Society, Horseheads Town Park, local boutiques, restaurants, coffee shops |
| Eldridge Park | A picturesque park area with recreational facilities and family-friendly activities. Perfect for families and outdoor enthusiasts who enjoy parks and scenic views. | Eldridge Park, the pond, picnic areas, playgrounds, walking trails |
| Horseheads Fairgrounds | Home to various local events and fairs throughout the year. Attractive for visitors during events, fairs, and local community gatherings. | Horseheads Fair, local equestrian events, craft fairs, food festivals |
| Watkins Glen State Park | A short drive from Horseheads, this is one of New York's most popular parks known for its stunning waterfalls and hiking trails. Ideal for nature lovers visiting the region. | Glen Creek, waterfalls, hiking trails, picnicking areas, scenic viewpoints |
| Corning Museum of Glass | Located nearby in Corning, this world-class museum showcases glass art and history. A major attraction in the region that draws visitors year-round. | glassblowing demonstrations, art exhibits, interactive experiences, shop for glass art |
| Chemung Valley | Rich in history and natural beauty, the valley offers a variety of outdoor activities and historical sites. Excellent for those interested in exploring local history and nature. | Chemung River, historic sites, hiking and outdoor activities, nature trails |
| Local Vineyards and Wineries | The region boasts beautiful vineyards and wineries, attracting wine enthusiasts and those looking for scenic wine tours. Great for visitors looking to explore local wines. | wine tastings, vineyard tours, beautiful landscapes, local dining experiences |
| Elmira College and nearby attractions | The presence of Elmira College adds a youthful vibe and educational opportunities. Attracts students, families, and visitors attending college events. | Elmira College, local arts events, theatre productions, community activities |
Understanding Airbnb License Requirements & STR Laws in Town of Horseheads (2026)
While Town of Horseheads, New York, United States currently shows low STR regulations, specific Airbnb license requirements might still exist or change. Always verify the latest short term rental regulations and Airbnb license requirements directly with local government authorities for Town of Horseheads to ensure full compliance before hosting.
(Source: AirROI data, 2026, finding no licensed listings among those analyzed)
Top Performing Airbnb Properties in Town of Horseheads (2026)
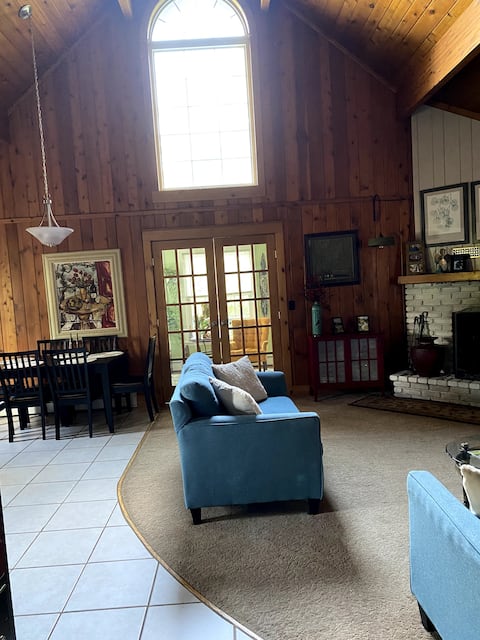
Benchmark your potential! Explore examples of top-performing Airbnb properties in Town of Horseheadsbased on Trailing Twelve Month (TTM) revenue. Analyze their characteristics, revenue, occupancy rate, and ADR to understand what drives success in this market.

Old farmhouse with Hot tub in the Finger Lakes
Entire Place • 4 bedrooms
Peaceful 2 Bedroom Retreat
Entire Place • 2 bedrooms
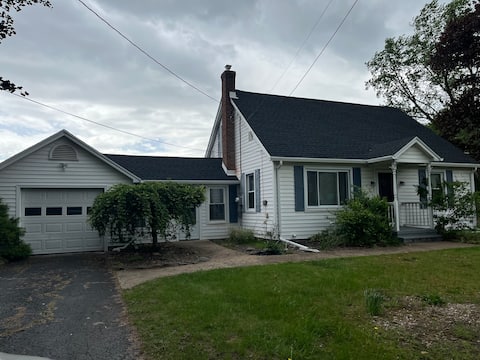
Charming Horseheads, NY Cottage with Comfy Beds!
Entire Place • 3 bedrooms

Comfy Ranch House 3BR/2BA
Entire Place • 3 bedrooms
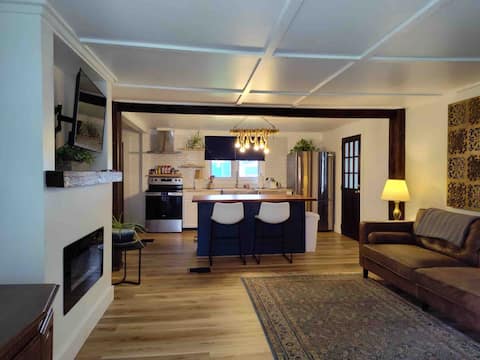
Lovely two bedroom ranch in Elmira Heights
Entire Place • 2 bedrooms
The Antique Pump House 10 min from Watkins Glen
Entire Place • 2 bedrooms
Note: Performance varies based on location, size, amenities, seasonality, and management quality. Data reflects the past 12 months.
Top Performing Airbnb Hosts in Town of Horseheads (2026)
Learn from the best! This table showcases top-performing Airbnb hosts in Town of Horseheads based on the number of properties managed and estimated total revenue over the past year. Analyze their scale and performance metrics.
| Host Name | Properties | Grossing Revenue | Stay Reviews | Avg Rating |
|---|---|---|---|---|
| Ana Maria | 4 | $83,473 | 420 | 4.87/5.0 |
| Beth | 2 | $43,731 | 33 | 4.96/5.0 |
| Karen | 2 | $40,848 | 502 | 4.95/5.0 |
| Daniel | 1 | $38,644 | 39 | 4.79/5.0 |
| Pamela | 1 | $37,792 | 55 | 4.95/5.0 |
| Josette | 1 | $37,351 | 8 | 5.00/5.0 |
| Andy | 1 | $35,791 | 150 | 4.96/5.0 |
| Philip And Lauren | 2 | $32,559 | 48 | 4.61/5.0 |
| Muriah | 1 | $32,511 | 51 | 4.82/5.0 |
| Ismael | 1 | $31,304 | 17 | 4.71/5.0 |
Analyzing the strategies of top hosts, such as their property selection, pricing, and guest communication, can offer valuable lessons for optimizing your own Airbnb operations in Town of Horseheads.
Dive Deeper: Advanced Town of Horseheads STR Market Data (2026)
Ready to unlock more insights? AirROI provides access to advanced metrics and comprehensive Airbnb data for Town of Horseheads. Explore detailed analytics beyond this report to refine your investment strategy, optimize pricing, and maximize your vacation rental profits.
Explore Advanced MetricsTown of Horseheads Short-Term Rental Market Composition (2026): Property & Room Types
Room Type Distribution
Property Type Distribution
Market Composition Insights for Town of Horseheads
- The Town of Horseheads Airbnb market composition is heavily skewed towards Entire Home/Apt listings, which make up 90% of the 30 active rentals. This indicates strong guest preference for privacy and space.
- Looking at the property type distribution in Town of Horseheads, House properties are the most common (56.7%), reflecting the local real estate landscape.
- Houses represent a significant 56.7% portion, catering likely to families or larger groups.
Town of Horseheads Airbnb Room Capacity Analysis (2026): Bedroom Distribution
Distribution of Listings by Number of Bedrooms
Room Capacity Insights for Town of Horseheads
- The dominant room capacity in Town of Horseheads is 2 bedrooms listings, making up 36.7% of the market. This suggests a strong demand for properties suitable for couples or solo travelers.
- Together, 2 bedrooms and 1 bedroom properties represent 60.0% of the active Airbnb listings in Town of Horseheads, indicating a high concentration in these sizes.
- A significant 30.0% of listings offer 3+ bedrooms, catering to larger groups and families seeking more space in Town of Horseheads.
Town of Horseheads Vacation Rental Guest Capacity Trends (2026)
Distribution of Listings by Guest Capacity
Guest Capacity Insights for Town of Horseheads
- The most common guest capacity trend in Town of Horseheads vacation rentals is listings accommodating 8+ guests (23.3%). This suggests the primary traveler segment is likely larger groups.
- Properties designed for 8+ guests and 4 guests dominate the Town of Horseheads STR market, accounting for 46.6% of listings.
- 30.0% of properties accommodate 6+ guests, serving the market segment for larger families or group travel in Town of Horseheads.
- On average, properties in Town of Horseheads are equipped to host 4.3 guests.
Town of Horseheads Airbnb Booking Patterns (2026): Available vs. Booked Days
Available Days Distribution
Booked Days Distribution
Booking Pattern Insights for Town of Horseheads
- The most common availability pattern in Town of Horseheads falls within the 181-270 days range, representing 53.3% of listings. This suggests many properties have significant open periods on their calendars.
- Approximately 83.3% of listings show high availability (181+ days open annually), indicating potential for increased bookings or specific owner usage patterns.
- For booked days, the 91-180 days range is most frequent in Town of Horseheads (50%), reflecting common guest stay durations or potential owner blocking patterns.
- A notable 20.0% of properties secure long booking periods (181+ days booked per year), highlighting successful long-term rental strategies or significant owner usage.
Town of Horseheads Airbnb Minimum Stay Requirements Analysis
Distribution of Listings by Minimum Night Requirement
1 Night
14 listings
46.7% of total
2 Nights
6 listings
20% of total
4-6 Nights
1 listings
3.3% of total
7-29 Nights
3 listings
10% of total
30+ Nights
6 listings
20% of total
Key Insights
- The most prevalent minimum stay requirement in Town of Horseheads is 1 Night, adopted by 46.7% of listings. This highlights the market's preference for shorter, flexible bookings.
- A strong majority (66.7%) of the Town of Horseheads Airbnb data shows acceptance of very short stays (1-2 nights), indicating a dynamic, high-turnover market.
- A significant segment (20%) caters to monthly stays (30+ nights) in Town of Horseheads, pointing to opportunities in the extended-stay market.
Recommendations
- Align with the market by considering a 1 Night minimum stay, as 46.7% of Town of Horseheads hosts use this setting.
- Explore offering discounts for stays of 30+ nights to attract the 20% of the market seeking extended stays.
- Adjust minimum nights based on seasonality – potentially shorter during low season and longer during peak demand periods in Town of Horseheads.
Town of Horseheads Airbnb Cancellation Policy Trends Analysis (2026)
Flexible
12 listings
40% of total
Moderate
9 listings
30% of total
Firm
8 listings
26.7% of total
Strict
1 listings
3.3% of total
Cancellation Policy Insights for Town of Horseheads
- The prevailing Airbnb cancellation policy trend in Town of Horseheads is Flexible, used by 40% of listings.
- There's a relatively balanced mix between guest-friendly (70.0%) and stricter (30.0%) policies, offering choices for different guest needs.
- Strict cancellation policies are quite rare (3.3%), potentially making listings with this policy less competitive unless justified by high demand or property type.
Recommendations for Hosts
- Consider adopting a Flexible policy to align with the 40% market standard in Town of Horseheads.
- Using a Strict policy might deter some guests, as only 3.3% of listings use it. Evaluate if potential revenue protection outweighs possible lower booking rates.
- Regularly review your cancellation policy against competitors and market demand shifts in Town of Horseheads.
Town of Horseheads STR Booking Lead Time Analysis (2026)
Average Booking Lead Time by Month
Booking Lead Time Insights for Town of Horseheads
- The overall average booking lead time for vacation rentals in Town of Horseheads is 42 days.
- Guests book furthest in advance for stays during October (average 63 days), likely coinciding with peak travel demand or local events.
- The shortest booking windows occur for stays in February (average 14 days), indicating more last-minute travel plans during this time.
- Seasonally, Summer (47 days avg.) sees the longest lead times, while Winter (22 days avg.) has the shortest, reflecting typical travel planning cycles.
Recommendations for Hosts
- Use the overall average lead time (42 days) as a baseline for your pricing and availability strategy in Town of Horseheads.
- For October stays, consider implementing length-of-stay discounts or slightly higher rates for bookings made less than 63 days out to capitalize on advance planning.
- During February, focus on last-minute booking availability and promotions, as guests book with very short notice (14 days avg.).
- Target marketing efforts for the Summer season well in advance (at least 47 days) to capture early planners.
- Monitor your own booking lead times against these Town of Horseheads averages to identify opportunities for dynamic pricing adjustments.
Popular & Essential Airbnb Amenities in Town of Horseheads (2026)
Amenity Prevalence
Amenity Insights for Town of Horseheads
- Essential amenities in Town of Horseheads that guests expect include: Free parking on premises, Smoke alarm, Air conditioning. Lacking these (any) could significantly impact bookings.
- Popular amenities like Wifi, TV, Coffee maker are common but not universal. Offering these can provide a competitive edge.
- Warning: Wifi is not universally provided but is considered essential globally. Ensure reliable Wifi is offered.
Recommendations for Hosts
- Ensure your listing includes all essential amenities for Town of Horseheads: Free parking on premises, Smoke alarm, Air conditioning.
- Prioritize adding missing essentials: Air conditioning.
- Consider adding popular differentiators like Wifi or TV to increase appeal.
- Highlight unique or less common amenities you offer (e.g., hot tub, dedicated workspace, EV charger) in your listing description and photos.
- Regularly check competitor amenities in Town of Horseheads to stay competitive.
Town of Horseheads Airbnb Guest Demographics & Profile Analysis (2026)
Guest Profile Summary for Town of Horseheads
- The typical guest profile for Airbnb in Town of Horseheads consists of primarily domestic travelers (92%), often arriving from nearby New York, typically belonging to the Post-2000s (Gen Z/Alpha) group (50%), primarily speaking English or Spanish.
- Domestic travelers account for 92.2% of guests.
- Key international markets include United States (92.2%) and Canada (2.6%).
- Top languages spoken are English (71.9%) followed by Spanish (8.2%).
- A significant demographic segment is the Post-2000s (Gen Z/Alpha) group, representing 50% of guests.
Recommendations for Hosts
- Target domestic marketing efforts towards travelers from New York and Roseville.
- Tailor amenities and listing descriptions to appeal to the dominant Post-2000s (Gen Z/Alpha) demographic (e.g., highlight fast WiFi, smart home features, local guides).
- Highlight unique local experiences or amenities relevant to the primary guest profile.
- Consider seasonal promotions aligned with peak travel times for key origin markets.
Nearby Short-Term Rental Market Comparison
How does the Town of Horseheads Airbnb market stack up against its neighbors? Compare key performance metrics like average monthly revenue, ADR, and occupancy rates in surrounding areas to understand the broader regional STR landscape.
| Market | Active Properties | Monthly Revenue | Daily Rate | Avg. Occupancy |
|---|---|---|---|---|
| Freeland | 11 | $8,436 | $684.29 | 42% |
| Town of Trenton | 13 | $7,410 | $484.59 | 43% |
| Berlin Township | 15 | $7,208 | $729.10 | 35% |
| Stroud Township | 137 | $5,728 | $478.40 | 40% |
| Town of Torrey | 34 | $5,535 | $437.35 | 50% |
| Mount Pocono | 22 | $5,346 | $485.18 | 45% |
| Rushville | 16 | $5,126 | $656.66 | 41% |
| Pocono Summit | 11 | $5,114 | $548.58 | 43% |
| Pocono Township | 98 | $4,998 | $472.46 | 35% |
| Penn Estates | 47 | $4,823 | $412.20 | 44% |